. 2020 May 27;4(4):282-301.
doi: 10.1002/evl3.175. eCollection 2020 Aug.

Adaptation via pleiotropy and linkage: Association mapping reveals a complex genetic architecture within the stickleback Eda locus

Affiliations

Adaptation via pleiotropy and linkage: Association mapping reveals a complex genetic architecture within the stickleback Eda locus

Sophie L Archambeault et al. Evol Lett. .

Abstract

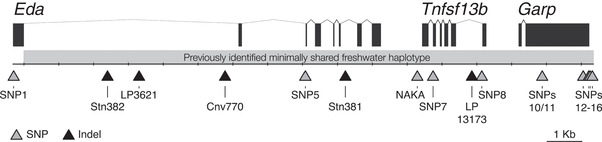
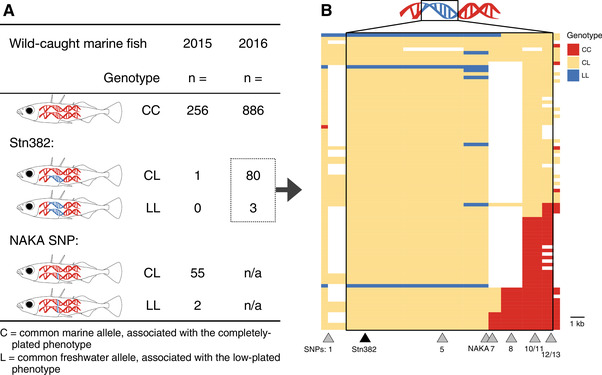
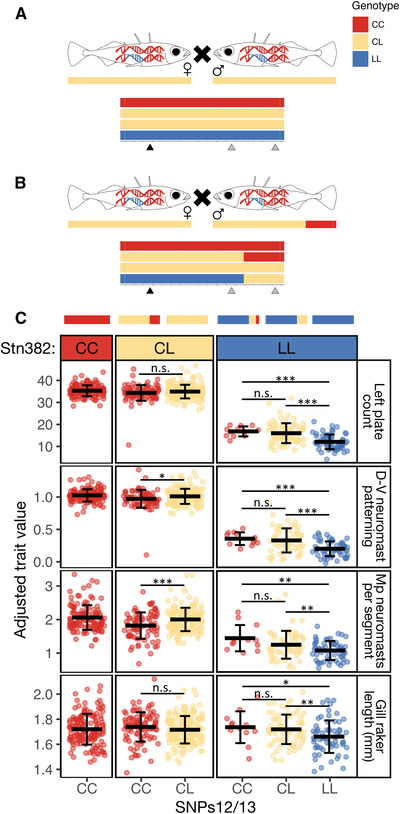
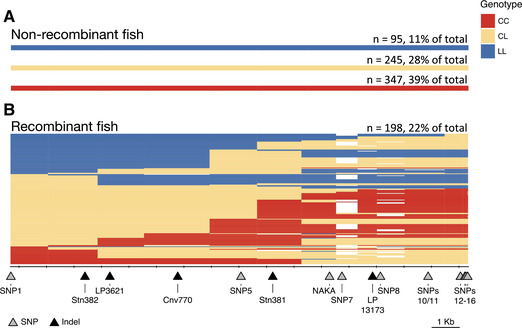
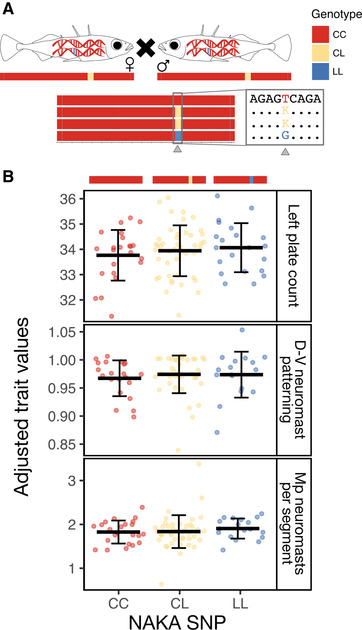
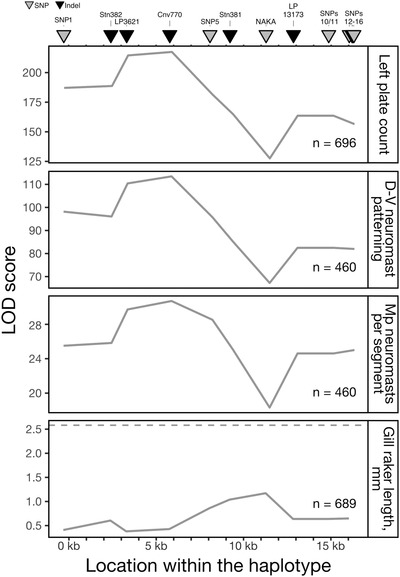
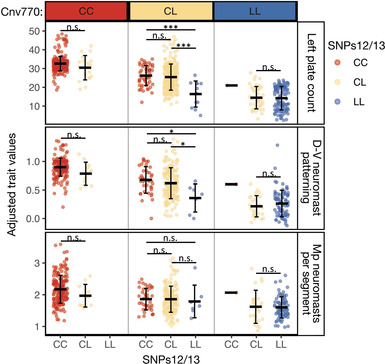
Genomic mapping of the loci associated with phenotypic evolution has revealed genomic "hotspots," or regions of the genome that control multiple phenotypic traits. This clustering of loci has important implications for the speed and maintenance of adaptation and could be due to pleiotropic effects of a single mutation or tight genetic linkage of multiple causative mutations affecting different traits. The threespine stickleback (Gasterosteus aculeatus) is a powerful model for the study of adaptive evolution because the marine ecotype has repeatedly adapted to freshwater environments across the northern hemisphere in the last 12,000 years. Freshwater ecotypes have repeatedly fixed a 16 kilobase haplotype on chromosome IV that contains Ectodysplasin (Eda), a gene known to affect multiple traits, including defensive armor plates, lateral line sensory hair cells, and schooling behavior. Many additional traits have previously been mapped to a larger region of chromosome IV that encompasses the Eda freshwater haplotype. To identify which of these traits specifically map to this adaptive haplotype, we made crosses of rare marine fish heterozygous for the freshwater haplotype in an otherwise marine genetic background. Further, we performed fine-scale association mapping in a fully interbreeding, polymorphic population of freshwater stickleback to disentangle the effects of pleiotropy and linkage on the phenotypes affected by this haplotype. Although we find evidence that linked mutations have small effects on a few phenotypes, a small 1.4-kb region within the first intron of Eda has large effects on three phenotypic traits: lateral plate count, and both the number and patterning of the posterior lateral line neuromasts. Thus, the Eda haplotype is a hotspot of adaptation in stickleback due to both a small, pleiotropic region affecting multiple traits as well as multiple linked mutations affecting additional traits.

Keywords: Adaptation; Ectodysplasin (Eda); Gasterosteus aculeatus; association mapping; lateral line neuromasts; lateral plates; linkage; pleiotropy; threespine stickleback.


Conflict of interest statement

The authors declare no conflict of interest.

Figures

Figure 1
Figure 1
The Eda haplotype contains three protein coding genes and 16 markers. The minimal region shared by most low‐plated, freshwater populations of threespine stickleback is 16‐kilobase long (gray bar). It contains the majority of three protein coding genes: Ectodysplasin (Eda), Tumor necrosis factor super‐family member 13b (Tnfsf13b), and Glycoprotein A rich protein (Garp). Genotyping assays were designed for 17 markers (triangles) that distinguish the marine or “C” allele (associated with the completely plated phenotype) and the freshwater or “L” allele (associated with the low‐plated phenotype). These markers are a mix of SNPs and indels indicated by gray and black triangles, respectively, and are listed in Table S1. Note: Exon 1 of Eda, and therefore SNP1, is outside the minimally shared freshwater haplotype.
Figure 2
Figure 2
Freshwater alleles persist in the marine population. (A) Marine stickleback were collected and genotyped from Puget Sound in two consecutive summers, 2015 and 2016. In 2015, wild‐caught fish were sampled in midwater, genotyped first at the NAKA SNP, and subsequently at Stn382. The frequency of the L allele at the NAKA SNP was 9.4%, whereas the frequency of the full freshwater Eda haplotype was 0.16%. In 2016, fish were sampled nearshore, genotyped at Stn382, and the frequency of the L allele was 4.4%. (B) The carriers of the L allele at Stn382 from 2016 were genotyped at a subset of additional markers, and their genotypes are represented visually. Each row represents a single fish (n = 83), and the subset of markers genotyped within the haplotype (designated by the box) is shown below the plot. Triangles mark the physical location of SNP1 and the genotyped markers within the haplotype. Coloring representing the genotypes extends halfway to the next marker location. Additional markers on either side of the haplotype (Cnv767 and SNP19, ∼10 kb 5′ and 3′ of the region, respectively) were genotyped and are represented visually to the left of SNP1 and to the right of SNPs12/13, respectively. Missing data are in white.
Figure 3
Figure 3
Crosses between Puget Sound fish carrying different‐sized haplotypes reveal effects of freshwater alleles on multiple phenotypes. (A) Schematic of the five crosses between heterozygous marine carriers of the full freshwater haplotype (CL genotype). (B) Schematic of the five crosses between one carrier of the full haplotype and one carrier of a short haplotype. In both (A) and (B), the possible genotypes of offspring are visualized below the parents, along with triangles marking the three markers at which offspring were genotyped—Stn382, NAKA SNP, and SNPs12/13. Not pictured is the single cross between two carriers of different short haplotypes, which produced some offspring with a tricolored haplotype, depicted in (C). (C) Trait values for four phenotypes are plotted by offspring genotypes at Stn382 and SNPs12/13. Representative haplotypes are drawn above the plots. Mean trait value ± SD are depicted by black lines and whiskers. Left plate count is strongly associated with genotype at Stn382 (LOD = 344; PVE = 93.6), and the C allele is dominant (CC and CL fish have similar trait values). However, SNPs12/13 are also associated with plate number in fish that are homozygous LL at Stn382 (fish LL at SNPs12/13 have fewer plates than fish CC and CL at SNPs12/13; t 151 = –6.54, P = 4.4 × 10–10). The same pattern is observed in the dorsal‐ventral (D‐V) patterning of neuromasts and the number of neuromasts per segment in the Mp line. In contrast, gill raker length is not associated with genotype at Stn382, but it is associated with genotype at SNPs12/13 (LOD = 4.6; PVE = 3.7). Adjusted trait values were calculated by adding the residual trait value for each individual to the predicted trait value when all the covariates are equal (sex, standard length, and family). Significance levels: * * * P < 0.001; * * P < 0.01; * P < 0.05; P > 0.05 (not significant).
Figure 4
Figure 4
Visual genotypes of Lake Washington fish reveal historical recombination events within the Eda haplotype. (A) Wild‐caught adult stickleback from Lake Washington (n = 885) were genotyped at a subset of 16 SNPs or indels across the haplotype and SNP1. Most fish showed no evidence of recombination within the 16‐kb haplotype. (B) There is evidence of at least one historical recombination event within the haplotype in 198, or 22%, of the fish. The markers are depicted as triangles at their physical location relative to the haplotype and labeled at the bottom of the figure. Tick marks start at the beginning of intron 1 of Eda (the presumed start of the haplotype) and are spaced every 1000 bases. Genotypes are represented visually as CC (homozygous for the completely plated allele), CL (heterozygous), or LL (homozygous for the low‐plated, typically freshwater, allele), and extend halfway between each marker position. Missing genotypes are in white. The number of fish (n) and % of fish for each category of haplotype are listed on the right.
Figure 5
Figure 5
The NAKA SNP is not sufficient to cause variation in traits. (A) Schematic of crosses between heterozygous marine carriers of the NAKA SNP (CL genotype). Possible offspring genotypes are visualized below the parents, along with a triangle marking the NAKA SNP. The box contains the DNA sequence immediately surrounding the NAKA SNP. (B) Trait values for three phenotypes are plotted by offspring genotypes at the NAKA SNP. Representative genotypes are drawn above the plots. Mean trait value ± SD are depicted by black lines and whiskers. There is no association between genotype at the NAKA SNP and any of the three phenotypes—left plate count, dorsal‐ventral (D‐V) patterning of neuromasts or neuromasts per body segment along the posterior main trunk line (Mp). Adjusted trait values were calculated by adding the residual trait value for each individual to the predicted trait value when all the covariates are equal (sex, standard length, and family).
Figure 6
Figure 6
Association mapping of traits in Lake Washington stickleback reveals a similar pattern of association shared by three traits. The strength of association between each marker and each phenotype was calculated as a log odds likelihood (LOD) score compared with the model of no association between marker and phenotype. These LOD curves are plotted for four traits. Left plate count, dorsal‐ventral patterned segments, and Mp neuromasts per segment have significant LOD scores (LOD thresholds range from 2.7 to 2.9) and show very similar LOD curves, suggesting these traits are controlled by the same mutation(s). The LOD curve for gill raker length is shown, because this trait significantly mapped to the 3′ region (SNPs12‐13) of the haplotype in the Puget Sound crosses. However, as shown here, this trait does not significantly map to any marker within the haplotype in the Lake Washington population (LOD threshold = 2.6, dashed line).
Figure 7
Figure 7
SNPs12/13 explain additional variation in plate count and D‐V neuromast patterning of Lake Washington stickleback after accounting for Cnv770. Adjusted left plate count, D‐V neuromast pattern, and Mp neuromasts per segment are plotted for Lake Washington fish by both genotype at Cnv770 (the marker with the highest single LOD score in the association mapping) and SNPs12/13, which controlled additional variation in plate count in the Puget Sound crosses (Fig. 3C). Mean trait value ± SD are depicted by black lines and whiskers. Fish that are heterozygous at both Cnv770 and SNPs12/13 have significantly more plates than fish heterozygous at Cnv770 and homozygous LL at SNPs12/13 (t 12 = 4.4, P = 0.00085) and differ in D‐V neuromast patterning (t 12 = 2.7, P = 0.03). The trait values plotted are adjusted for sex, standard length, and collection, and therefore vary outside the normal range of values. There was a single fish with a historical recombination event on both chromosomes between Cnv770 and SNPs12/13, resulting in an LL genotype at Cnv770 and a CC genotype at SNPs12/13. Significance levels: * * * P < 0.001; * * P < 0.01; * P < 0.05; P > 0.05 (not significant).

Similar articles

Cited by

References

    1. Albert, A. Y. K. , Sawaya S., Vines T. H., Knecht A. K., Miller C. T., Summers B. R., et al. 2008. The genetics of adaptive shape shift in stickleback: pleiotropy and effect size. Evolution 62:76–85. - PubMed
    1. Albertson, R. C. , Streelman J. T., and Kocher T. D.. 2003. Directional selection has shaped the oral jaws of Lake Malawi cichlid fishes. Proc. Natl. Acad. Sci. USA 100:5252–5257. - PMC - PubMed
    1. Aman, A. J. , Fulbright A. N., and Parichy D. M.. 2018. Wnt/β‐catenin regulates an ancient signaling network during zebrafish scale development. eLife 7:e37001. - PMC - PubMed
    1. Barrett, R. D. H. , and Hoekstra H. E.. 2011. Molecular spandrels: tests of adaptation at the genetic level. Nat. Rev. Genet. 12:767–780. - PubMed
    1. Barrett, R. D. H. , Rogers S. M., and Schluter D.. 2008. Natural selection on a major armor gene in threespine stickleback. Science 322:255–257. - PubMed