. 2020 Jul 31;6(7):e04499.
doi: 10.1016/j.heliyon.2020.e04499. eCollection 2020 Jul.

Gamma radiation improves AD pathogenesis in APP/PS1 mouse model by potentiating insulin sensitivity

Affiliations

Gamma radiation improves AD pathogenesis in APP/PS1 mouse model by potentiating insulin sensitivity

Mayuri Khandelwal et al. Heliyon. .

Abstract

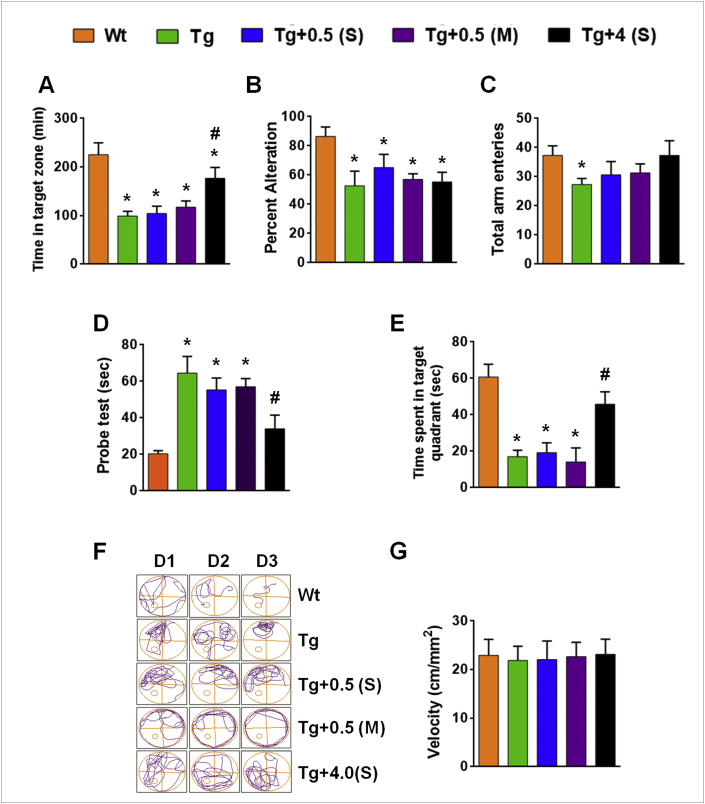
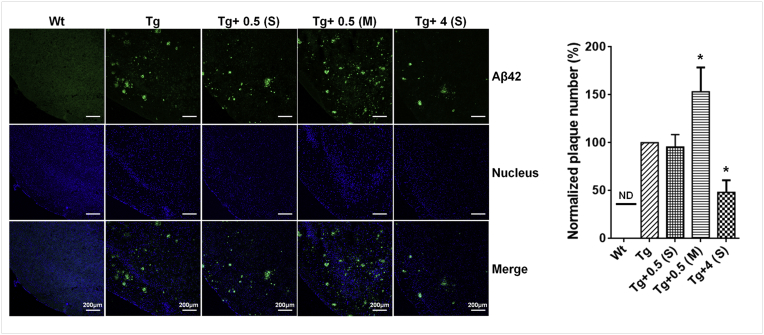
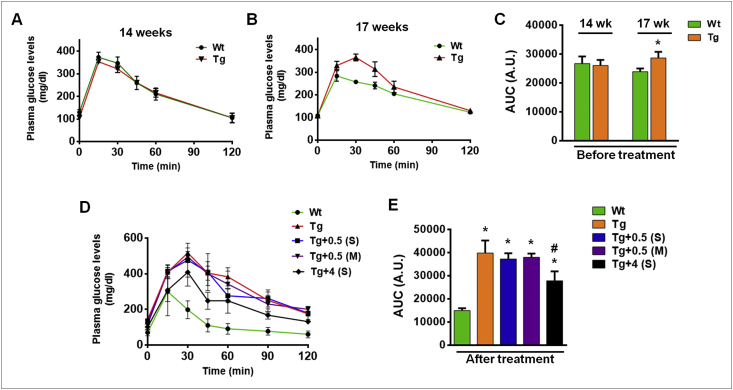
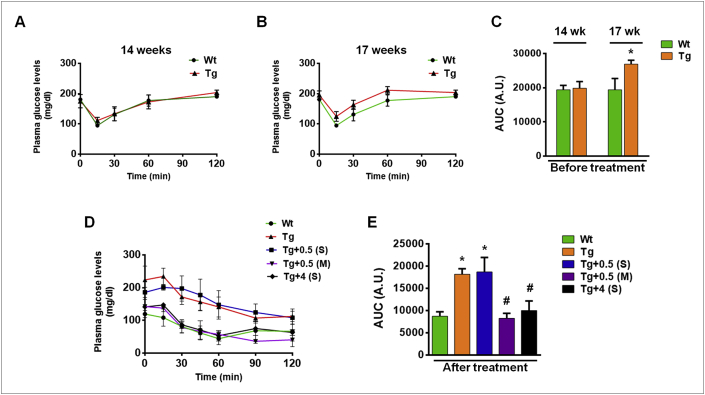
Alzheimer's disease (AD) is the largest unmet medical complication. The devastation caused by the disease can be assumed from the disease symptoms like speech impairment, loss of self-awareness, acute memory loss etc. The individuals suffering from AD completely depend on caregivers and have to bear the high cost of treatment which increases the socio-economic burden on the society. Recent studies have shown that radiation exposure can have therapeutic effects when given in suitable amount for a specific time period. Therefore, we investigated the role of gamma irradiation in AD pathogenesis. The effect of radiation on amelioration of disease progression was studied in AD transgenic mice model (APP/PS1). Our in-vivo studies using APP/PS1 mice demonstrated that a single dose of 4.0 Gy gamma irradiation improves AD associated behavioral impairment. Radiation exposure also increased the level of anti-oxidant enzymes and reduced the astrocyte activation in the brain of APP/PS1 mice. A significant reduction was observed in AD associated proteins (APP, pTau, BACE) and neurofibrillary tangle formations (NFTs). Exposure to a single dose of 4 Gy gamma radiation also increased glucose metabolic functionality in AD transgenic mouse model. The kinases involved in insulin signaling such as GSK, ERK and JNK were also found to be modulated. However, an increased level of GSK3β (ser 9) was observed, which could be responsible for downregulating ERK and JNK phosphorylation. This resulted in a decrease in neurofibrillary tangle formations and amyloid deposition. The reduced hyperphosphorylation of Tau can be attributed to the increased level of GSK3β (ser 9) downregulating ERK and JNK phosphorylation. Thus, a single dose of 4 Gy gamma irradiation was found to have therapeutic benefits in treating AD via potentiating insulin signaling in APP/PS1 transgenic mice.

Keywords: APP/PS1 mice; Alzheimer's disease; Biochemistry; Brain insulin resistance; Cognition; Gamma radiation; Molecular biology; Neurology; Neuroscience; Radiology.


Figures

Figure 1
Figure 1
Effect of single and multiple exposure of gamma irradiation on behavioral and cognitive function in APP/PS1 mice. Behavioral testing was performed using Y and water maze to study the memory exploratory and retention functionality. Y maze: (A) Time in target zone (min) (Wt; n = 10, Tg; n = 10 per group), (B) Percent Alternation (Wt; n = 10, Tg; n = 10 per group) and (C) Total arm entries (Wt; n = 10, Tg; n = 10 per group). Water maze (Wt; n = 10, Tg; n = 10 per group): (D) Probe test (sec) (Wt; n = 10, Tg; n = 10 per group), (E) Time spent in target quadrant (sec) (Wt; n = 10, Tg; n = 10 per group), (F) Diagrammatic representation of animals finding the platform (Wt; n = 10, Tg; n = 10 per group) and (G) velocity (cm/mm2) (Wt; n = 10, Tg; n = 10 per group). Different groups are indicated as Wt (Wild type), Tg (Untreated Transgenic), Tg+0.5 (S) (Transgenic mice received single dose of 0.5 Gy radiation), Tg+0.5 (M) (Transgenic mice received 0.5 Gy radiation twice a week for one month), Tg+4 (S) (Transgenic mice received single dose of 4 Gy radiation). Values are expressed as mean ± SEM. ∗p < 0.05 compared to wild type and #p < 0.05 compared to untreated APP/PS1 mice (Tg).
Figure 2
Figure 2
Effect of single and multiple exposure of gamma irradiation on amyloid burden. Brain was harvested at the end of experiment and embedded in paraffin. 10 μm sections were obtained on poly-L-lysine coated slides for immunohistochemical analysis. Aβ42 plaques were probed with specific primary antibody and visualized on confocal microscope using secondary Alexa Fluor 488 (green) and nucleus with DAPI (blue). Representative images and densitometry of normalized plaque number (%) are shown. Different groups are indicated as Wt (Wild type), Tg (Untreated Transgenic), Tg+0.5 (S) (Transgenic mice received single dose of 0.5 Gy radiation), Tg+0.5 (M) (Transgenic mice received 0.5 Gy radiation twice a week for one month), Tg+4 (S) (Transgenic mice received single dose of 4 Gy radiation). Values are expressed as mean ± SEM (Wt; n = 5, Tg; n = 5 per group). ∗p < 0.05 compared to untreated APP/PS1 mice (Tg).
Figure 3
Figure 3
Effect of single and multiple exposure of gamma irradiation on APP processing and astrocyte marker, GFAP. Representative western blot images and densitometric analysis of APP, BACE and GFAP normalized by β-actin. Different groups are indicated as Wt (Wild type), Tg (Untreated Transgenic), Tg+0.5 (S) (Transgenic mice received single dose of 0.5 Gy radiation), Tg+0.5 (M) (Transgenic mice received 0.5 Gy radiation twice a week for one month), Tg+4 (S) (Transgenic mice received single dose of 4 Gy radiation). Values are expressed as mean ± SEM (Wt; n = 5, Tg; n = 5 per group). ∗p < 0.05 compared to wild type and #p < 0.05 compared to untreated APP/PS1 mice (Tg).
Figure 4
Figure 4
Effect of single and multiple exposure of gamma irradiation on glucose metabolism by GTT in APP/PS1 mice. Body glucose of normal and irradiated mice was measured after 16 h of fasting with free availability of water ad libitium. Glucose was intra-peritoneally injected at the dose of 2 mg/g body weight. GTT (before radiation exposure) (Wt; n = 10, Tg; n = 50). (A) 14 weeks, (B) 17 weeks, (C) Area under curve (AUC), at 14 and 17 weeks. (D&E) GTT and Area under curve (AUC) after radiation exposure at 21 weeks (Wt; n = 10, Tg; n = 10 per group). Different groups are indicated as Wt (Wild type), Tg (Untreated Transgenic), Tg+0.5 (S) (Transgenic mice received single dose of 0.5 Gy radiation), Tg+0.5 (M) (Transgenic mice received 0.5 Gy radiation twice a week for one month), Tg+4 (S) (Transgenic mice received single dose of 4 Gy radiation). Values are expressed as mean ± SEM. ∗p < 0.05 compared to wild type and #p < 0.05 compared to untreated APP/PS1 mice (Tg).
Figure 5
Figure 5
Effect of single and multiple exposure of gamma irradiation on glucose metabolism by ITT in APP/PS1 mice. Body glucose of normal and irradiated mice was measured after 6–8 h of fasting with free availability of water ad libitium. Insulin was intra-peritoneally injected at the dose of 0.75 IU/kg body weight. ITT (before radiation exposure), (Wt; n = 10, Tg; n = 50) (A) 14 weeks, (B) 17 weeks, (C) Area under curve (AUC). (D & E) ITT and Area under curve (AUC) at 21 weeks after irradiation (Wt; n = 10, Tg; n = 10 per group). Different groups are indicated as Wt (Wild type), Tg (Untreated Transgenic), Tg+0.5 (S) (Transgenic mice received single dose of 0.5 Gy radiation), Tg+0.5 (M) (Transgenic mice received 0.5 Gy radiation twice a week for one month), Tg+4 (S) (Transgenic mice received single dose of 4 Gy radiation). Values are expressed as mean ± SEM. ∗p < 0.05 compared to wild type and #p < 0.05 compared to untreated APP/PS1 mice (Tg).
Figure 6
Figure 6
Effect of single and multiple exposure of gamma irradiation on insulin signaling molecules AKT and GSK3β. Brain homogenates from various experimental mice were studied to identify the phosphorylation status of key insulin signaling molecules. Representative western blots and densitometric analysis of (A) pAKT (ser 473) normalized by total AKT (Wt; n = 5, Tg; n = 5 per group) and (B) pGSK3β (ser 9) normalized by total GSK3β (Wt; n = 5, Tg; n = 5 per group). Different groups are indicated as Wt (Wild type), Tg (Untreated Transgenic), Tg+0.5 (S) (Transgenic mice received single dose of 0.5 Gy radiation), Tg+0.5 (M) (Transgenic mice received 0.5 Gy radiation twice a week for one month), Tg+4 (S) (Transgenic mice received single dose of 4 Gy radiation). Values are expressed as mean ± SEM. ∗p < 0.05 compared to wild type and #p < 0.05 compared to untreated APP/PS1 mice (Tg).
Figure 7
Figure 7
Effect of single and multiple exposure of gamma irradiation on phosphorylation of JNK, ERK and Tau proteins. Brain homogenates from various experimental mice were studied to identify the phosphorylation of stress related proteins such as JNK, ERK and Tau. Representative western blot and densitometric analysis of (A) pJNK normalized using total JNK (Wt; n = 5, Tg; n = 5 per group) (B) pERK normalized using total ERK (Wt; n = 5, Tg; n = 5 per group) and (C) pTau (ser 199) normalized using β-actin (Wt; n = 5, Tg; n = 5 per group). Different groups are indicated as Wt (Wild type), Tg (Untreated Transgenic), Tg+0.5 (S) (Transgenic mice received single dose of 0.5 Gy radiation), Tg+0.5 (M) (Transgenic mice received 0.5 Gy radiation twice a week for one month), Tg+4 (S) (Transgenic mice received single dose of 4 Gy radiation). Values are expressed as mean ± SEM. ∗p < 0.05 compared to wild type and #p < 0.05 compared to untreated APP/PS1 mice (Tg).
Figure 8
Figure 8
Effect of single and multiple exposure of gamma irradiation on the levels of anti-oxidative enzymes. Total mRNA was isolated from brain of experimental mice and gene expression of anti-oxidative enzymes studied. Relative mRNA expression (fold change) of (A) Catalase, (Wt; n = 5, Tg; n = 5 per group), (B) Superoxide Dismutase (SOD) (Wt; n = 5, Tg; n = 5 per group), (C) Glutathione peroxidase (GPX) (Wt; n = 5, Tg; n = 5 per group) and (D) Glutathione S transferase (GST) (Wt; n = 5, Tg; n = 5 per group). Different groups are indicated as Wt (Wild type), Tg (Untreated Transgenic), Tg+0.5 (S) (Transgenic mice received single dose of 0.5 Gy radiation), Tg+0.5 (M) (Transgenic mice received 0.5 Gy radiation twice a week for one month), Tg+4 (S) (Transgenic mice received single dose of 4 Gy radiation). Values are expressed as mean ± SEM. ∗p < 0.05 compared to wild type and #p < 0.05 compared to untreated APP/PS1 mice (Tg).
Figure 9
Figure 9
Effect of single and multiple exposure of gamma irradiation on astrocyte activation. Brain was harvested at the end of experiment and embedded in paraffin. 10 μm sections were obtained on poly-L-lysine coated slides for immunohistochemical analysis. GFAP was probed with specific primary antibody and visualized on confocal microscope using secondary Alexa Fluor 488 and nucleus with DAPI (blue). Representative GFAP images and densitometry of relative fluorescence intensity are shown (Wt; n = 5, Tg; n = 5 per group). Different groups are indicated as Wt (Wild type), Tg (Untreated Transgenic), Tg+0.5 (S) (Transgenic mice received single dose of 0.5 Gy radiation), Tg+0.5 (M) (Transgenic mice received 0.5 Gy radiation twice a week for one month), Tg+4 (S) (Transgenic mice received single dose of 4 Gy radiation). Values are expressed as mean ± SEM. ∗p < 0.05 compared to untreated APP/PS1 mice (Tg).

References

    1. Heron M. Deaths: leading causes for 2016. Natl. Vital Stat. Rep. 2018;67:1–77. - PubMed
    1. Hebert L.E., Weuve J., Scherr P.A., Evans D.A. Alzheimer disease in the United States (2010-2050) estimated using the 2010 census. Neurology. 2013;80:1778–1783. - PMC - PubMed
    1. Huber C.M., Yee C., May T., Dhanala A., Mitchell C.S. Cognitive decline in preclinical alzheimer's disease: amyloid-beta versus tauopathy. J. Alzheim. Dis. 2018;61:265–281. - PMC - PubMed
    1. Talbot K., Wang H.Y., Kazi H., Han L.Y., Bakshi K.P., Stucky A., Fuino R.L., Kawaguchi K.R., Samoyedny A.J., Wilson R.S., Arvanitakis Z., Schneider J.A., Wolf B.A., Bennett D.A., Trojanowski J.Q., Arnold S.E. Demonstrated brain insulin resistance in Alzheimer's disease patients is associated with IGF-1 resistance, IRS-1 dysregulation, and cognitive decline. J. Clin. Invest. 2012;122:1316–1338. - PMC - PubMed
    1. Hossain S., Akaike T., Chowdhury E.H. Current approaches for drug delivery to central nervous system. Curr. Drug Deliv. 2010;7:389–397. - PubMed