. 2020 Jul 25:9:147-156.
doi: 10.1016/j.ibror.2020.07.009. eCollection 2020 Dec.

The GluN3 subunit regulates ion selectivity within native N-methyl-d-aspartate receptors

Affiliations

The GluN3 subunit regulates ion selectivity within native N-methyl-d-aspartate receptors

Stephen Beesley et al. IBRO Rep. .

Abstract

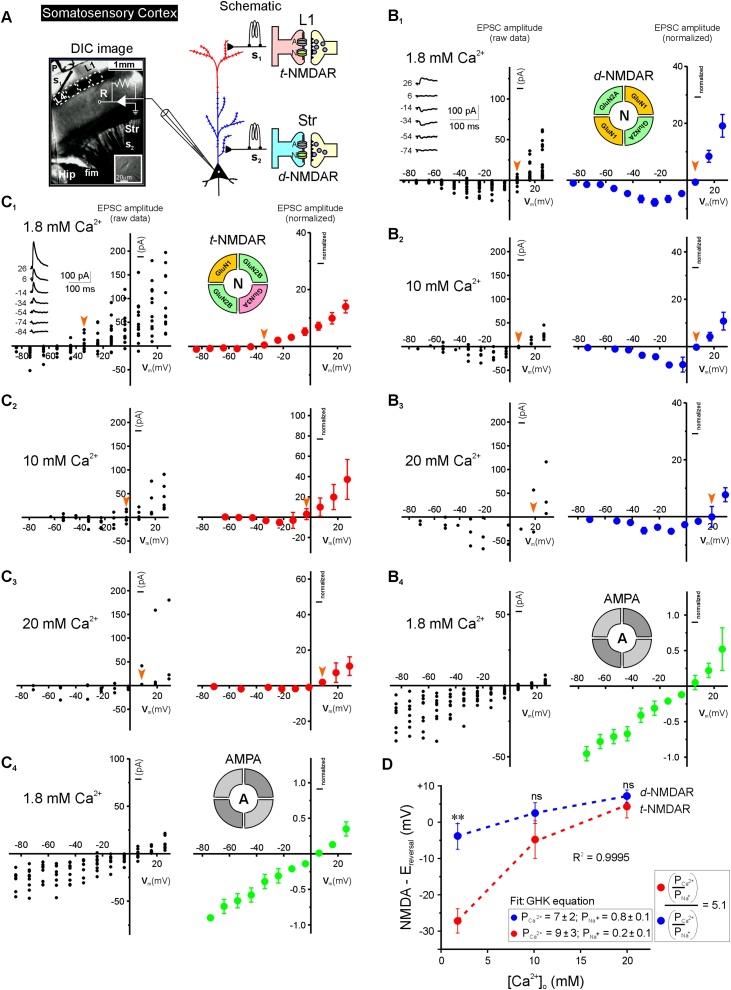
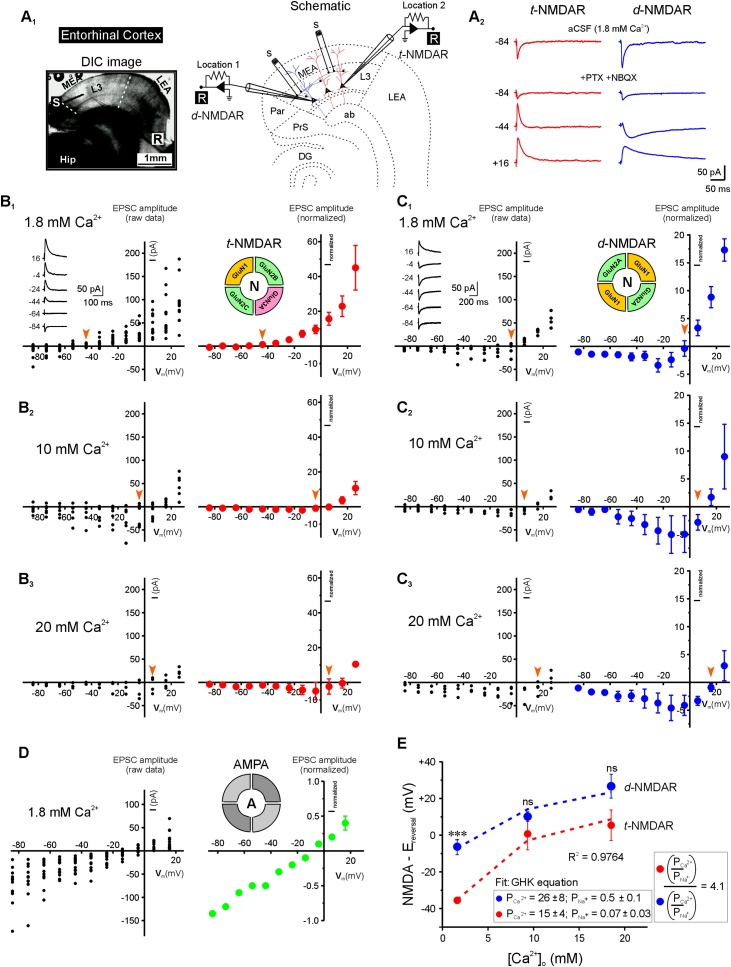
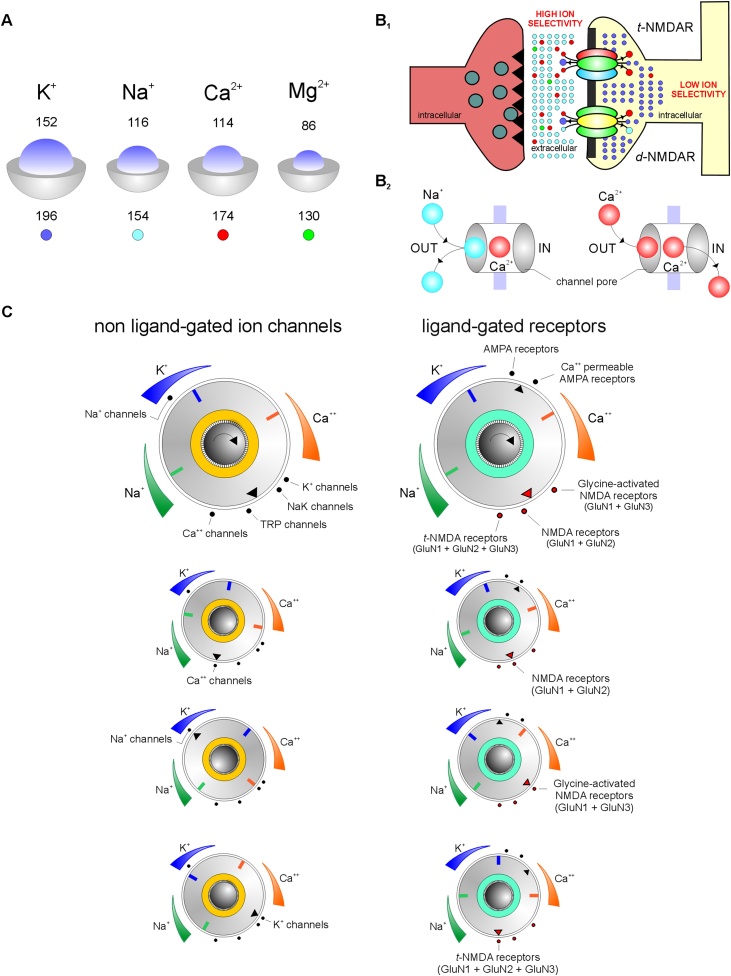
Glutamatergic N-methyl-d-aspartate receptors (NMDARs) are heterotetrameric proteins whose subunits are derived from three gene families, GRIN1 (codes for GluN1), GRIN2 (GluN2) and GRIN3 (GluN3). In addition to providing binding sites for glutamate and the co-agonist glycine, these subunits in their di (d-) and tri (t-) heteromeric configurations regulate various aspects of receptor function in the brain. For example, the decay kinetics of NMDAR-mediated synaptic currents depend on the type of GluN2 subunit (GluN2A-GluN2D) in the receptor subunit composition. While much is known about the contributions of GluN1 and GluN2 to d-NMDAR function, we know comparatively little about how GluN3 influences the function of t-NMDARs composed of one or more subunits from each of the three gene families. We report here that in addition to altering kinetics and voltage-dependent properties, the GluN3 subunit endows these receptors with ion selectivity wherein influx of Ca2+ is preferred over Na+. This became apparent in the process of assessing Ca2+ permeability through these receptors and is of significance given that NMDARs are generally believed to be nonselective to cations and increased selectivity can lead to enhanced permeability. This was true of two independent brain regions where t-NMDARs are expressed, the somatosensory cortex, where both receptor subtypes are expressed at separate inputs onto single neurons, and the entorhinal cortex, where they are co-expressed at individual synaptic inputs. Based on this data and the sequence of amino acids lining selectivity filters within these subunits, we propose GluN3 to be a regulatory subunit for ion selectivity in t-NMDARs.

Keywords: Electrophysiology; Entorhinal cortex; GluN3; Ion selectivity; Ion-substitution experiments; Somatosensory cortex; Triheteromeric NMDA receptors.


Figures

Fig. 1
Fig. 1
Assessment of Ca2+ permeability and selectivity in t- and d-NMDARs on pyramidal neurons (layer 5) of the somatosensory cortex using ion-substitution experiments. The data in this figure was obtained from an earlier study (Pilli and Kumar, 2012) and is being presented here for showcasing the differences and/or similarities between t-NMDAR properties between the somatosensory and entorhinal cortices. A: electrophysiological recording in a thalamocortical slice preparation (left, differential interference contrast image) and schematic (right) of the placement of stimulating (S1, S2 for layer 1/L1 and striatal/Str stimulation respectively), local perfusion (P) and recording (R) electrodes in relation to the barrels (demarcated regions in layer 4), striatum (Str), and hippocampus (Hip). B-C: current-voltage (I-V) relationships (raw data, left; normalized data, right) of the pharmacologically-isolated NMDA (N) and AMPA (A) receptor-mediated EPSCs evoked by concomitant alternate minimal-stimulation of Str (B1-B4) and L1 (C1-C4) inputs under (in mM) 1.8 (aCSF, B1, C1; B4, C4), 10 (B2, C2) and 20 (B3, C3) extracellular Ca2+ concentrations. Insets in B1 and C1 are representative sets of NMDAR-mediated EPSCs (averaged from ≥ 10 traces) at the indicated holding potentials (mV). A schematic of the putative subunit composition of the GluN2 subunit-containing di (d, blue) and GluN2 + GluN3 subunit-containing triheteromeric (t, red) NMDARs (insets) and their location at corresponding inputs shown color-coded along the dendrite. D, Averaged shifts in reversal potential (Erev in HEPES-buffered Ringer’s solution, red arrowheads) of NMDAR-mediated EPSCs (measured from individual I-Vs) as a function of extracellular Ca2+ concentration for the respective pathways. Relative permeability of Ca2+ and Na+ obtained from fits of data with the extended GHK constant-field equation (dashed lines; R, correlation coefficient) is shown in the boxed inset. Each point on the plots represents an ensemble average from a number of cells and error bars represent SEM, where this is greater than the size of the symbol. Statistical comparisons are between Erev for NMDARs in the two pathways. **P <  0.01; ns P > 0.05, t-test. (For interpretation of the references to colour in this figure legend, the reader is referred to the web version of this article).
Fig. 2
Fig. 2
Assessment of Ca2+ permeability and selectivity in NMDARs on pyramidal neurons (layer 3) of the medial entorhinal cortex (MEA) using ion-substitution experiments. Portions of the data in this figure were obtained from an earlier study (Beesley et al., 2019) and are being presented here for showcasing the differences and/or similarities between t-NMDAR properties between the somatosensory and entorhinal cortices. A1-A2: electrophysiological recording from neurons expressing GluN2 subunit-containing d-NMDARs (location 1) and GluN2 + GluN3 subunit-containing t-NMDARs (location 2) in a horizontal slice preparation (left) and schematic (right) of the placement of stimulating (S) and recording (R) electrodes at the two locations within MEA (demarcations shown separate the medial and lateral portions of the entorhinal area; A1). Traces (right panel) are averaged EPSCs recorded in the two neuron types under the indicated conditions shown here to illustrate directionality of currents and kinetic changes during the sequence of manipulations leading up to the holding potential of +16 mV (A2) B-D: current-voltage (I-V) relationships (raw data, left; normalized data, right) of the pharmacologically-isolated NMDA (N) and AMPA (A) receptor-mediated EPSCs evoked by minimal stimulation of local afferents at recording locations 2 (B1-B4) and 1 (C1-C4) under (in mM) 1.8 (aCSF, B1, C1; D), 10 (B2, C2) and 20 (B3, C3) extracellular Ca2+ concentrations. Insets in B1 and C1 are representative sets of NMDAR-mediated EPSCs (averaged from ≥ 10 traces) at the indicated holding potentials (mV). A schematic of the putative subunit composition of the di (d, blue) and triheteromeric (t, red) NMDARs (insets) is shown color-coded depending on their location within MEA. E, Averaged shifts in reversal potential (Erev in HEPES-buffered Ringer’s solution, red arrowheads) of NMDAR-mediated EPSCs (measured from individual I-Vs), as a function of extracellular Ca2+ concentration for two neuron types. Relative permeability of Ca2+ and Na+ obtained from fits of data with the extended GHK constant-field equation (dashed lines; R, correlation coefficient) is shown in the boxed inset. Each point on the plots represents an ensemble average from a number of cells and error bars represent SEM, where this is greater than the size of the symbol. Statistical comparisons are between Erev for NMDARs in the two locations. ***P <  0.0001; ns P > 0.05, t-test. (For interpretation of the references to colour in this figure legend, the reader is referred to the web version of this article).
Fig. 3
Fig. 3
Ion selectivity in di- and triheteromeric NMDARs is dependent on the combination of receptor subunits and ultimately on the sequence of amino acids that compose the selectivity filters in the pore-forming region of the receptor channels. A, NMDAR subunits with predicted transmembrane (TM) regions and TM2 sequence alignment of GluN1; GluN2A, 2B, 2C, 2D; GluN 3A, 3B from rat (RN, rattus norvegicus). Amino acid residues determining functional channel properties are indicated in bold and conserved residues determining ion selectivity in red. Numbers refer to amino acid positions within subunits. Abbreviations for the amino acid residues are: A, Ala; C, Cys; E, Glu; F, Phe; G, Gly; I, Ile; K, Lys; L, Leu; N, Asn; P, Pro; Q, Gln; R, Arg; S, Ser; T, Thr; V, Val; W, Trp; and Y, Tyr. B, Schematic arrangement of subunits and amino acid residues that constitute the putative selectivity filters in GluN3-containing/non-containing di- and triheteromeric NMDARs (left), and their selectivity (enhanced, green; diminished, red) for Na+ and/or Ca2+ ions (right). (For interpretation of the references to colour in this figure legend, the reader is referred to the web version of this article).
Fig. 4
Fig. 4
Factors affecting permeability and selectivity within receptor channels include among others, (A) the relative size of ions (blue, top number) / atoms (gray, bottom number), where numbers indicate radii in picometers; and (B) their distribution within the intracellular and extracellular compartments of the postsynaptic element in which selectivity of ions differs significantly. Inset schematic showing how selectivity for Ca2+ influences its permeability. Note that we do not know what the dwell time for Ca2+ is within the pore of receptor channel. Schema for cation selectivity within non-ligand gated ion channels (C, left panel) and ionotropic glutamate receptors (C, right panel) with related examples. The rotary knob (center) is marked with a channel-selector (▼) and three orthogonally-oriented indicators (red) for read out of K+, Na+ and Ca2+ selectivity in selected channels (•) arranged along the periphery of a selectivity dial. Cation selectivity levels are graded (high ↔ low) and color-coded (non-colored regions indicate non-selective and/or impermeance). Note that emergence of Ca2+/Na+ selectivity entails loss of K+ selectivity in both non-ligand gated ion channels and ligand-gated AMPA and NMDA receptors. However, lack of ion selectivity does not necessarily mean lack of ion permeability. (For interpretation of the references to colour in this figure legend, the reader is referred to the web version of this article).

References

    1. Ascher P., Nowak L. The role of divalent cations in the N-methyl-D-aspartate responses of mouse central neurones in culture. J. Physiol. 1988;399:247–266. - PMC - PubMed
    1. Beesley S., Sullenberger T., Pilli J., Abbasi S., Gunjan A., Kumar S.S. Colocalization of distinct NMDA receptor subtypes at excitatory synapses in the entorhinal cortex. J. Neurophysiol. 2019;121:238–254. - PMC - PubMed
    1. Benveniste M., Mayer M.L. Kinetic analysis of antagonist action at N-methyl-D-aspartic acid receptors. Two binding sites each for glutamate and glycine. Biophys. J. 1991;59:560–573. - PMC - PubMed
    1. Burnashev N., Monyer H., Seeburg P.H., Sakmann B. Divalent ion permeability of AMPA receptor channels is dominated by the edited form of a single subunit. Neuron. 1992;8:189–198. - PubMed
    1. Burnashev N., Schoepfer R., Monyer H., Ruppersberg J.P., Gunther W., Seeburg P.H., Sakmann B. Control by asparagine residues of calcium permeability and magnesium blockade in the NMDA receptor. Science. 1992;257:1415–1419. - PubMed

LinkOut - more resources