. 2020 Dec;21(6):773-786.
doi: 10.1007/s10522-020-09893-9. Epub 2020 Aug 10.

Multiparameter flow cytometric detection and quantification of senescent cells in vitro

Affiliations

Multiparameter flow cytometric detection and quantification of senescent cells in vitro

Adeolu Badi Adewoye et al. Biogerontology. 2020 Dec.

Abstract

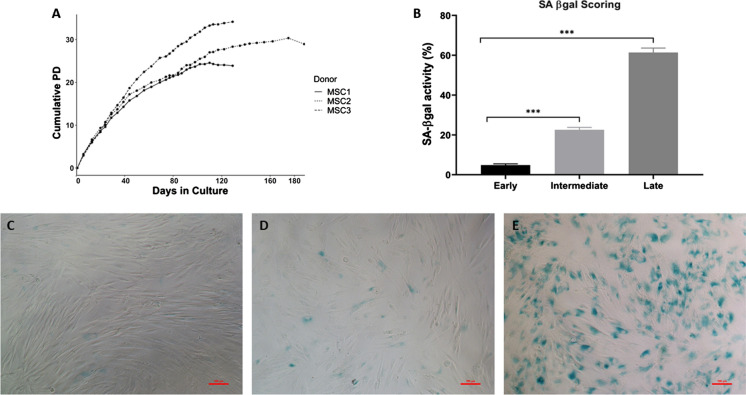
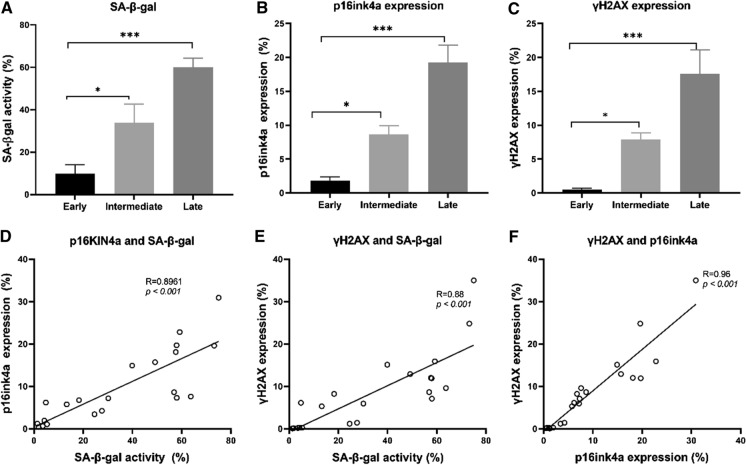
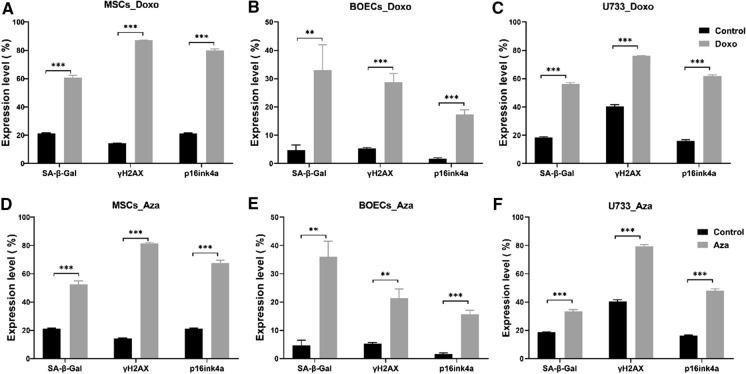
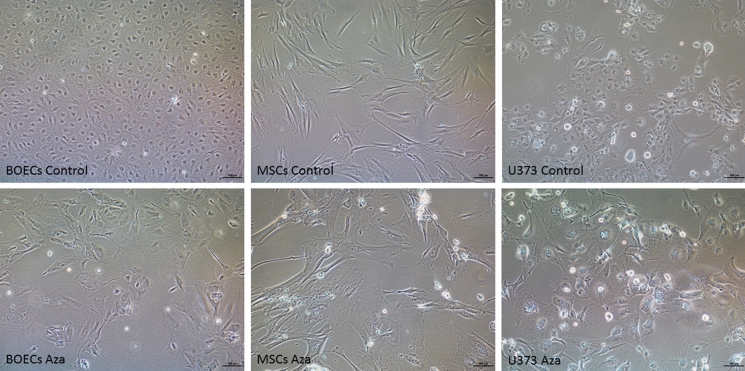
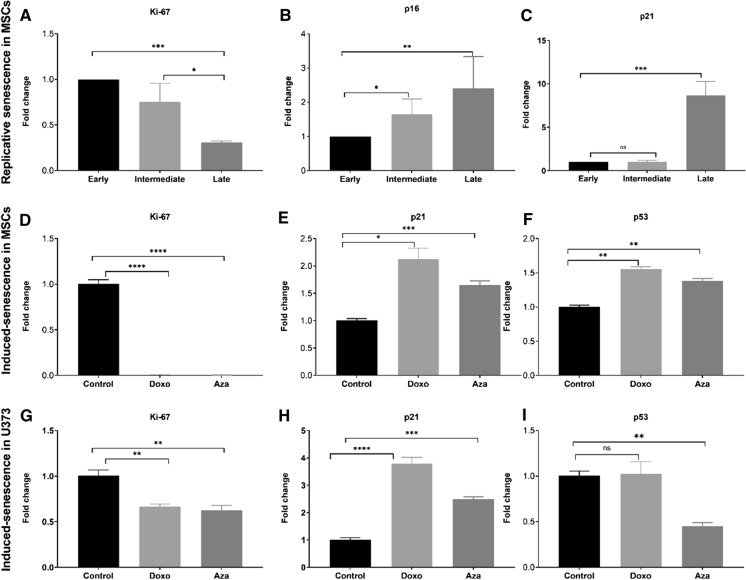
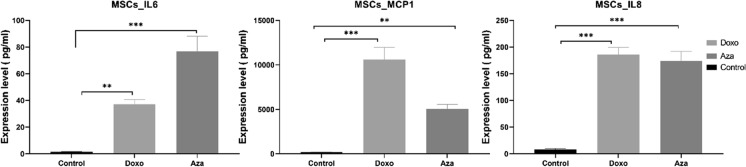
It has been over half a century since cellular senescence was first noted and characterized, and yet no consensus senescent marker has been reliably established. This challenge is compounded by the complexity and heterogenic phenotypes of senescent cells. This necessitates the use of multiple biomarkers to confidently characterise senescent cells. Despite cytochemical staining of senescence associated-beta-galactosidase being a single marker approach, as well as being time and labour-intensive, it remains the most popular detection method. We have developed an alternative flow cytometry-based method that simultaneously quantifies multiple senescence markers at a single-cell resolution. In this study, we applied this assay to the quantification of both replicative and induced senescent primary cells. Using this assay, we were able to quantify the activity level of SA β-galactosidase, the expression level of p16INK4a and γH2AX in these cell populations. Our results show this flow cytometric approach to be sensitive, robust, and consistent in discriminating senescent cells in different cell senescence models. A strong positive correlation between these commonly- used senescence markers was demonstrated. The method described in this paper can easily be scaled up to accommodate high-throughput screening of senescent cells in applications such as therapeutic cell preparation, and in therapy-induced senescence following cancer treatment.

Keywords: Aging; Flow cytometry; Mesenchymal stem cells; Quantification; Senescence.


Conflict of interest statement

There are no conflicts of interest.

Figures

Fig. 1
Fig. 1
Long-term cultured MSCs under standard condition. a The growth kinetics for donors (n = 03) showing cumulative population doublings in culture. b The quantification of SA-β-Gal activity in cytochemical stained cells. The percentage of SA-β-Gal positive cells as an indication of SA-β-gal activity was quantified in n = 08 images per condition. Data presented as standard error mean bar and asterisks denote statistical significance (***p < 0.001) by ANOVA test. Representative images of cytochemical SA-β-Gal staining (c) early (d) intermediate (e) and late passages at scale bar of 100 µm
Fig. 2
Fig. 2
Detection and quantification of senescent cells by flow cytometry method in replicative senescent cells. Long term cultured MSCs (n = 07) were screened for level of senescence at early, intermediate, and late passage by flow cytometry-based method and displayed as the percentage of cells expressing the marker in each population. a SA-β-Gal activity level, b p16INKA4a expression and c DNA damage response marker (γH2AX) expression. The results are presented as the mean ± s.e.m. of three independent experiments and asterisks denote statistical significance (*p < 0.05; ***p < 0.001) by independent t-test The correlation of positive cells expressing senescence-associated markers d p16 and SA-β-Gal markers r = 0.896, p < 0.001, e γH2AX and SA-β-Gal markers r = 0.88, p < 0.001, f γH2AX and p16 markers r = 0.96, p < 0.001 by Spearman correlation
Fig. 3
Fig. 3
Quantification of senescence level in Doxo and Aza treated cells by flow cytometry. Quantification of senescence level in Doxorubicin and Aza- 2 deoxycytidines-treated cells by flow cytometry and displayed as the percentage of cells expressing the marker in each population. The upper panel shows the expression levels of SA-β-Gal, γH2AX, and p16ink4a in MSCs (n = 03), BOECs (n = 04), and U373 (n = 03) cells treated with Doxo and their controls. The expression level of the three markers was significantly higher in the treated samples in comparison to non-treated samples. A similar result was seen in the Aza-treated sample (lower panel). The results are presented as the mean ± s.e.m. of three independent experiments. Asterisks denote statistical significance compared to early-stage (*p < 0.05; **p < 0.01; ***p < 0.001) from a t-test analysis
Fig. 4
Fig. 4
Morphological changes in 5′-Aza-2′-deoxycytidine treated cells. Cells were exposed to Aza for 48 h and imaged 5 days post-treatment. Scale bar = 100 µm
Fig. 5
Fig. 5
Quantification of senescence markers by RT-qPCR. Real-time qPCR was used to measure the expression levels of Ki-67 (a), p16 (b), and p21 (c) in replicative senescence. For the induced senescence in MSCs, the expression levels of Ki-67 (d), p16 (e) and p53 (f) were quantified. Similarly, the expression levels of Ki-67 (g), p16 (h) and p53 (i) were measured in U373. The results are presented as the mean ± s.e.m. of three independent experiments. Asterisks denote statistical significance compared to control—early stage for replicative senescence, and non-treated (control) for premature senescence (*p < 0.05; **p < 0.01; ***p < 0.001, ns = not significant) from a t-test analysis
Fig. 6
Fig. 6
Expression of the SASP cytokines IL6, MCP1 and IL8 in Doxo and Aza–induced senescence. The expression level of IL6, MCP1, and IL8 was significantly increased in both Aza and Doxo treated cells compared to the control (non-treated). The results are presented as the mean ± s.e.m. Asterisks denote statistical significance (*p < 0.05; **p < 0.01; ***p < 0.001) from ANOVA test n = 03 per condition and 3 replicates

References

    1. Ades F, Metzger-Filho O. Targeting the cellular signaling: BRAF inhibition and beyond for the treatment of metastatic malignant melanoma. Dermatol Res Pract. 2012;2012:9. - PMC - PubMed
    1. Althubiti M, Macip S. Detection of senescent cells by extracellular markers using a flow cytometry-based approach. Methods Mol Biol. 2017;1534:147. - PubMed
    1. Angello JC, Pendergrass WR, Norwood TH, Prothero J. Proliferative potential of human fibroblasts: an inverse dependence on cell size. J Cell Physiol. 1987;132(1):125–130. - PubMed
    1. Baker DJ, Childs BG, Durik M, Wijers ME, Sieben CJ, Zhong J, et al. Naturally occurring p16 Ink4a-positive cells shorten healthy lifespan. Nature. 2016;530(7589):184–189. - PMC - PubMed
    1. Bertolo A, Baur M, Guerrero J, Pötzel T, Stoyanov J. Autofluorescence is a reliable in vitro marker of cellular senescence in human mesenchymal stromal cells. Sci Rep. 2019;9(1):2074–2015. - PMC - PubMed

Publication types

LinkOut - more resources