. 2020 Aug;8(4):e00636.
doi: 10.1002/prp2.636.

Effects of RAGE inhibition on the progression of the disease in hSOD1G93A ALS mice

Affiliations

Effects of RAGE inhibition on the progression of the disease in hSOD1G93A ALS mice

Liping Liu et al. Pharmacol Res Perspect. 2020 Aug.

Abstract

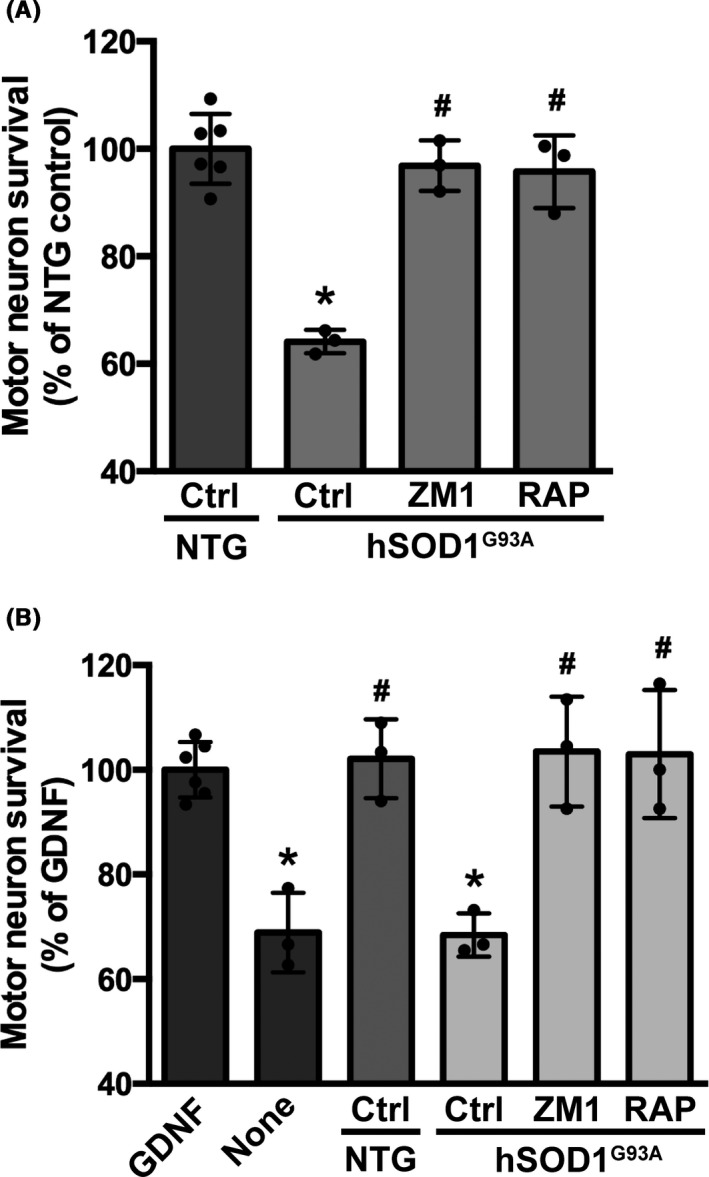
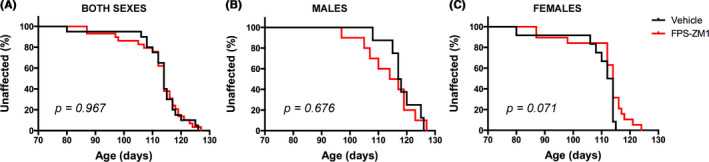
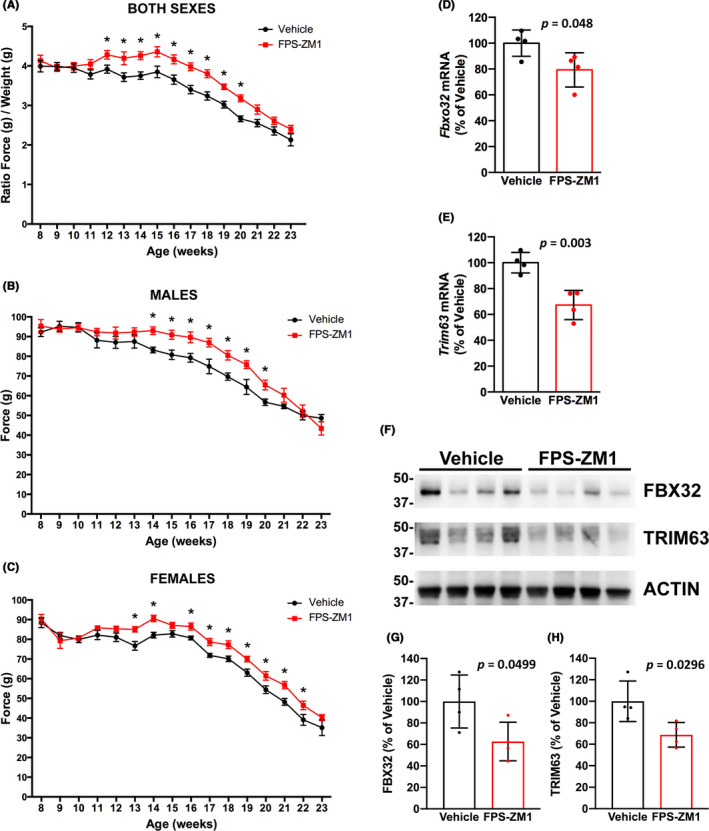
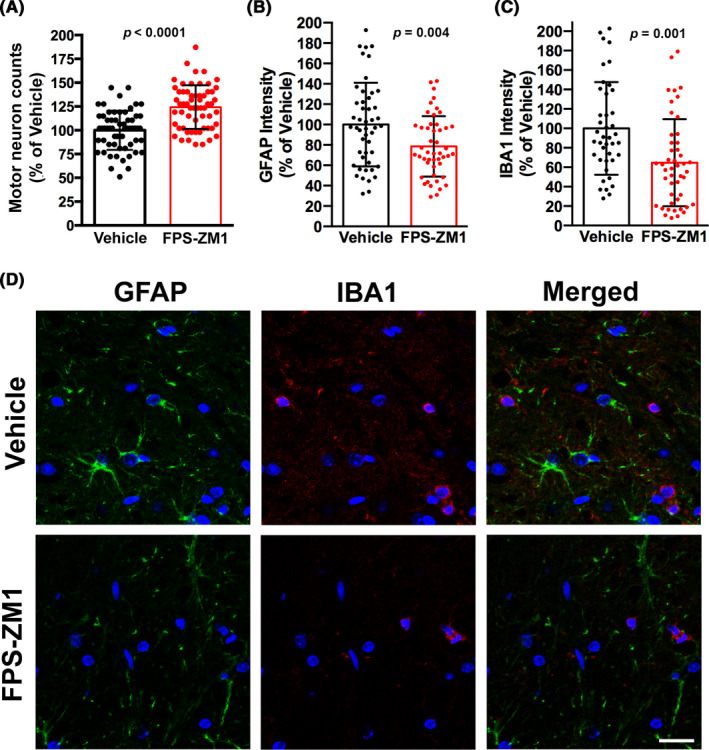
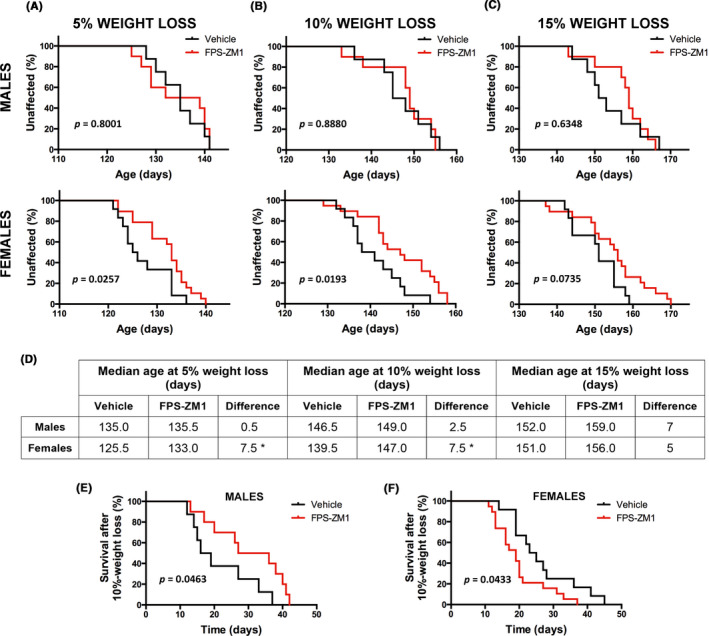
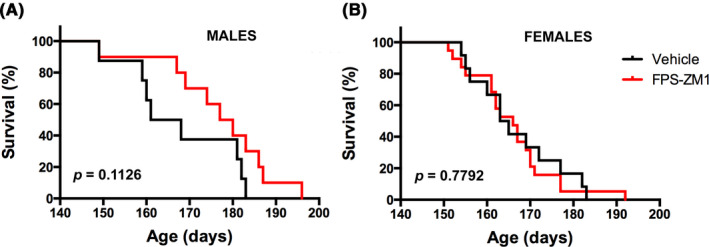
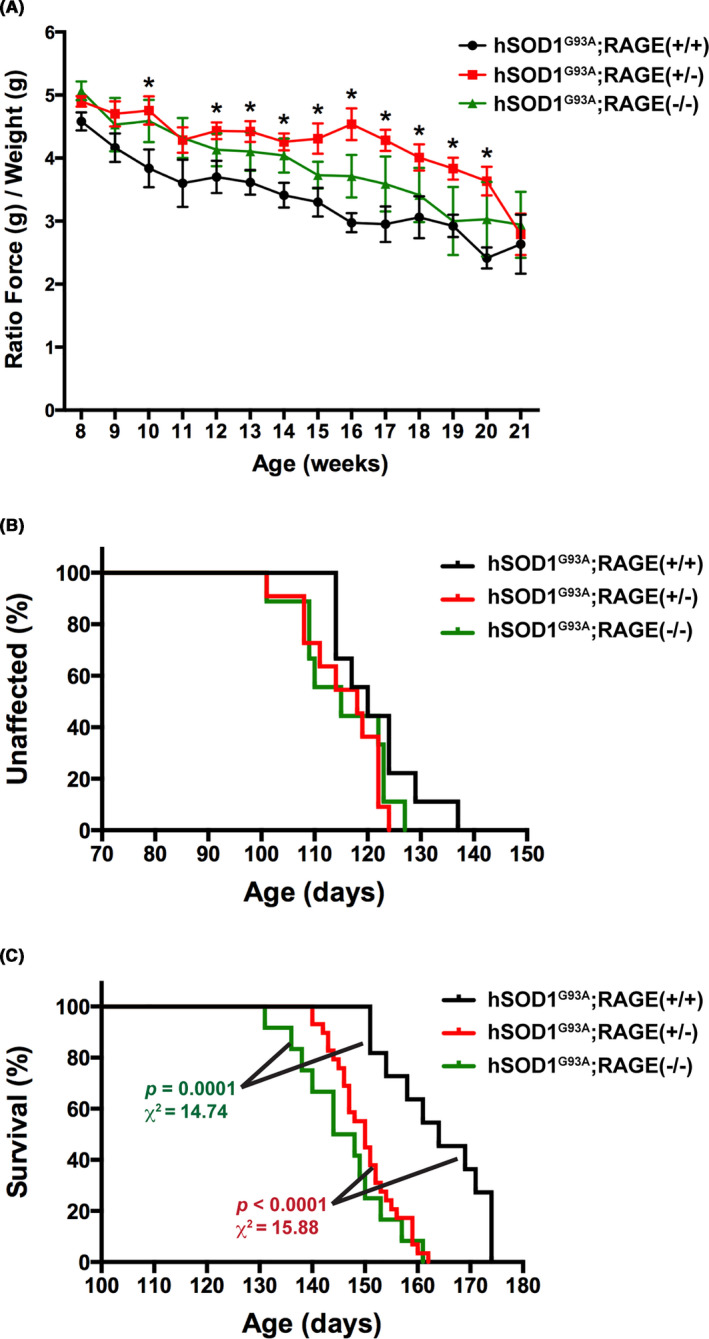
Astrocytes play a key role in the progression of amyotrophic lateral sclerosis (ALS) by actively inducing the degeneration of motor neurons. Motor neurons isolated from receptor for advanced glycation end products (RAGE)-knockout mice are resistant to the neurotoxic signal derived from ALS-astrocytes. Here, we confirmed that in a co-culture model, the neuronal death induced by astrocytes over-expressing the ALS-linked mutant hSOD1G93A is prevented by the addition of the RAGE inhibitors FPS-ZM1 or RAP. These inhibitors also prevented the motor neuron death induced by spinal cord extracts from symptomatic hSOD1G93A mice. To evaluate the relevance of this neurotoxic mechanism in ALS pathology, we assessed the therapeutic potential of FPS-ZM1 in hSOD1G93A mice. FPS-ZM1 treatment significantly improved hind-limb grip strength in hSOD1G93A mice during the progression of the disease, reduced the expression of atrophy markers in the gastrocnemius muscle, improved the survival of large motor neurons, and reduced gliosis in the ventral horn of the spinal cord. However, we did not observe a statistically significant effect of the drug in symptoms onset nor in the survival of hSOD1G93A mice. Maintenance of hind-limb grip strength was also observed in hSOD1G93A mice with RAGE haploinsufficiency [hSOD1G93A ;RAGE(+/-)], further supporting the beneficial effect of RAGE inhibition on muscle function. However, no benefits were observed after complete RAGE ablation. Moreover, genetic RAGE ablation significantly shortened the median survival of hSOD1G93A mice. These results indicate that the advance of new therapies targeting RAGE in ALS demands a better understanding of its physiological role in a cell type/tissue-specific context.

Keywords: Atrogin-1; MuRF1; advanced glycation end products receptor; amyotrophic lateral sclerosis; astrocytes; motor neurons.


Conflict of interest statement

The authors declare no competing interests.

Figures

FIGURE 1
FIGURE 1
RAGE pharmacological inhibition prevented motor neuron death induced by hSOD1G93A astrocytes and hSOD1G93A lumbar spinal cord extracts. A, Non‐transgenic embryonic motor neurons were plated on top of astrocytes isolated from non‐transgenic (NTG) or hSOD1G93A mice. Vehicle (Control, Ctrl) or RAGE inhibitors, FPS‐ZM1 (100 nmol/L; ZM1) and RAP (20 μmol/L), were added 2 h after motor neuron plating. Neuronal survival was determined 72 h later. Data are expressed as percentage of motor neuron survival on top of NTG control astrocytes (mean ± SD). *Significantly different from NTG control (P ≤ .05); #Significantly different from hSOD1G93A control (P ≤ .05). B, Primary motor neuron cultures isolated from the spinal cord of E12.5 hSOD1G93A embryos were maintained with GDNF (1 ng/mL). Two hours after plating, cultures were treated with vehicle (control GDNF) or spinal cord extracts (0.5 μg protein/mL) from early symptomatic hSOD1G93A mice or aged‐matched non‐transgenic littermates (NTG). Vehicle (Ctrl) or RAGE pharmacological inhibitors, FPS‐ZM1 (100 nmol/L; ZM1) and RAP (10 μmol/L), were added 30 min before treatment with spinal cord extracts and motor neuron survival was determined 48 h later. Motor neuron death induced by trophic factor deprivation (NONE) was used as a control. Data are expressed as percentage of control GDNF (mean ± SD). *Significantly different from control GDNF (P ≤ .05); #Significantly different from hSOD1G93A control (P ≤ .05). For all panels, experiments were performed in three independent cultures performed in duplicate and the average of each experiment is shown. Each experimental replica is shown for control groups
FIGURE 2
FIGURE 2
FPS‐ZM1 had no significant effect on the disease onset in hSOD1G93A mice. hSOD1G93A mice were treated with vehicle (black) or FPS‐ZM1 (1 mg/kg/d; red). Disease onset was retrospectively determined as the time when mice reached peak body weight. A, When both sexes were analyzed together, median onset was 114 d in both treatment groups (vehicle group n = 20 [12 females and 8 males], and FPS‐ZM1 group n = 29 [19 females and 10 males]). B, In males, median onset was 117.5 d in vehicle group (n = 8) and 115.5 d in FPS‐ZM1 group (n = 10). C, In females, median onset was 113 d in vehicle group (n = 12) and 114 d in FPS‐ZM1 group (n = 19). Onset curves were not significantly different
FIGURE 3
FIGURE 3
FPS‐ZM1 treatment preserved hind‐limb grip strength and decreased the expression of skeletal muscle atrophy markers in hSOD1G93A mice. A, Analysis of hind‐limb grip strength combining both sexes together (vehicle group n = 20 [12 females and 8 males], and FPS‐ZM1 group n = 29 [19 females and 10 males]). In order to combine both sexes together, data are presented as the ratio of hind‐limb grip strength to body weight (mean ± SEM). B, Analysis of hind‐limb grip strength in male mice (n = 8 in vehicle, n = 10 in FPS‐ZM1 group). C, Analysis of hind‐limb grip strength in female mice (n = 12 in vehicle, n = 19 in FPS‐ZM1 group). In (B and C), data are presented as mean ± SEM. *Significantly different from vehicle‐treated mice (P ≤ .05). For (A‐C), statistical significance was determined by multiple t tests assuming populations with the same standard deviation. D and E, FPS‐ZM1 treatment significantly decreased the expression of skeletal muscle atrophy markers (P ≤ .05). Total RNA was extracted from the gastrocnemius muscle of 17‐week‐old vehicle‐ or FPS‐ZM1‐treated mice and Fbxo32 (D) and Trim63 (E) mRNA levels were determined by real‐time PCR and corrected by Rplp0 mRNA levels (n = 4 mice per group). Data are expressed as percentage of vehicle‐treated mice (mean ± SD). F, Western blot analysis of FBX32 and TRIM63 protein levels in the gastrocnemius muscle of 17‐week‐old vehicle‐ or FPS‐ZM1‐treated mice. G and H, Quantification of FBX32 (G) and TRIM63 (H) protein expression after correction by ACTIN levels (n = 4 mice per group). Data are expressed as percentage of vehicle‐treated mice (mean ± SD)
FIGURE 4
FIGURE 4
FPS‐ZM1 treatment delayed motor neuron loss and decreased glial activation in the spinal cord of hSOD1G93A mice. A, Number of large motor neurons in the ventral horn of the lumbar spinal cord of 17‐week‐old vehicle‐ or FPS‐ZM1‐treated mice. Data are expressed as percentage of vehicle‐treated mice (mean ± SD). Each data point corresponds to the value obtained from individual sections (15 sections per animal, n = 4 mice per treatment group). When compared with vehicle‐treated mice, the number of large motor neurons in FPS‐ZM1‐treated mice was increased by 24.3% (P ≤ .0001). B and C, Quantification of relative GFAP (B) and IBA1 (C) fluorescence intensity in images from the ventral horn of the lumbar spinal cord of vehicle‐ or FPS‐ZM1‐treated hSOD1G93A mice. Data are expressed as percentage of vehicle‐treated mice (mean ± SD). Each data point corresponds to the value obtained in an individual image (10‐12 images per animal, n = 4 mice per treatment group). D, Representative microphotographs showing GFAP (green) and IBA1 (red) immunofluorescence in the ventral horn of the lumbar spinal cord of 17‐week‐old vehicle‐ or FPS‐ZM1‐treated mice. Nuclei were counterstained with DAPI. Scale bar, 20 μm
FIGURE 5
FIGURE 5
Sex‐specific effect of FPS‐ZM1‐treatment in the progressive weight loss observed in hSOD1G93A mice. Body weight was recorded daily and the age at which mice exhibited 5%, 10%, or 15% peak weight loss was determined (age at 95%, 90%, or 85% peak body weight, respectively). A‐C, Kaplan‐Meier curves showing the probability of losing 5% (A), 10% (B), or 15% (C) of the peak body weight. Both sexes were analyzed independently (top panel: males; lower panel: females; vehicle group n = 12 females and n = 8 males, and FPS‐ZM1 group n = 19 females and n = 10 males). A significant 7.5‐d delay in the median age at which female mice display 5% and 10% peak weight loss was observed in FPS‐ZM1 group. No significant effect of the treatment was observed in male mice. D, Table summarizing the median age at which mice display different percentages of weight loss. *Significant difference between vehicle and FPS‐ZM1 groups (P ≤ .05). E and F, Kaplan‐Meier curves representing the number of days elapsed from age at 10% peak weight loss until endpoint is reached. The median time elapsed until endpoint significantly increases in males (17.5 d in vehicle vs 31.5 d in FPS‐ZM1 group; χ 2 = 3.97) and decreases in females (24 d in vehicle vs 19 d in FPS‐ZM1 group; χ 2 = 4.09)
FIGURE 6
FIGURE 6
FPS‐ZM1 treatment has no statistically significant effect on the survival of hSOD1G93A mice. A, Median survival in male mice treated with vehicle (164.5 d, n = 8) or FPS‐ZM1 (178.5 d, n  = 10). Curves are not significantly different. B, Median survival in female mice treated with vehicle (164 d, n  =  12) or FPS‐ZM1 (166 d, n = 19). Curves are not significantly different
FIGURE 7
FIGURE 7
RAGE haploinsufficiency preserves hind‐limb grip strength but decreases the lifespan of hSOD1G93A mice. A, Analysis of hind‐limb grip strength combining both sexes together (hSOD1G93A;RAGE(+/+) group, black, n = 9 [6 females and 3 males], hSOD1G93A;RAGE(+/‐) group, red, n = 11 [7 females and 4 males], and hSOD1G93A;RAGE(−/−) group, green, n = 9 [4 females and 5 males]). Data are presented as the ratio of hind‐limb grip strength to body weight (mean ± SEM). *Significantly different from hSOD1G93A;RAGE(+/+) mice (P ≤ .05). Statistical significance was determined by multiple t tests assuming populations with the same standard deviation. B, No significant effect in the onset of the disease was observed after partial or complete genetic RAGE ablation. The onset of the disease was retrospectively determined as the time when mice reached peak body weight. The median onset was 120 d in hSOD1G93A;RAGE(+/+) mice (black), 118 d in hSOD1G93A;RAGE(+/‐) mice (red), and 115 d in hSOD1G93A;RAGE(−/−) mice (green). The number and sex of the animals are the same as in (A). C, A significant decrease in the median survival of hSOD1G93A mice was observed after genetic RAGE ablation. The median survival was 164 d in hSOD1G93A;RAGE(+/+) mice (black, n = 11 [7 females and 4 males]), 150 d in hSOD1G93A;RAGE(+/‐) mice (red, n = 29 [13 females and 16 males]), and 146 d in hSOD1G93A;RAGE(−/−) mice (green, n = 12 [6 females and 6 males]). No statistical difference was observed when comparing hSOD1G93A;RAGE(+/‐) versus hSOD1G93A;RAGE(−/−) mice

Similar articles

Cited by

References

    1. Brown RH, Al‐Chalabi A. Amyotrophic lateral sclerosis. N Engl J Med. 2017;377(2):162‐172. - PubMed
    1. Hardiman O, Al‐Chalabi A, Chio A, et al. Amyotrophic lateral sclerosis. Nat Rev Dis Primers. 2017;3:17071. - PubMed
    1. Taylor JP, Brown RH Jr, Cleveland DW. Decoding ALS: from genes to mechanism. Nature. 2016;539(7628):197‐206. - PMC - PubMed
    1. Vinsant S, Mansfield C, Jimenez‐Moreno R, et al. Characterization of early pathogenesis in the SOD1(G93A) mouse model of ALS: part I, background and methods. Brain Behav. 2013;3(4):335‐350. - PMC - PubMed
    1. Vinsant S, Mansfield C, Jimenez‐Moreno R, et al. Characterization of early pathogenesis in the SOD1(G93A) mouse model of ALS: part II, results and discussion. Brain Behav. 2013;3(4):431‐457. - PMC - PubMed

Publication types

Substances