

Modelling geospatial distributions of the triatomine vectors of Trypanosoma cruzi in Latin America
- PMID: 32776929
- PMCID: PMC7440660
- DOI: 10.1371/journal.pntd.0008411
Modelling geospatial distributions of the triatomine vectors of Trypanosoma cruzi in Latin America
Abstract
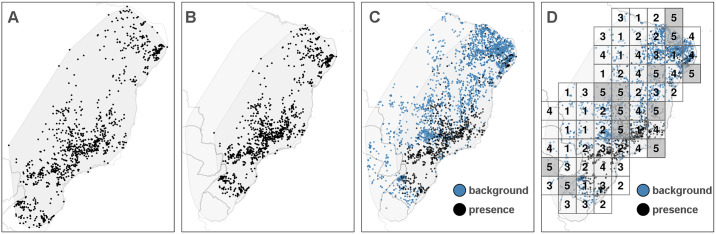
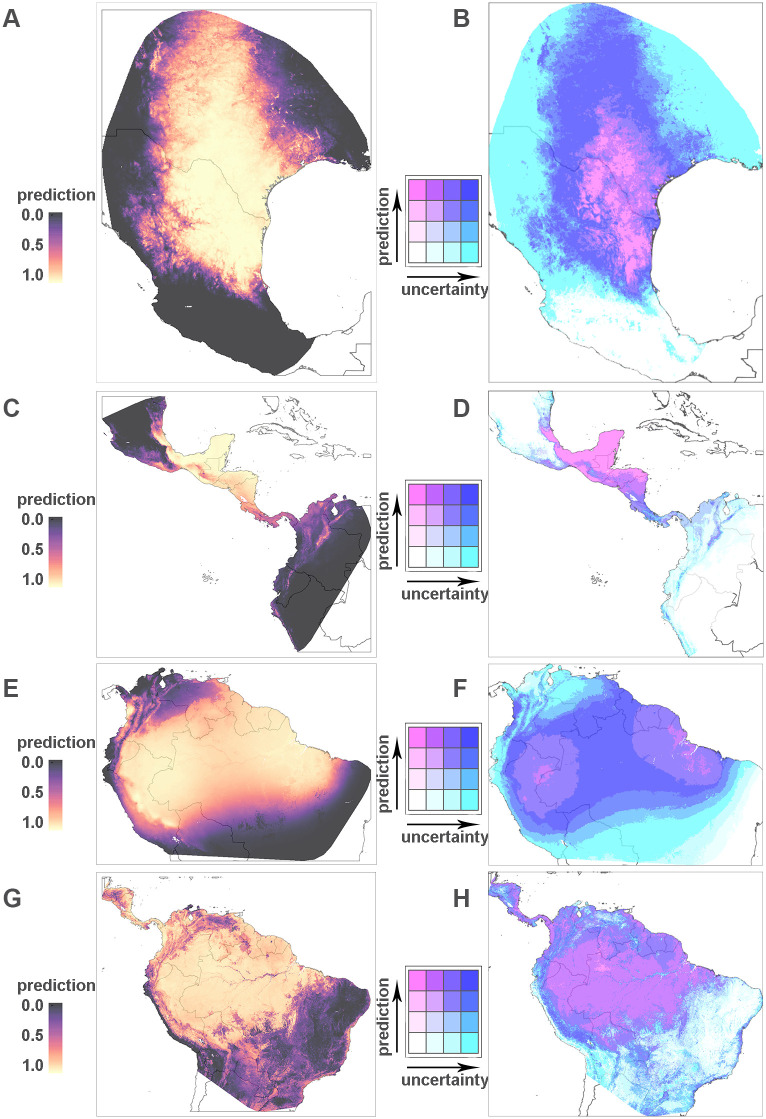
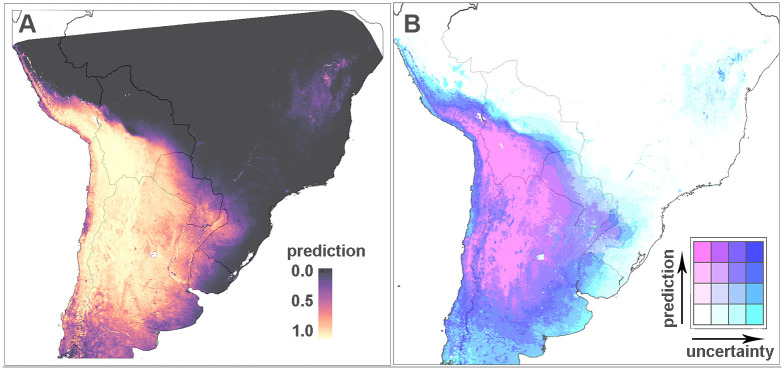
Approximately 150 triatomine species are suspected to be infected with the Chagas parasite, Trypanosoma cruzi, but they differ in the risk they pose to human populations. The largest risk comes from species that have a domestic life cycle and these species have been targeted by indoor residual spraying campaigns, which have been successful in many locations. It is now important to consider residual transmission that may be linked to persistent populations of dominant vectors, or to secondary or minor vectors. The aim of this project was to define the geographical distributions of the community of triatomine species across the Chagas endemic region. Presence-only data with over 12, 000 observations of triatomine vectors were extracted from a public database and target-group background data were generated to account for sampling bias in the presence data. Geostatistical regression was then applied to estimate species distributions and fine-scale distribution maps were generated for thirty triatomine vector species including those found within one or two countries and species that are more widely distributed from northern Argentina to Guatemala, Bolivia to southern Mexico, and Mexico to the southern United States of America. The results for Rhodnius pictipes, Panstrongylus geniculatus, Triatoma dimidiata, Triatoma gerstaeckeri, and Triatoma infestans are presented in detail, including model predictions and uncertainty in these predictions, and the model validation results for each of the 30 species are presented in full. The predictive maps for all species are made publicly available so that they can be used to assess the communities of vectors present within different regions of the endemic zone. The maps are presented alongside key indicators for the capacity of each species to transmit T. cruzi to humans. These indicators include infection prevalence, evidence for human blood meals, and colonisation or invasion of homes. A summary of the published evidence for these indicators shows that the majority of the 30 species mapped by this study have the potential to transmit T. cruzi to humans.
Conflict of interest statement
The authors have declared that no competing interests exist.
Figures
References
-
- London Declaration on Neglected Tropical Diseases. 5 Feb 2019; 2012.
-
- Pan American Health Organization. Strategy and plan of action for Chagas disease prevention, control and care; 2010.
-
- World Health Organization. Chagas disease in Latin America: an epidemiological update based on 2010 estimates. Weekly Epidemiological Record. 2015;90:33–44. - PubMed
-
- Guhl F. Geographical distribution of Chagas Disease. In: Telleria J, Tibayrenc M, editors. American Trypanosomiasis Chagas Disease: One Hundred Years of Research; 2017. p. 89–106.
Publication types
MeSH terms
Associated data
Grants and funding
LinkOut - more resources
Full Text Sources
