. 2020 Aug 10;15(8):e0237105.
doi: 10.1371/journal.pone.0237105. eCollection 2020.

Assessing geographic controls of hair isotopic variability in human populations: A case-study in Canada

Affiliations

Assessing geographic controls of hair isotopic variability in human populations: A case-study in Canada

Clement P Bataille et al. PLoS One. .

Abstract

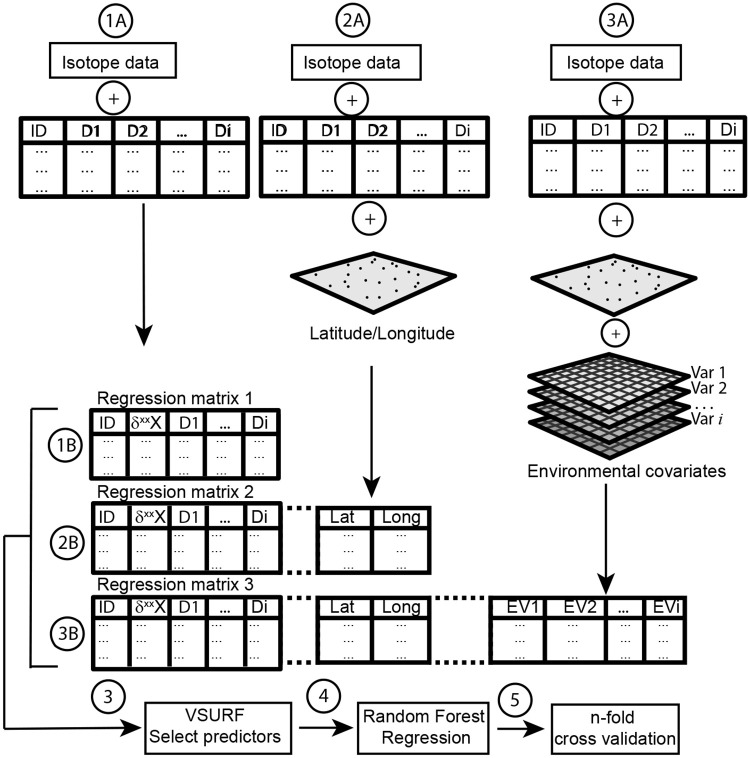
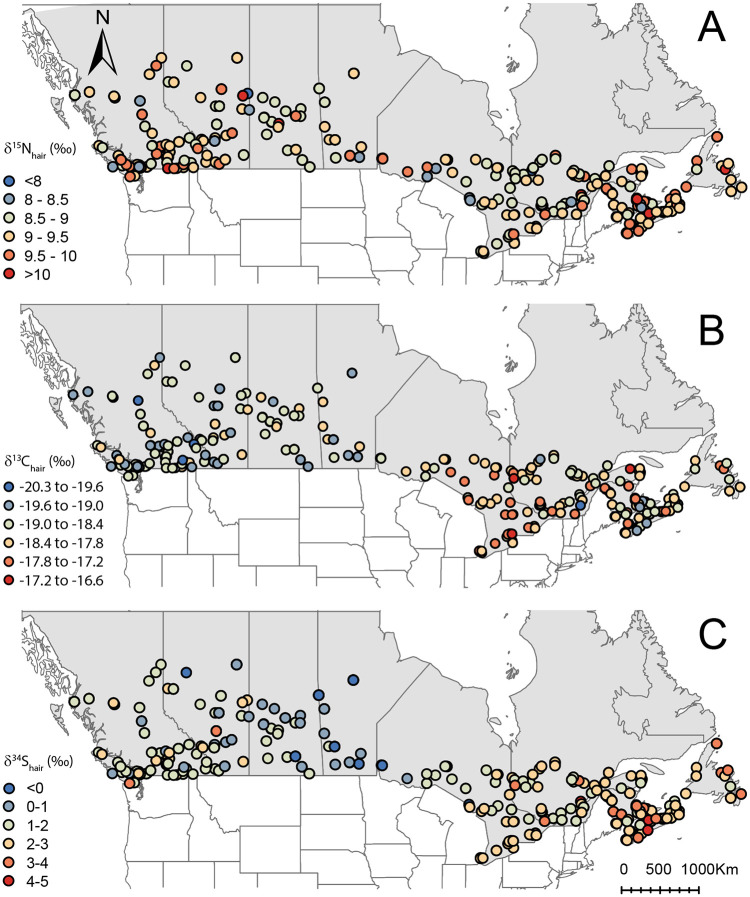
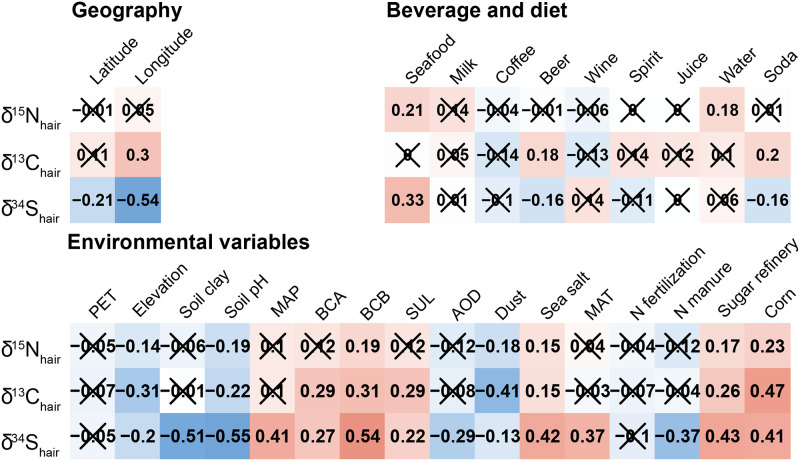
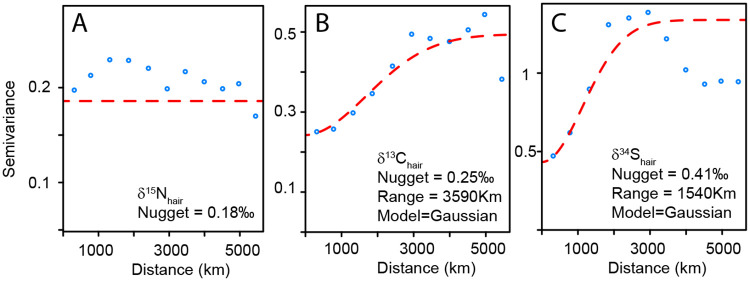
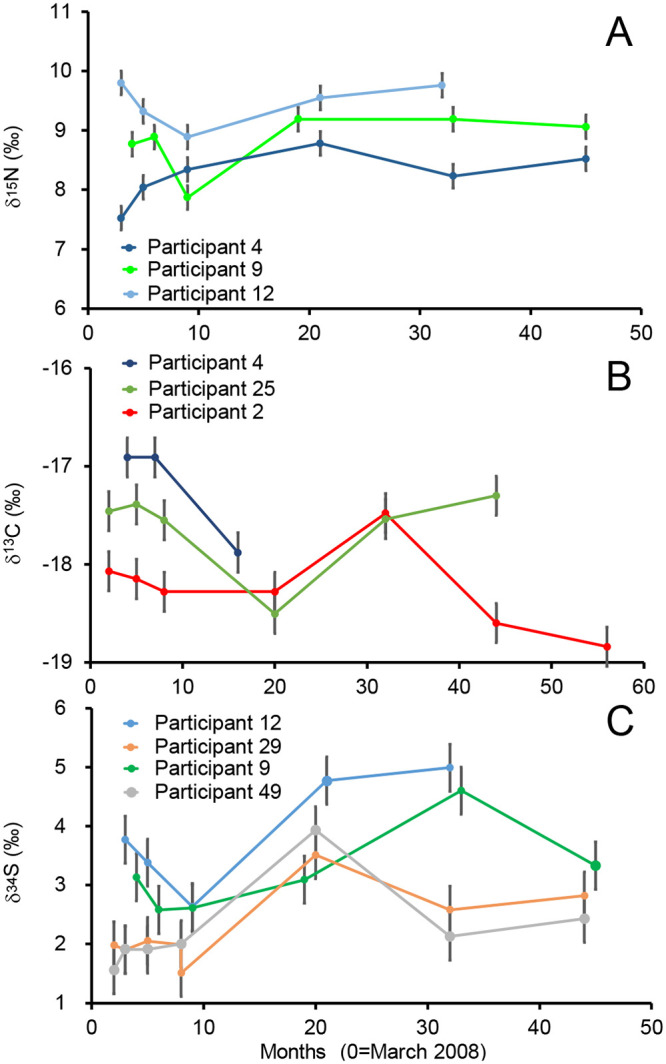
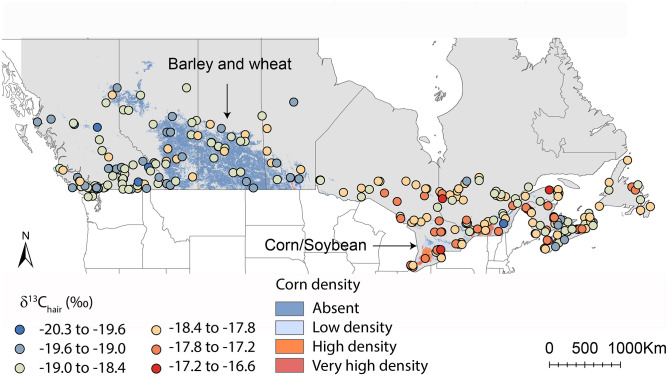
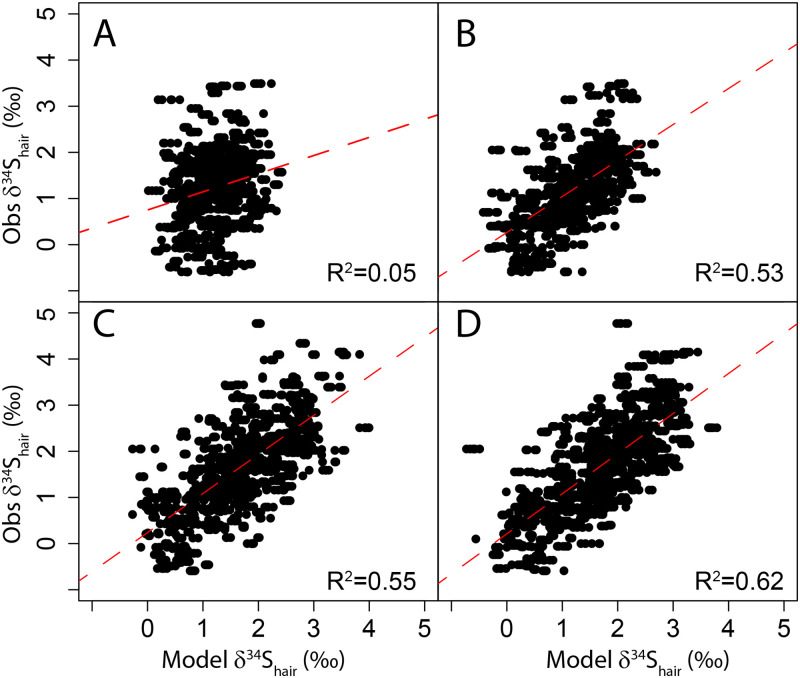
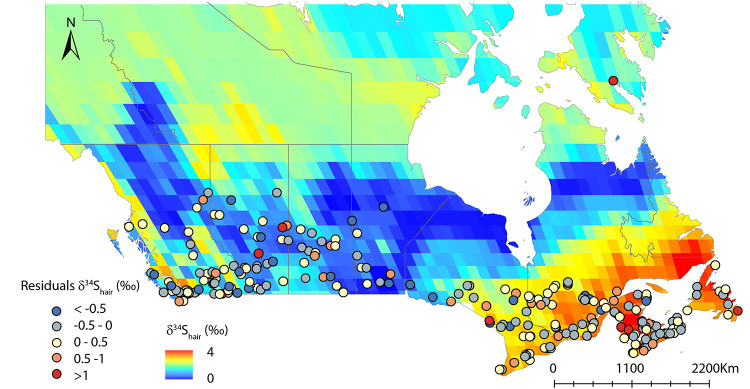
Studying the isotope variability in fast-growing human tissues (e.g., hair, nails) is a powerful tool to investigate human nutrition. However, interpreting the controls of this isotopic variability at the population scale is often challenging as multiple factors can superimpose on the isotopic signals of a current population. Here, we analyse carbon, nitrogen, and sulphur isotopes in hair from 590 Canadian resident volunteers along with demographics, dietary and geographic information about each participant. We use a series of machine-learning regressions to demonstrate that the isotopic values in Canadian residents' hair are not only influenced by dietary choices but by geographic controls. First, we show that isotopic values in Canadian residents' hair have a limited range of variability consistent with the homogenization of Canadian dietary habits (as in other industrialized countries). As expected, some of the isotopic variability within the population correlates with recorded individual dietary choices. More interestingly, some regional spatial patterns emerge from carbon and sulphur isotope variations. The high carbon isotope composition of the hair of eastern Canadians relative to that of western Canadians correlates with the dominance of corn in the eastern Canadian food-industry. The gradient of sulphur isotope composition in Canadian hair from coast to inland regions correlates with the increasing soil pH and decreasing deposition of marine-derived sulphate aerosols in local food systems. We conclude that part of the isotopic variability found in the hair of Canadian residents reflects the isotopic signature associated with specific environmental conditions and agricultural practices of regional food systems transmitted to humans through the high consumption rate of intra-provincial food in Canada. Our study also underscores the strong potential of sulphur isotopes as tracers of human and food provenance.


Conflict of interest statement

The authors have declared that no competing interests exist.

Figures

Fig 1
Fig 1. Multiple machine-learning regression workflow (see Materials and methods).
Regression 1 includes only isotope data, dietary choices, demographic variables (S1 Table); regression 2 includes isotope data, dietary choices, demographic variables, and latitude/longitude; and regression 3 includes isotope data, dietary choices, demographic variables, and environmental covariates (Table 1).
Fig 2
Fig 2. Distribution of sample locations and isotopic values in hair across Canada.
A. Nitrogen isotope variations (n = 577). B. Carbon isotope variations (n = 577). C. Sulphur isotope variations (n = 549). Administrative boundaries are from http://www.naturalearthdata.com/. This map was generated in Rx64 3 4.2 (https://www.r-project.org/).
Fig 3
Fig 3. Pearson correlation coefficient between isotopic data in hair and the continuous dietary choice, geographic and environmental variables.
Red and blue squares indicate significant positive or negative correlation (p-value<0.01) whereas crosses indicate no significant correlation (p-value>0.01).
Fig 4
Fig 4. Semivariograms.
A. δ15Nhair variations; B. δ13Chair variations; C. δ34Shair variations. The x-axis distance represents the distance between pairs of observations. The blue points represents the average value of semivariance between point pairs for each 500km distance bin. The red lines represent theoretical semivariograms. Note the nugget value is approximately equal to the analytical precision of 0.2‰, 0.2‰, and 0.4‰ for δ15Nhair, δ13Chair, and δ34Shair values, respectively.
Fig 5
Fig 5. Isotopic profiles for participants with the most variable isotopic values (Table 7) for A. δ15Nhair values; B. δ13Chair values and C. δ34Shair values.
Fig 6
Fig 6. Distribution of carbon isotope variations in hair of donors and density of corn production across Canada.
Color scale represents the spatial density of corn crops on agricultural land relative to other C3 crops for the year 2011 (http://open.canada.ca/data). This map contains information licensed under the Open Government Licence–Canada. Administrative boundaries are from http://www.naturalearthdata.com/. This map was generated in Rx64 3 4.2 (https://www.r-project.org/).
Fig 7
Fig 7. Observed δ34Shair against modeled δ34Shair.
A. Dietary and demographic data regression model including seafood, wine, and water consumption; B. Dietary, demographic and geographic data regression model including longitude, seafood, wine, and water consumption; C. Environmental variables data regression model including sea salt aerosol deposition and soil pH; D. Dietary, demographic, geographic and environmental variable regression model including sea salt aerosol, soil pH, precipitation and seafood consumption. The red dashed line is the best fit linear model.
Fig 8
Fig 8. Predicted spatial δ34Shair variability using rainfall, salt aerosol, and soil pH as predictors (resampled at 10,000km2).
Colored points represent the associated residuals (modeled δ34Shairvalues–observed δ34Shair values). Administrative boundaries are from http://www.naturalearthdata.com/. This map was generated in Rx64 3 4.2 (https://www.r-project.org/).

References

    1. Jahren AH, Saudek C, Yeung EH, Kao WHL, Kraft RA, Caballero B. An isotopic method for quantifying sweeteners derived from corn and sugar cane. Am J Clin Nutr. 2006;84: 1380–1384. 10.1093/ajcn/84.6.1380 - DOI - PubMed
    1. Brooks JR, Buchmann N, Phillips S, Ehleringer B, Evans RD, Lott M, et al. Heavy and light beer: A carbon isotope approach to detect C4 carbon in beers of different origins, styles, and prices. J Agric Food Chem. 2002;50: 6413–6418. 10.1021/jf020594k - DOI - PubMed
    1. O’Brien DM. Stable Isotope Ratios as Biomarkers of Diet for Health Research. Annu Rev Nutr. 2015;35: 565–594. 10.1146/annurev-nutr-071714-034511 - DOI - PMC - PubMed
    1. Schwertl M, Auerswald K, Schnyder H. Reconstruction of the isotopic history of animal diets by hair segmental analysis. Rapid Commun Mass Spectrom. 2003;17: 1312–1318. 10.1002/rcm.1042 - DOI - PubMed
    1. Huelsemann F, Flenker U, Koehler K, Schaenzer W. Effect of a controlled dietary change on carbon and nitrogen stable isotope ratios of human hair. Rapid Communications in Mass Spectrometry. 2009. pp. 2448–2454. 10.1002/rcm.4039 - DOI - PubMed

Publication types