. 2020 Nov;20(11):3162-3172.
doi: 10.1111/ajt.16251. Epub 2020 Sep 12.

In-depth virological assessment of kidney transplant recipients with COVID-19

Affiliations

In-depth virological assessment of kidney transplant recipients with COVID-19

Ilies Benotmane et al. Am J Transplant. 2020 Nov.

Abstract

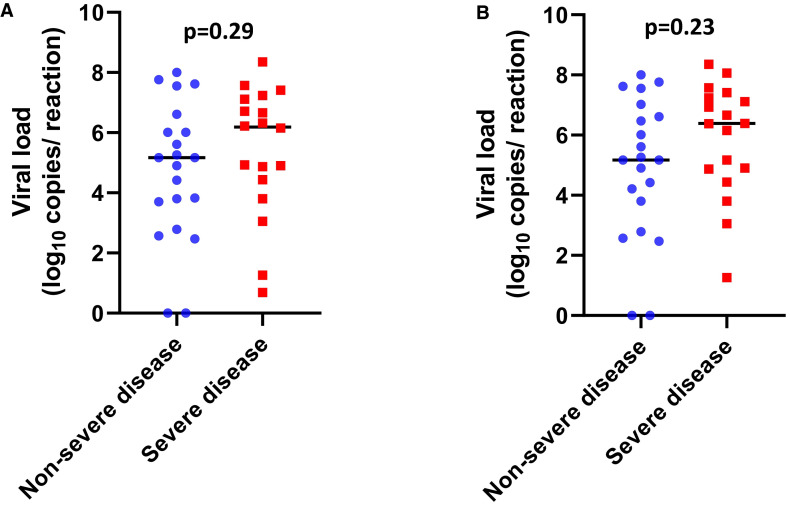
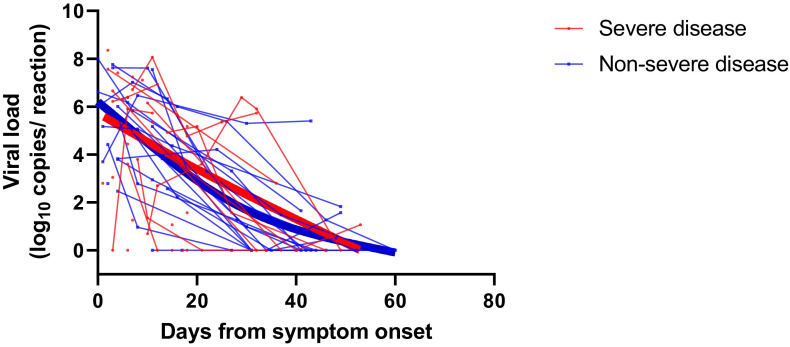
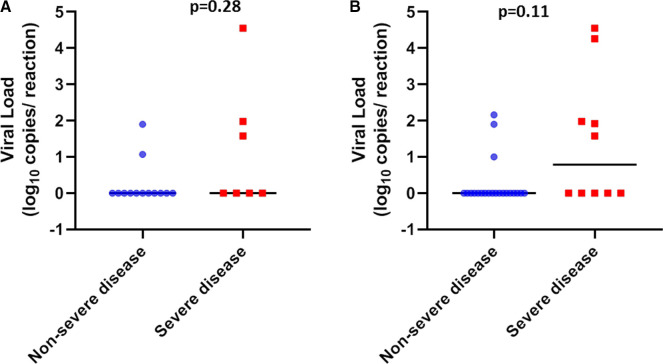
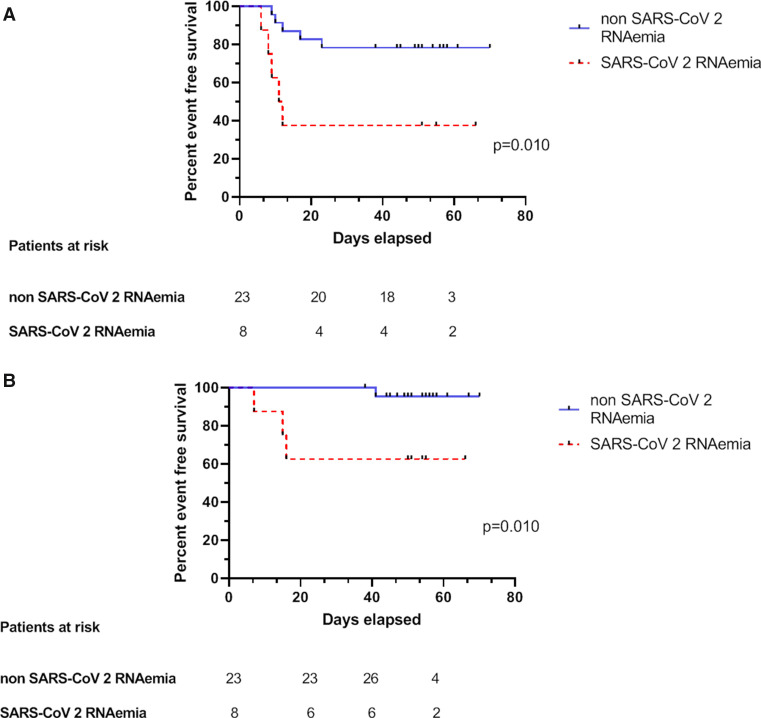
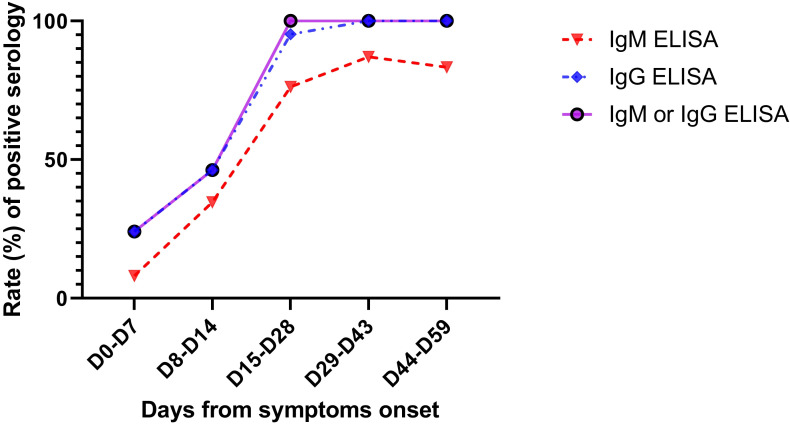
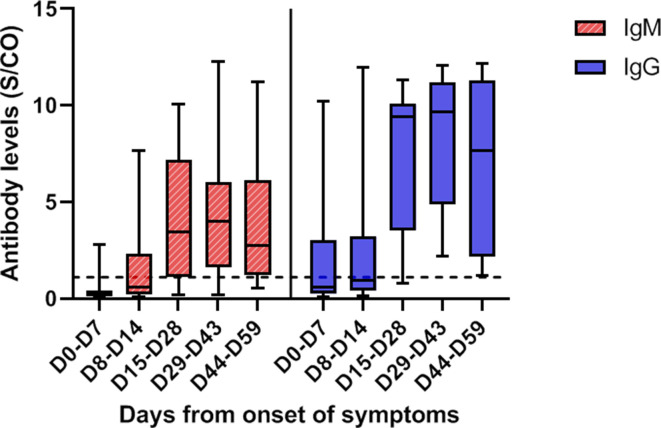
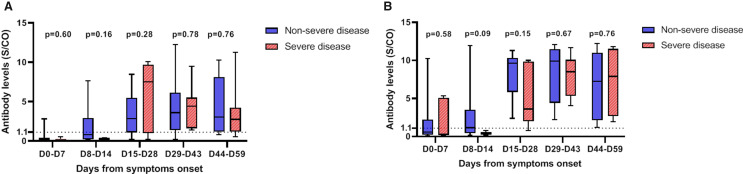
Severe acute respiratory syndrome coronavirus 2 (SARS-CoV-2) has spread widely, causing coronavirus disease 2019 (COVID-19) and significant mortality. However, data on viral loads and antibody kinetics in immunocompromised populations are lacking. We aimed to determine nasopharyngeal and plasma viral loads via reverse transcription-polymerase chain reaction and SARS-CoV-2 serology via enzyme-linked immunosorbent assay and study their association with severe forms of COVID-19 and death in kidney transplant recipients. In this study, we examined hospitalized kidney transplant recipients with nonsevere (n = 21) and severe (n = 19) COVID-19. SARS-CoV-2 nasopharyngeal and plasma viral load and serological response were evaluated based on outcomes and disease severity. Ten recipients (25%) displayed persistent viral shedding 30 days after symptom onset. The SARS-CoV-2 viral load of the upper respiratory tract was not associated with severe COVID-19, whereas the plasma viral load was associated with COVID-19 severity (P = .010) and mortality (P = .010). All patients harbored antibodies during the second week after symptom onset that persisted for 2 months. We conclude that plasma viral load is associated with COVID-19 morbidity and mortality, whereas nasopharyngeal viral load is not. SARS-CoV-2 shedding is prolonged in kidney transplant recipients and the humoral response to SARS-CoV-2 does not show significant impairment in this series of transplant recipients.


Figures

FIGURE 1
FIGURE 1
Severe acute respiratory syndrome coronavirus 2 viral load distribution in nasopharyngeal swabs according to disease severity. A, Scatter plots with the medians (black lines) of the viral loads at admission in nonsevere (blue circles) and severe patients (red squares). B, Scatter plots with the medians (black lines) of the maximum viral loads during the follow-up in nonsevere (blue circles) and severe patients (red squares) [Colour figure can be viewed at wileyonlinelibrary.com]
FIGURE 2
FIGURE 2
Severe acute respiratory syndrome coronavirus 2 viral load kinetics analyzed using nasopharyngeal swabs. Patients are stratified according to nonsevere disease (blue) and severe disease (red). The thick lines show the trend in viral load using smoothing splines
FIGURE 3
FIGURE 3
Severe acute respiratory syndrome coronavirus 2 viral load distribution in plasma according to disease severity. A, Scatter plots with the medians (black lines) of the viral loads at admission in nonsevere (blue circles) and severe patients (red squares). B, Scatter plots with the medians (black lines) of the maximum viral loads during the follow-up in nonsevere (blue circles) and severe patients (red squares) [Colour figure can be viewed at wileyonlinelibrary.com]
FIGURE 4
FIGURE 4
Association of positive SARS-CoV-2 RNAemia with COVID-19 severity and mortality. A, Kaplan-Meier plots of COVID-19-free survival according to SARS-CoV-2 RNAemia. Presence of SARS-CoV-2 RNAemia (dotted red curve) vs its absence (solid blue curve), P = .010. B, Kaplan-Meier plots of severe COVID-19-free survival according to SARS-CoV-2 RNAemia. Presence of SARS-CoV-2 RNAemia (dotted red curve) vs its absence (solid blue curve), P = .01. COVID-19, coronavirus disease 2019; SARS-CoV-2, severe acute respiratory syndrome coronavirus 2 [Colour figure can be viewed at wileyonlinelibrary.com]
FIGURE 5
FIGURE 5
Rate of positive SARS-CoV-2 IgM (dotted red curve with triangles), IgG (dotted blue curve with rhombus), and IgM or IgG (solid purple curve) tested by an ELISA according to the days from symptom onset. A total of 116 samples from 35 patients were tested. From day 15 (D15) onwards, all samples were positive for IgM or IgG. ELISA, enzyme-linked immunosorbent assay; SARS-CoV-2, severe acute respiratory syndrome coronavirus 2 [Colour figure can be viewed at wileyonlinelibrary.com]
FIGURE 6
FIGURE 6
SARS-CoV-2 IgM (hatched red plots) and IgG (filled blue plots) titers tested by an ELISA, according to the days from symptom onset. IgM and IgG levels increased significantly over time. Antibody levels are presented as the measured S/CO. The dotted line represents the cutoff value (1.1). The boxplots show medians (middle line) and first and third quartiles (boxes), whereas the whiskers indicate minimum and maximum values. ELISA, enzyme-linked immunosorbent assay; SARS-CoV-2, severe acute respiratory syndrome coronavirus 2; S/CO, absorbance values divided by the cutoff [Colour figure can be viewed at wileyonlinelibrary.com]
FIGURE 7
FIGURE 7
Severe acute respiratory syndrome coronavirus 2 IgM (A) and IgG (B) titers tested by an enzyme-linked immunosorbent assay according to the days from symptom onset and stratified by disease severity (severe [hatched red plots] vs nonsevere [filled blue plots]). IgM and IgG antibody levels did not differ according to disease severity (P > .05). Antibody levels are presented as the measured S/CO. The dotted line represents the cutoff value (1.1). The boxplots show medians (middle line) and first and third quartiles (boxes), whereas the whiskers indicate minimum and maximum values. S/CO, absorbance values divided by the cutoff [Colour figure can be viewed at wileyonlinelibrary.com]

References

    1. Zhu NA, Zhang D, Wang W, et al. A novel coronavirus from patients with pneumonia in China, 2019. N Engl J Med. 2020;382(8):727–733. - PMC - PubMed
    1. Manuel O, Estabrook M. RNA respiratory viral infections in solid organ transplant recipients: guidelines from the American Society of Transplantation Infectious Diseases Community of Practice. Clin Transplant. 2019;33(9):e13511. - PMC - PubMed
    1. van de Veerdonk FL, Kolwijck E, Lestrade PPA, et al. Influenza-associated aspergillosis in critically Ill patients. Am J Respir Crit Care Med. 2017;196(4):524–527. - PubMed
    1. Anesi GL. Coronavirus-disease-2019-COVID-19-critical-care-and-airway-management-issues. https://www.uptodate.com/contents/coronavirus-disease-2019-covid-19-crit.... Published July 15, 2020. Accessed July 20, 2020.
    1. Uniformed Services University of the Health Sciences. DoD COVID-19 Practice Management Guide. https://www.usuhs.edu/sites/default/files/media/vpe/pdf/dod_covid-19_pmg.... Published May 14, 2020. Accessed July 20, 2020.

Publication types

Substances