. 2020 Aug 10;17(1):234.
doi: 10.1186/s12974-020-01907-0.

Microglial burden, activation and dystrophy patterns in frontotemporal lobar degeneration

Affiliations

Microglial burden, activation and dystrophy patterns in frontotemporal lobar degeneration

Ione O C Woollacott et al. J Neuroinflammation. .

Abstract

Background: Microglial dysfunction is implicated in frontotemporal lobar degeneration (FTLD). Although studies have reported excessive microglial activation or senescence (dystrophy) in Alzheimer's disease (AD), few have explored this in FTLD. We examined regional patterns of microglial burden, activation and dystrophy in sporadic and genetic FTLD, sporadic AD and controls.

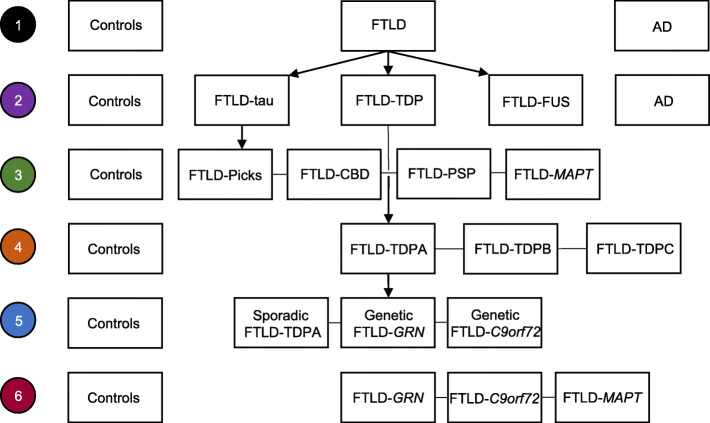
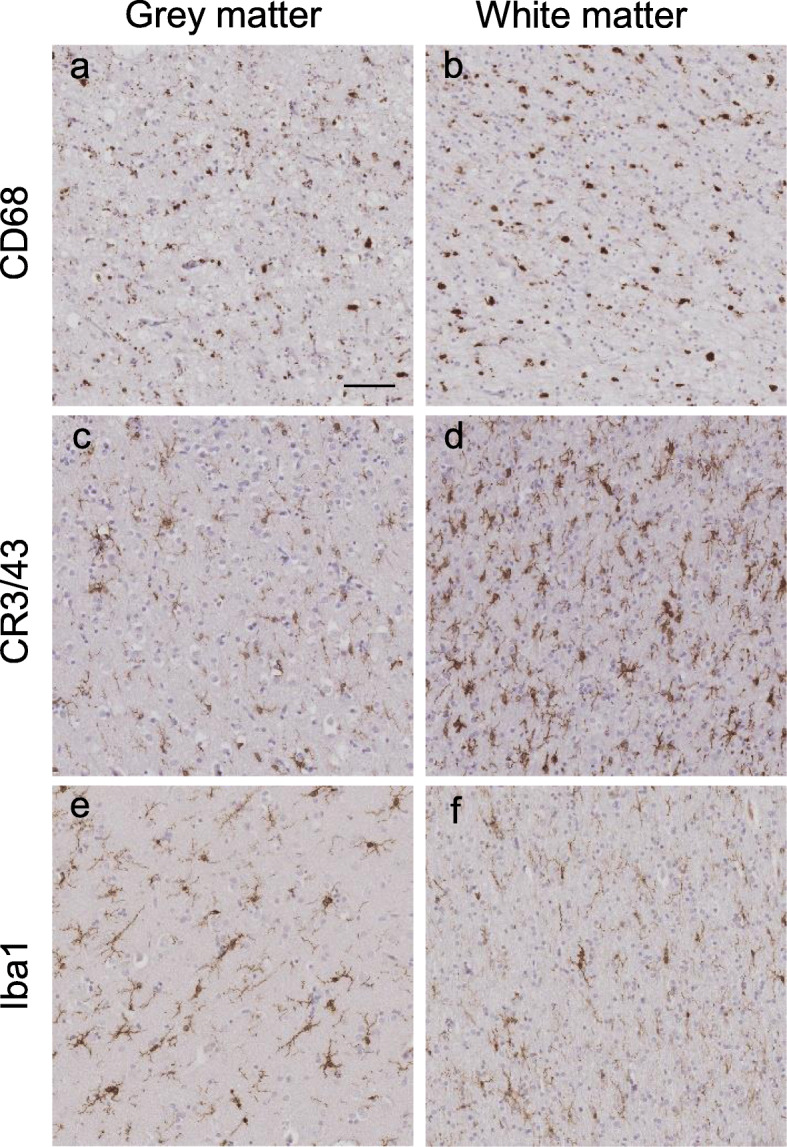
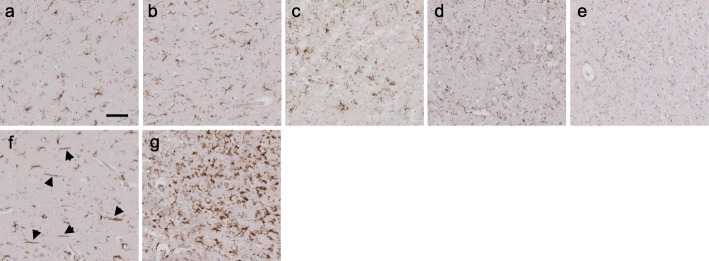
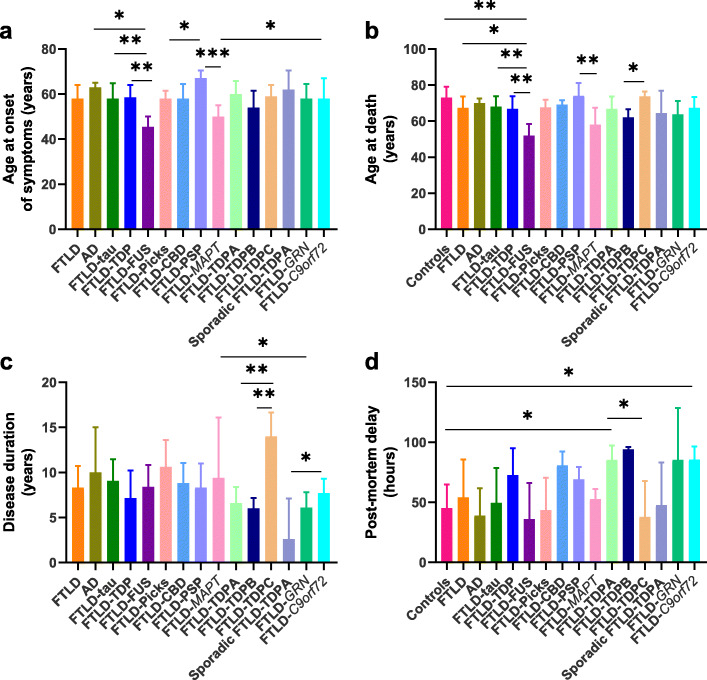
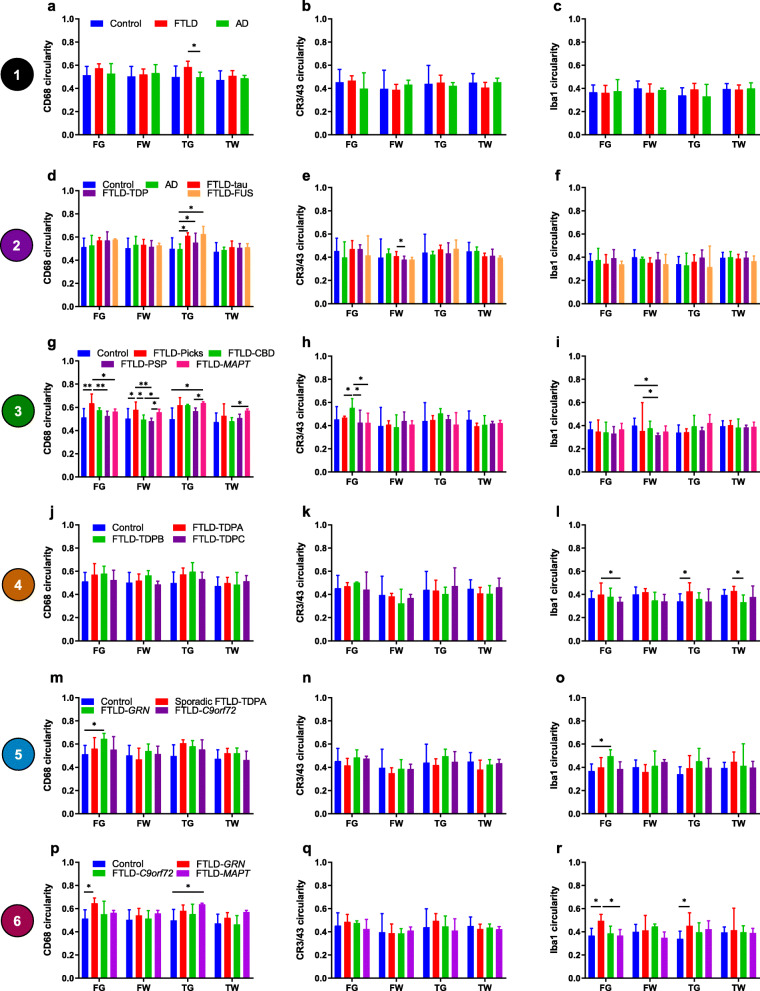
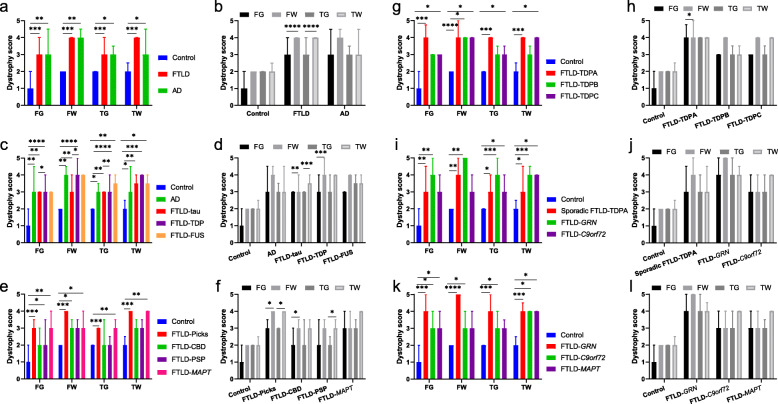
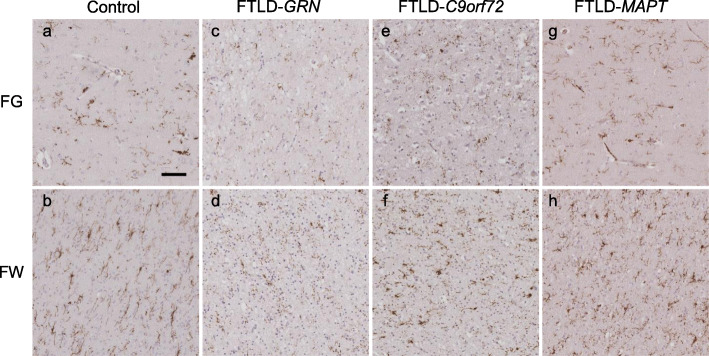
Methods: Immunohistochemistry was performed in frontal and temporal grey and white matter from 50 pathologically confirmed FTLD cases (31 sporadic, 19 genetic: 20 FTLD-tau, 26 FTLD-TDP, four FTLD-FUS), five AD cases and five controls, using markers to detect phagocytic (CD68-positive) and antigen-presenting (CR3/43-positive) microglia, and microglia in general (Iba1-positive). Microglial burden and activation (morphology) were assessed quantitatively for each microglial phenotype. Iba1-positive microglia were assessed semi-quantitatively for dystrophy severity and qualitatively for rod-shaped and hypertrophic morphology. Microglia were compared in each region between FTLD, AD and controls, and between different pathological subtypes of FTLD, including its main subtypes (FTLD-tau, FTLD-TDP, FTLD-FUS), and subtypes of FTLD-tau, FTLD-TDP and genetic FTLD. Microglia were also compared between grey and white matter within each lobe for each group.

Results: There was a higher burden of phagocytic and antigen-presenting microglia in FTLD and AD cases than controls, but activation was often not increased. Burden was generally higher in white matter than grey matter, but activation was greater in grey matter. However, microglia varied regionally according to FTLD subtype and disease mechanism. Dystrophy was more severe in FTLD and AD than controls, and more severe in white than grey matter, but this also varied regionally and was particularly extensive in FTLD due to progranulin (GRN) mutations. Presence of rod-shaped and hypertrophic microglia also varied by FTLD subtype.

Conclusions: This study demonstrates regionally variable microglial involvement in FTLD and links this to underlying disease mechanisms. This supports investigation of microglial dysfunction in disease models and consideration of anti-senescence therapies in clinical trials.

Keywords: Dystrophy; Frontotemporal dementia; Frontotemporal lobar degeneration; Microglia; Neuroinflammation; Progranulin.


Conflict of interest statement

The authors declare that they have no competing interests.

Figures

Fig. 1
Fig. 1
Approach to group comparisons. Demographics and microglial parameters (burden, circularity and perimeter values and dystrophy scores) were compared between groups using six levels of comparison (numbers in circles denote level): 1: overall disease groups; 2: controls, main FTLD subtypes (FTLD-TDP, FTLD-tau and FTLD-FUS) and AD; 3: controls and FTLD-tau subtypes; 4: controls and FTLD-TDP subtypes; 5: controls and either sporadic or genetic FTLD-TDPA (genetic had either GRN mutations, FTLD-GRN, or C9orf72 expansions, FTLD-C9orf72); 6: controls and genetic FTLD subtypes (the FTLD-C9orf72 group included only FTLD-TDPA cases to ensure comparison of mutation rather than pathological subtype)
Fig. 2
Fig. 2
Immunohistochemical staining of each microglial marker. Representative images of immunohistochemical staining in cortical grey matter (a, c, e) and subcortical white matter (b, d, f) of sections with CD68-positive microglia (a, b) CR3/43-positive microglia (c, d) and Iba1-positive microglia (e, f). Images were taken from the following cases (in Supplementary Table 1): a and b from case 25; c–f from case 55. Scale bar represents 50 μm in all images
Fig. 3
Fig. 3
Scoring of the severity of microglial dystrophy and examples of rod-shaped and hypertrophic microglia. Iba1 immunohistochemical staining showing representative images of the semi-quantitative analysis of microglial dystrophy and the different microglial morphologies. Grey matter sections from a healthy control (a, case 2 in Supplementary Table 1) and four different FTLD cases (in Supplementary Table 1: b case 44; c case 22; d case 42; e case 37) show appearances of dystrophic microglia, graded in severity, from a (1 = no dystrophy), b (2 = mild dystrophy), c (3 = moderate), d (4 = severe), to e (5 = very severe). When dystrophy is very severe, minimal staining is visible due to complete disruption of normal cell structure. f Several rod-shaped microglia in the frontal grey matter of an FTLD-TDPB case with the C9orf72 expansion (case 48; black arrows point to these cells). g Multiple hypertrophic microglia throughout the frontal grey matter of an FTLD-Picks case (case 25; most cells present have a bushy appearance with short, thick processes). Scale bar represents 50 μm in all images
Fig. 4
Fig. 4
Comparison of demographics between groups. Graphs show comparisons of age at onset (AAO) (a), age at death (AAD) (b), disease duration (c) and post-mortem delay (d) across groups. Bars show medians and error bars represent interquartile ranges. *p < 0.05; **p < 0.01; ***p ≤ 0.001; ****p ≤ 0.0001
Fig. 5
Fig. 5
Microglial burden compared between groups in each region. Comparisons of the burden of CD68-positive (a, d, g, j, m, p), CR3/43-positive (b, e, h, k, n, q) and Iba1-positive (c, f, i, l, o, r) microglia for each group comparison level shown within Fig. 1 (numbers in coloured circles on the left represent level of comparison). Graphs show median microglial burden (percentage area values) in each brain region: frontal grey (FG), frontal white (FW), temporal grey (TG) and temporal white (TW) matter. See legend in first graph on each row for bar colours. Error bars represent interquartile range. *p < 0.05; **p < 0.01; ***p ≤ 0.001; ****p ≤ 0.0001
Fig. 6
Fig. 6
Microglial circularity compared between groups in each region. Comparisons of the circularity of CD68-positive (a, d, g, j, m, p), CR3/43-positive (b, e, h, k, n, q) and Iba1-positive (c, f, i, l, o, r) microglia for each group comparison level shown within Fig. 1 (numbers in coloured circles on the left represent level of comparison). Graphs show median circularity values in each brain region: frontal grey (FG), frontal white (FW), temporal grey (TG) and temporal white (TW) matter. See legend in first graph on each row for bar colours. Error bars represent interquartile range. *p < 0.05; **p < 0.01; ***p ≤ 0.001; ****p ≤ 0.0001
Fig. 7
Fig. 7
Microglial perimeter compared between groups in each region. Comparisons of the perimeter of CD68-positive (a, d, g, j, m, p), CR3/43-positive (b, e, h, k, n, q) and Iba1-positive (c, f, i, l, o, r) microglia for each group comparison level shown within Fig. 1 (numbers in coloured circles on the left represent level of comparison). Graphs show median perimeter values in each brain region: frontal grey (FG), frontal white (FW), temporal grey (TG) and temporal white (TW) matter. See legend in first graph on each row for bar colours. Error bars represent interquartile range. *p < 0.05; **p < 0.01; ***p ≤ 0.001; ****p ≤ 0.0001
Fig. 8
Fig. 8
Dystrophy scores compared between groups in each region and between grey and white matter within each lobe for each group. Graphs show comparison of dystrophy scores in each region between groups (a, c, e, g, i, k) and between grey and white matter within each lobe for each group (b, d, f, h, j, l) for control, FTLD and AD groups (a, b), main FTLD subtypes (c, d), and subtypes of FTLD-tau (e, f), FTLD-TDP (g, h), sporadic and genetic FTLD-TDPA (i, j) and genetic FTLD (k, l). Bars show median dystrophy scores and error bars show interquartile range. FG = frontal grey; FW = frontal white; TG = temporal grey; TW = temporal white matter. *p < 0.05; **p < 0.01; ***p ≤ 0.001; ****p ≤ 0.0001
Fig. 9
Fig. 9
Examples of dystrophic microglia in controls and genetic FTLD subtypes. Differing severities of dystrophic Iba1-positive microglia are visible in frontal grey (FG) matter (a, c, e, g) and frontal subcortical white (FW) matter (b, d, f, h) of controls (a, b) and FTLD-GRN (c, d), FTLD-C9orf72 (e, f) and FTLD-MAPT (g, h) cases. Scale bar represents 50 μm in all images. Note that in the FTLD-GRN case there is particularly extensive dystrophy, which is worse in white matter, where there is generalised punctate Iba1 staining consistent with severe cellular disruption (d). Images were taken from the following cases (in Supplementary Table 1): control (case 4), FTLD-GRN (case 40, has FTLD-TDPA), FTLD-C9orf72 (case 42, has FTLD-TDPA) and FTLD-MAPT (case 16)

References

    1. Lashley T, Rohrer JD, Mead S, Revesz T. Review: an update on clinical, genetic and pathological aspects of frontotemporal lobar degenerations. Neuropathol Appl Neurobiol. 2015;41:858–881. doi: 10.1111/nan.12250. - DOI - PubMed
    1. Lee EB, Porta S, Michael Baer G, Xu Y, Suh E, Kwong LK, et al. Expansion of the classification of FTLD-TDP: distinct pathology associated with rapidly progressive frontotemporal degeneration. Acta Neuropathol. 2017;134:65–78. doi: 10.1007/s00401-017-1679-9. - DOI - PMC - PubMed
    1. Lashley T, Rohrer JD, Bandopadhyay R, Fry C, Ahmed Z, Isaacs AM, et al. A comparative clinical, pathological, biochemical and genetic study of fused in sarcoma proteinopathies. Brain. 2011;134:2548–2564. doi: 10.1093/brain/awr160. - DOI - PMC - PubMed
    1. Munoz DG, Neumann M, Kusaka H, Yokota O, Ishihara K, Terada S, et al. FUS pathology in basophilic inclusion body disease. Acta Neuropathol. 2009;118:617–627. doi: 10.1007/s00401-009-0598-9. - DOI - PubMed
    1. Neumann M, Roeber S, Kretzschmar HA, Rademakers R, Baker M, Mackenzie IRA. Abundant FUS-immunoreactive pathology in neuronal intermediate filament inclusion disease. Acta Neuropathol. 2009;118:605–616. doi: 10.1007/s00401-009-0581-5. - DOI - PMC - PubMed

MeSH terms

LinkOut - more resources