. 2020 Aug 10;13(1):32.
doi: 10.1186/s13072-020-00353-9.

Distinct and overlapping roles of STAG1 and STAG2 in cohesin localization and gene expression in embryonic stem cells

Affiliations

Distinct and overlapping roles of STAG1 and STAG2 in cohesin localization and gene expression in embryonic stem cells

Nicole L Arruda et al. Epigenetics Chromatin. .

Abstract

Background: The three-dimensional organization of the genome in the nucleus plays an integral role in many biological processes, including gene expression. The genome is folded into DNA loops that bring together distal regulatory elements and genes. Cohesin, a ring-shaped protein complex, is a major player in the formation of DNA loops. Cohesin is composed of a core trimer and one of two variant STAG subunits, STAG1 or STAG2. It is not understood whether variant STAG proteins give rise to cohesin complexes with distinct functions. Recent studies have begun to characterize the roles of STAG1 and STAG2, with partially contradictory results.

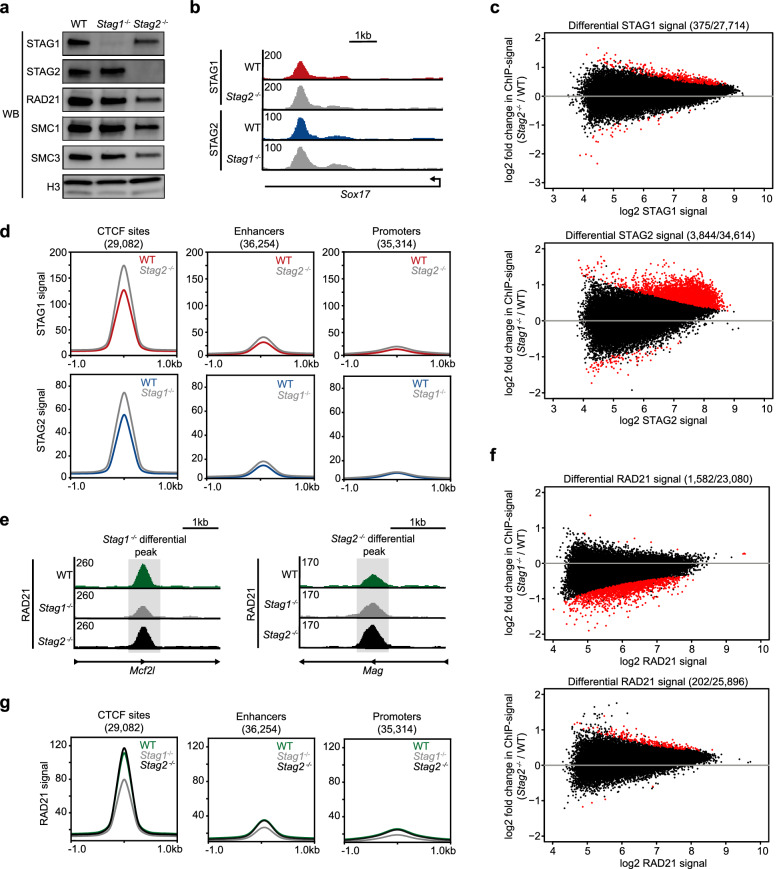
Results: Here, we generate stable single-knockout embryonic stem cell lines to investigate the individual contributions of STAG1 and STAG2 in regulating cohesin chromosomal localization and function. We report both overlapping roles for STAG1 and STAG2 in cohesin localization and somewhat distinct roles in gene expression. STAG1 and STAG2 occupy the same sites across the genome, yet do not exist together in a higher order complex. Despite their shared localization, STAG1 and STAG2 have both distinct and redundant effects on gene expression. Loss of both STAG1 and STAG2 causes widespread transcriptome dysregulation, altered cohesin DNA occupancy, and reduced cell proliferation.

Conclusions: Together, this work reveals the requirement of at least one STAG protein for proper cohesin function. STAG1 and STAG2 have independent roles in cohesin localization and both overlapping and distinct roles in gene expression. The roles of STAG1 and STAG2 in mouse embryonic stem cells may be somewhat different than in other cell types, due to their relative expression levels. These results advance our understanding of the link between mammalian genome organization and gene expression during development and disease contexts.

Keywords: CRISPR/Cas9; CTCF; Cohesin; Enhancers; Gene expression; Promoters; STAG; Stem cell; Transcription.


Conflict of interest statement

The authors declare no competing interests.

Figures

Fig. 1
Fig. 1
Overlapping distribution of cohesin-STAG1 and cohesin-STAG2 on the genome. a Genome browser tracks showing ChIP-seq signal for STAG1, STAG2, RAD21, and CTCF (Z-score normalized). b Average signal plots of STAG1 and STAG2 signal at STAG1 peaks and STAG2 peaks (Z-score normalized). c Frequency of peaks overlapping known functional elements in the genome: CTCF sites, enhancers, promoters, or other (none of the above). d Clustered heatmaps displaying STAG1, STAG2, RAD21, and CTCF signal (Z-score normalized) at a union list of STAG1 and STAG2 peaks. e Western blot analysis following co-immunoprecipitation of SMC1, STAG1, and STAG2 from nuclear lysates
Fig. 2
Fig. 2
Cohesin distribution is minimally changed in Stag1/ and Stag2/ mESCs. a Western blot analysis of cohesin subunit levels in wild-type, Stag1/, and Stag2/ nuclear lysates. b Genome browser tracks showing STAG1 signal in wild-type and Stag2/ cells, and STAG2 signal in wild-type and Stag1/ cells. c MA plots showing differential enrichment of STAG1 signal between wild-type and Stag2/ cells. Differential enrichment of STAG2 signal between wild-type and Stag1/ cells is also shown. d Average signal plots of STAG1 signal at CTCF sites, enhancers, and promoters in wild-type and Stag2/ cells. STAG2 signal at CTCF sites, enhancers, and promoters in wild-type and Stag1/ cells is also shown. e Genome browser tracks showing RAD21 signal in wild-type, Stag1/, and Stag2/ cells at Stag1/ and Stag2/ differential peaks. f MA plots showing differential enrichment of RAD21 in Stag1/ and Stag2/ cells. g Average signal plots of RAD21 signal at CTCF sites, enhancers, and promoters in wild-type, Stag1/, and Stag2/ cells
Fig. 3
Fig. 3
STAG1 and STAG2 display partially distinct and overlapping roles in gene expression. a Overlap of differentially expressed genes (DEGs) in Stag1/ cells compared to wild-type cells and Stag2/ cells compared to wild-type cells. Cells were treated with siGLO as a transfection control. b Correlation plot of log2 fold changes of DEGs. DEGs specific to Stag1/ are shown in red, DEGS specific to Stag2/ are shown in blue, and DEGs sensitive to the loss of either STAG (common) are shown in purple. c Heatmap of log2 fold changes for a combined list of DEGs in Stag1/ and Stag2/ cells. Heatmap of STAG1 and STAG2 ChIP-seq signal in wild-type cells at the promoters of the combined list of DEGs. d Average signal plots for STAG1, STAG2, and RAD21 ChIP-seq signal in wild-type cells at Stag1/ specific, common, and Stag2/ specific DEG promoters. e Gene Ontology (GO) terms for biological processes that are Stag1/ specific, Stag2/ specific, and common to both knockouts. f Violin plot depicting log2 fold changes for all DEGs, and those within Super-enhancer Domains and Polycomb Domains for Stag1/ and Stag2/ cells. Dotted lines indicate the mean. Asterisks indicate significant differences between groups (****p < 0.0001, **p < 0.01). g Bar graphs with log2 fold change of expression of cell identity genes, including those that represent pluripotency (Pou5f1, Sox2, Nanog), ectoderm (Pax6 and Nestin), and endoderm lineages (Gata6 and Sox17) in Stag1/ and Stag2/ cells. Asterisks indicate significant differences from wild-type cells (padj < 0.01)
Fig. 4
Fig. 4
Dual loss of STAG1 and STAG2 reveals redundant functions. a Genome browser tracks for RAD21 ChIP-seq signal in the four conditions: wild-type siGLO, wild-type siStag1, Stag2/ siGLO, and Stag2/ siStag1 cells. b Average signal plots and heatmaps of RAD21 signal at a union peak list from the four conditions. c Venn diagram of DEGs from Stag1/ siGLO, Stag2/ siGLO, and Stag2/ siStag1 cells. d Clustered heatmap of log2 fold changes for a combined list of DEGs in wild-type siStag1, Stag2/ siGLO, and Stag2/ siStag1 cells all relative to wild-type siGLO. e Violin plots depicting log2-fold changes of all DEGs, and those within Super-enhancer Domains and Polycomb Domains for wild-type siStag1, Stag2/ siGLO, and Stag2/ siStag1 cells all relative to wild-type siGLO. Dotted lines indicate the mean. Asterisks indicate significant differences between groups (****p < 0.0001). f Bar graphs with log2 fold change of expression of cell identity genes including those that represent pluripotency (Pou5f1, Sox2, Nanog), ectoderm (Pax6 and Nestin), and endoderm lineages (Gata6 and Sox17) in wild-type siStag1, Stag2/ siGLO, and Stag2/ siStag1 cells, all relative to wild-type siGLO. Asterisks indicate significant differences from wild-type siGLO cells (padj < 0.01). g Bar graph with log2 fold change of expression of genes inside and outside of Super-enhancer Domains in wild-type siStag1, Stag2/ siGLO, or Stag2/ siStag1 cells, all relative to wild-type siGLO. Asterisks indicate significant differences from wild-type siGLO cells (padj < 0.01). h Western blot analysis following co-immunoprecipitation of CTCF and cohesin in the four conditions. i Proliferation assay with relative cell number represented as a fraction of original plating density for the four conditions. Asterisks indicate significant differences between groups (****p < 0.0001, **p < 0.01, *p < 0.05). Significance at 72 h is between wild-type siStag1 and Stag2/ siStag1 conditions

References

    1. Rao SSP, Huntley MH, Durand NC, Stamenova EK, Bochkov ID, Robinson JT, et al. A 3D map of the human genome at kilobase resolution reveals principles of chromatin looping. Cell. 2014;159(7):1665–1680. - PMC - PubMed
    1. Wendt KS, Yoshida K, Itoh T, Bando M, Koch B, Schirghuber E, et al. Cohesin mediates transcriptional insulation by CCCTC-binding factor. Nature. 2008;451(7180):796–801. - PubMed
    1. Bonev B, Cavalli G. Organization and function of the 3D genome. Nat Rev Genet. 2016;17:661–678. - PubMed
    1. Busslinger GA, Stocsits RR, Van Der Lelij P, Axelsson E, Tedeschi A, Galjart N, et al. Cohesin is positioned in mammalian genomes by transcription, CTCF and Wapl. Nature. 2017;544(7651):503–507. - PMC - PubMed
    1. Mehta GD, Kumar R, Srivastava S, Ghosh SK. Cohesin: functions beyond sister chromatid cohesion. FEBS Lett. 2013;587(15):2299–2312. - PubMed

Publication types