

Climate and tree seed production predict the abundance of the European Lyme disease vector over a 15-year period
- PMID: 32778177
- PMCID: PMC7418309
- DOI: 10.1186/s13071-020-04291-z
Climate and tree seed production predict the abundance of the European Lyme disease vector over a 15-year period
Abstract
Background: To predict the risk of tick-borne disease, it is critical to understand the ecological factors that determine the abundance of ticks. In Europe, the sheep tick (Ixodes ricinus) transmits a number of important diseases including Lyme borreliosis. The aim of this long-term study was to determine the abiotic and biotic factors driving the annual abundance of I. ricinus at a location in Switzerland where Lyme borreliosis is endemic.
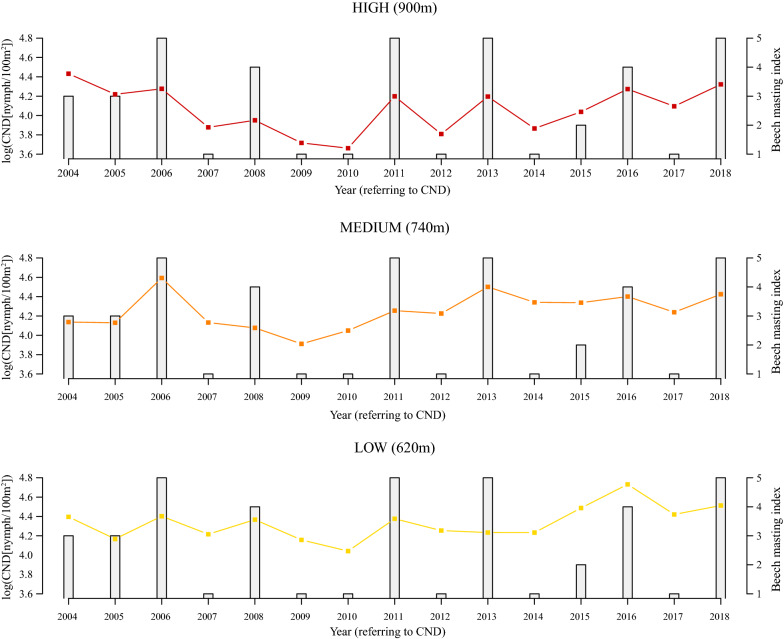
Methods: Over a 15-year period (2004 to 2018), we monitored the abundance of I. ricinus ticks on a monthly basis at three different elevations on Chaumont Mountain in Neuchâtel, Switzerland. We collected climate variables in the field and from nearby weather stations. We obtained data on beech tree seed production from the literature, as the abundance of Ixodes nymphs can increase dramatically two years after a masting event. We used AIC-based model selection to determine which ecological variables drive annual variation in tick density.
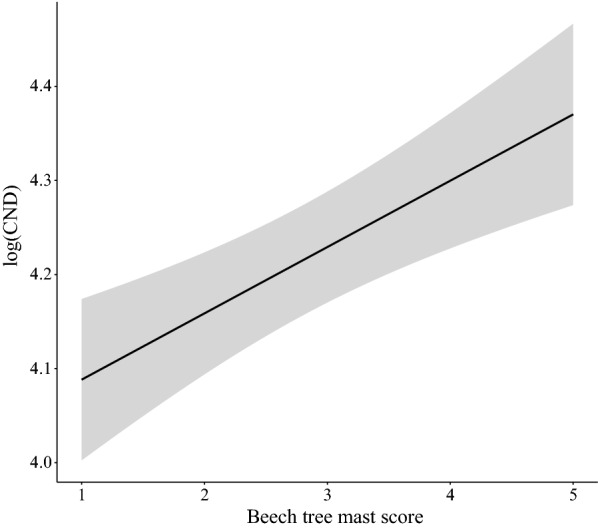
Results: We found that elevation site, year, seed production by beech trees two years prior, and mean annual relative humidity together explained 73.2% of the variation in our annual estimates of nymph density. According to the parameter estimates of our models, (i) the annual density of nymphs almost doubled over the 15-year study period, (ii) changing the beech tree seed production index from very poor mast (1) to full mast (5) increased the abundance of nymphs by 86.2% two years later, and (iii) increasing the field-collected mean annual relative humidity from 50.0 to 75.0% decreased the abundance of nymphs by 46.4% in the same year. Climate variables collected in the field were better predictors of tick abundance than those from nearby weather stations indicating the importance of the microhabitat.
Conclusions: From a public health perspective, the increase in nymph abundance is likely to have increased the risk of tick-borne disease in this region of Switzerland. Public health officials in Europe should be aware that seed production by deciduous trees is a critical driver of the abundance of I. ricinus, and hence the risk of tick-borne disease.
Keywords: Beech tree; Climate change; Fagus sylvatica; Ixodes ricinus; Lyme disease; Mast years; Tick population ecology; Tick-borne disease.
Conflict of interest statement
The authors declare that they have no competing interests.
Figures


References
-
- Medlock J, Leach S. Impact of climate change on vector-borne disease in the UK. Lancet Infect Dis. 2015;15:159–199. - PubMed
-
- Gage KL, Burkot TR, Eisen RJ, Hayes EB. Climate and vectorborne diseases. Am J Prev Med. 2008;35:436–450. - PubMed
-
- Tälleklint L, Jaenson TGT. Increasing geographical distribution and density of Ixodes ricinus (Acari: Ixodidae) in central and northern Sweden. J Med Entomol. 1998;35:521–526. - PubMed
MeSH terms
Grants and funding
- FN 32-57098.99/Schweizerischer Nationalfonds zur Förderung der Wissenschaftlichen Forschung (CH)
- FN 3200B0-100657/Schweizerischer Nationalfonds zur Förderung der Wissenschaftlichen Forschung
- FN 320000-113936/Schweizerischer Nationalfonds zur Förderung der Wissenschaftlichen Forschung
- FN 310030-127064/Schweizerischer Nationalfonds zur Förderung der Wissenschaftlichen Forschung
- 2009/10 (Projekt (911) 316)/Bundesamt für Gesundheit
LinkOut - more resources
Full Text Sources
Medical
