. 2020 Sep 14;192(37):E1053-E1064.
doi: 10.1503/cmaj.200990. Epub 2020 Aug 9.

Projected effects of nonpharmaceutical public health interventions to prevent resurgence of SARS-CoV-2 transmission in Canada

Affiliations

Projected effects of nonpharmaceutical public health interventions to prevent resurgence of SARS-CoV-2 transmission in Canada

Victoria Ng et al. CMAJ. .

Abstract

Background: Continual efforts to eliminate community transmission of severe acute respiratory syndrome coronavirus 2 (SARS-CoV-2) will be needed to prevent additional waves of infection. We explored the impact of nonpharmaceutical interventions on projected SARS-CoV-2 transmission in Canada.

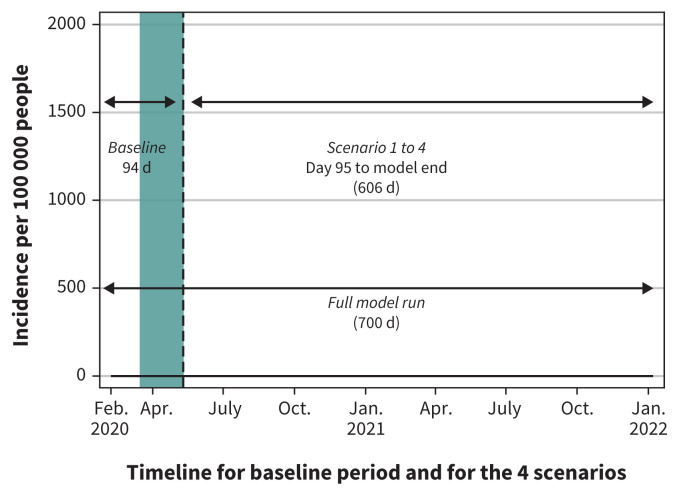
Methods: We developed an age-structured agent-based model of the Canadian population simulating the impact of current and projected levels of public health interventions on SARS-CoV-2 transmission. Interventions included case detection and isolation, contact tracing and quarantine, physical distancing and community closures, evaluated alone and in combination.

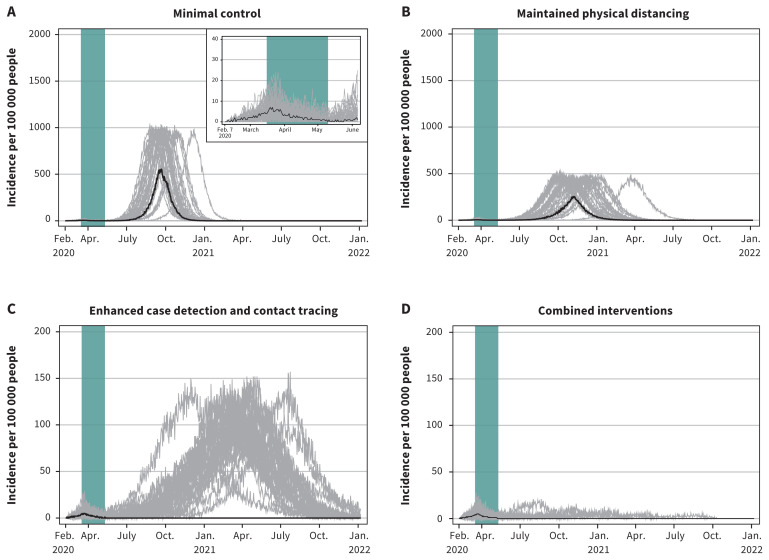
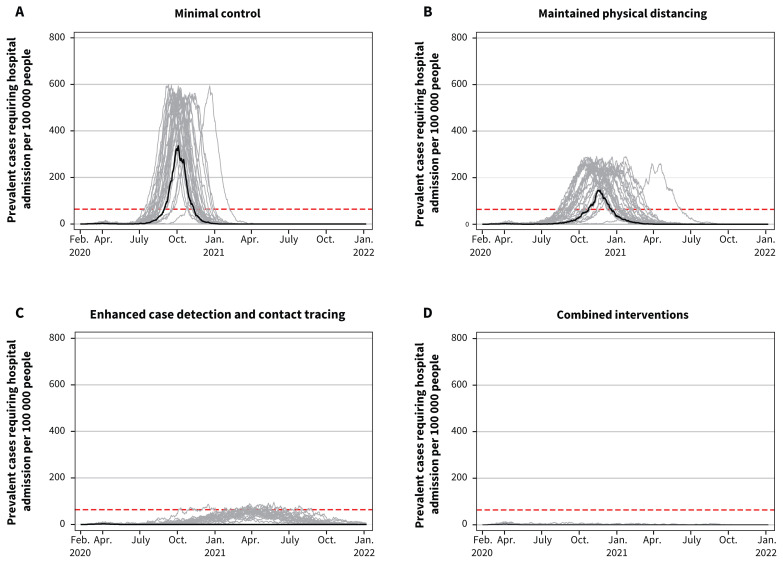
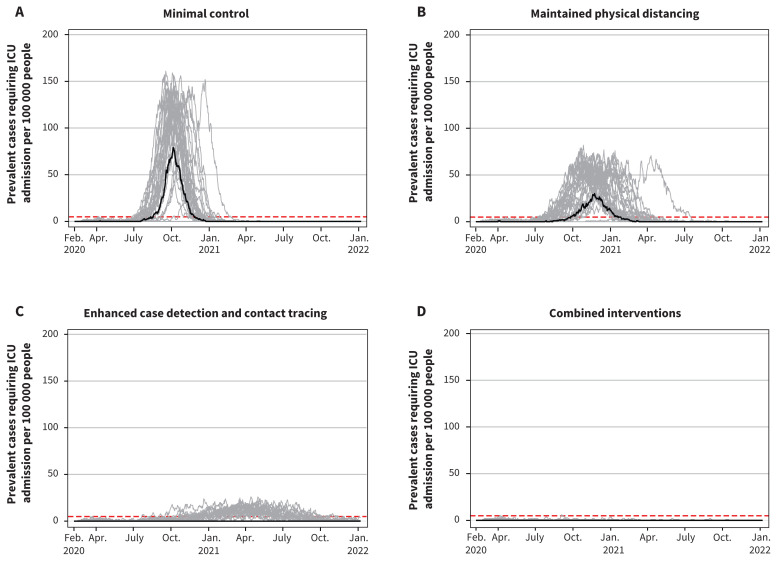
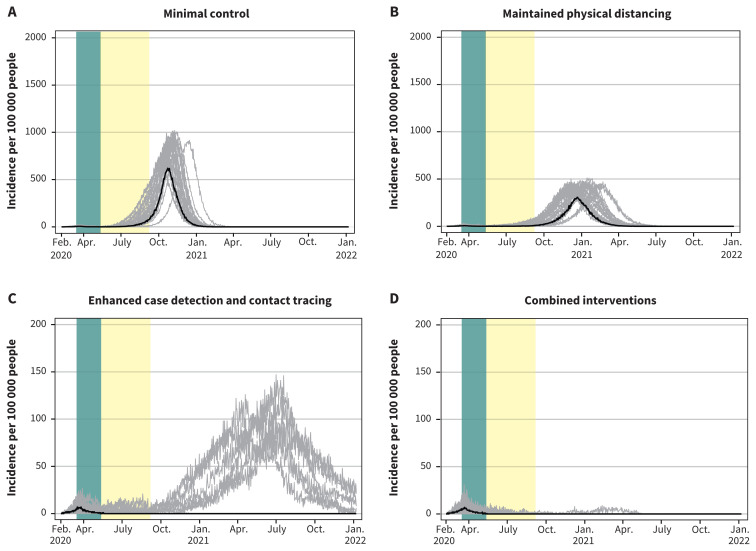
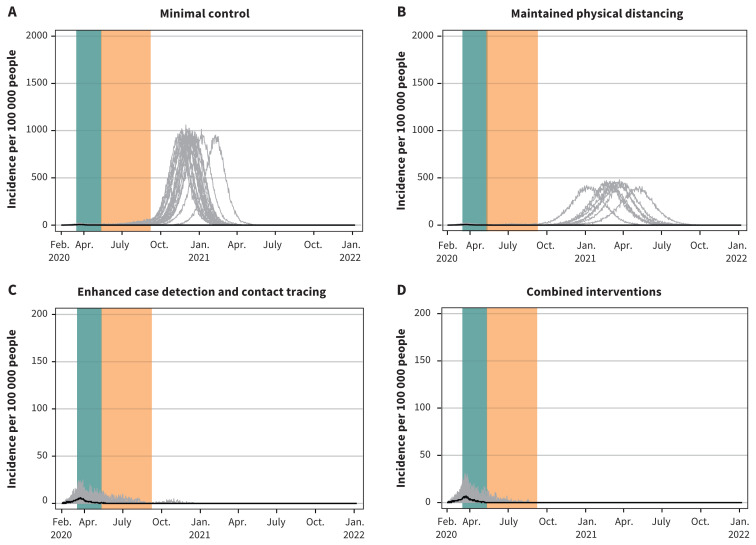
Results: Without any interventions, 64.6% (95% credible interval [CrI] 63.9%-65.0%) of Canadians will be infected with SARS-CoV-2 (total attack rate) and 3.6% (95% CrI 2.4%-3.8%) of those infected and symptomatic will die. If case detection and contact tracing continued at baseline levels without maintained physical distancing and reimplementation of restrictive measures, this combination brought the total attack rate to 56.1% (95% CrI 0.05%-57.1%), but it dropped to 0.4% (95% CrI 0.03%-23.5%) with enhanced case detection and contact tracing. Combining the latter scenario with maintained physical distancing reduced the total attack rate to 0.2% (95% CrI 0.03%-1.7%) and was the only scenario that consistently kept hospital and intensive care unit bed use under capacity, prevented nearly all deaths and eliminated the epidemic. Extending school closures had minimal effects but did reduce transmission in schools; however, extending closures of workplaces and mixed-age venues markedly reduced attack rates and usually or always eliminated the epidemic under any scenario.

Interpretation: Controlling SARS-CoV-2 transmission will depend on enhancing and maintaining interventions at both the community and individual levels. Without such interventions, a resurgent epidemic will occur, with the risk of overwhelming our health care systems.


Conflict of interest statement

Competing interests: None declared.

Figures

Figure 1:
Figure 1:
The baseline is applied to all 4 scenarios in the first 94 days of model runs. On day 95 (May 11, 2020), a different combination of public health interventions are explored in each scenario. Note: The full model run is 700 days from Feb. 7, 2020, to Jan. 7, 2022. The green bar represents the 8 weeks of restrictive closures (workplace, schools, mixed-age venues representing public spaces, malls, libraries, etc.) within the baseline period, Mar. 16 to May 10, 2020.
Figure 2:
Figure 2:
Projected epidemic curves showing daily case incidence per 100 000 people for the 4 scenarios, with each scenario progressively applying increasing public health measures after restrictive measures are lifted. Note: The green bar represents the period from Mar. 16 to May 10, 2020, corresponding to restrictive closures. The 4 scenarios show the degree to which withdrawing some of the present interventions, while maintaining or enhancing others, would cause Canada to lose control of the epidemic while community transmission is ongoing. Median values are represented by the black line. Each grey line represents 1 model realization out of 50 per scenario. Note: the y-axis scale for the enhanced case detection and contact tracing scenario and the combined interventions scenario is 10 times smaller.
Figure 3:
Figure 3:
Projected hospital bed use showing daily hospital admission prevalence per 100 000 people for the 4 scenarios. Note: Prevalent cases include those requiring general hospital admission in addition to those requiring pre–intensive care unit (ICU) and post-ICU hospital admission resulting from coronavirus disease 2019. The maximum Canadian hospital capacity is represented by the dashed horizontal red lines. Median values are represented by the black line. Each grey line represents 1 model realization out of 50 per scenario.
Figure 4:
Figure 4:
Projected intensive care unit (ICU) bed use showing daily ICU prevalence per 100 000 people for the 4 scenarios. Note: The maximum Canadian ICU bed capacity is represented by the dashed horizontal red lines. Median values are represented by the black line. Each grey line represents 1 model realization out of 50 per scenario.
Figure 5:
Figure 5:
Projected epidemic curves showing daily case incidence per 100 000 people for for the 4 scenarios with extended school closures. Note: Each scenario progressively applies increasing public health measures. The green bar represents the period from Mar. 16 to May 10, 2020, corresponding to restrictive closures. The yellow bar represents the period from May 11 to Sept. 8, 2020, corresponding to school closures only. Median values are represented by the black line. Each grey line represents 1 model realization out of 50 per scenario. The y-axis scale for the enhanced case detection and contact tracing scenario and the combined interventions scenario is 10 times smaller.
Figure 6:
Figure 6:
Projected epidemic curves showing daily case incidence per 100 000 people for the 4 scenarios with extended school closures. Note: Each scenario progressively applies increasing public health measures. The green bar represents the period from Mar. 16 to May 10, 2020, corresponding to restrictive closures. The orange bar represents the period from May 11 to Sept. 8, 2020, corresponding to extended workplace and mixed-age venue closures only. Median values are represented by the black line. Each grey line represents 1 model realization out of 50 per scenario. The y-axis scale for the enhanced case detection and contact tracing scenario and the combined interventions scenario is 10 times smaller.

Comment in

Similar articles

Cited by

References

    1. WHO Director-General’s remarks at the media briefing on COVID-19 — 11 March 2020 [speech]. Geneva: World Health Organization; 2020. Available: www.who.int/dg/speeches/detail/who-director-general-s-opening-remarks-at... (accessed 2020 May 2).
    1. Coronavirus disease 2019 (COVID-19): situation report, 51. Geneva: World Health Organization; 2020:1–9.
    1. COVID-19 Dashboard by the Center for Systems Science and Engineering (CSSE) at Johns Hopkins University. Baltimore: Johns Hopkins University; Available: https://gisanddata.maps.arcgis.com/apps/opsdashboard/index.html#/bda7594... (accessed 2020 June 28).
    1. Wu Z, McGoogan JM. Characteristics of and important lessons from the coronavirus disease 2019 (COVID-19) outbreak in China: summary of a report of 72 314 cases from the Chinese Center for Disease Control and Prevention. JAMA 2020;323:1239–42. 10.1001/jama.2020.2648. - DOI - PubMed
    1. Garg S, Kim L, Whitaker M, et al. Hospitalization rates and characteristics of patients hospitalized with laboratory-confirmed coronavirus disease 2019 — COVID-NET, 14 states, March 1–30, 2020. MMWR Morb Mortal Wkly Rep 2020;69:458–64. - PMC - PubMed

MeSH terms