Large stocks of peatland carbon and nitrogen are vulnerable to permafrost thaw
- PMID: 32778585
- PMCID: PMC7456150
- DOI: 10.1073/pnas.1916387117
Large stocks of peatland carbon and nitrogen are vulnerable to permafrost thaw
Abstract
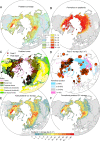
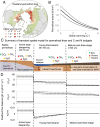
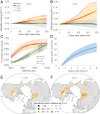
Northern peatlands have accumulated large stocks of organic carbon (C) and nitrogen (N), but their spatial distribution and vulnerability to climate warming remain uncertain. Here, we used machine-learning techniques with extensive peat core data (n > 7,000) to create observation-based maps of northern peatland C and N stocks, and to assess their response to warming and permafrost thaw. We estimate that northern peatlands cover 3.7 ± 0.5 million km2 and store 415 ± 150 Pg C and 10 ± 7 Pg N. Nearly half of the peatland area and peat C stocks are permafrost affected. Using modeled global warming stabilization scenarios (from 1.5 to 6 °C warming), we project that the current sink of atmospheric C (0.10 ± 0.02 Pg C⋅y-1) in northern peatlands will shift to a C source as 0.8 to 1.9 million km2 of permafrost-affected peatlands thaw. The projected thaw would cause peatland greenhouse gas emissions equal to ∼1% of anthropogenic radiative forcing in this century. The main forcing is from methane emissions (0.7 to 3 Pg cumulative CH4-C) with smaller carbon dioxide forcing (1 to 2 Pg CO2-C) and minor nitrous oxide losses. We project that initial CO2-C losses reverse after ∼200 y, as warming strengthens peatland C-sinks. We project substantial, but highly uncertain, additional losses of peat into fluvial systems of 10 to 30 Pg C and 0.4 to 0.9 Pg N. The combined gaseous and fluvial peatland C loss estimated here adds 30 to 50% onto previous estimates of permafrost-thaw C losses, with southern permafrost regions being the most vulnerable.
Keywords: carbon stocks; greenhouse gas fluxes; nitrogen stocks; northern peatlands; permafrost thaw.
Copyright © 2020 the Author(s). Published by PNAS.
Conflict of interest statement
The authors declare no competing interest.
Figures


Comment in
-
The Arctic is burning like never before - and that's bad news for climate change.Nature. 2020 Sep;585(7825):336-337. doi: 10.1038/d41586-020-02568-y. Nature. 2020. PMID: 32913318 No abstract available.
References
-
- Gorham E., Northern peatlands: Role in the carbon cycle and probable responses to climatic warming. Ecol. Appl. 1, 182–195 (1991). - PubMed
-
- Yu Z., Loisel J., Brosseau D. P., Beilman D. W., Hunt S. J., Global peatland dynamics since the Last Glacial Maximum. Geophys. Res. Lett. 37, L13402 (2010).
-
- Frolking S. et al. ., Peatlands in the Earth’s 21st century climate system. Environ. Rev. 19, 371–396 (2011).
-
- Charman D. J. et al. ., Climate-related changes in peatland carbon accumulation during the last millennium. Biogeosciences 10, 929–944 (2013).
Publication types
LinkOut - more resources
Full Text Sources
Other Literature Sources

