. 2020 Aug 10;11(1):3989.
doi: 10.1038/s41467-020-17798-x.

Antibody-secreting cell destiny emerges during the initial stages of B-cell activation

Affiliations

Antibody-secreting cell destiny emerges during the initial stages of B-cell activation

Christopher D Scharer et al. Nat Commun. .

Abstract

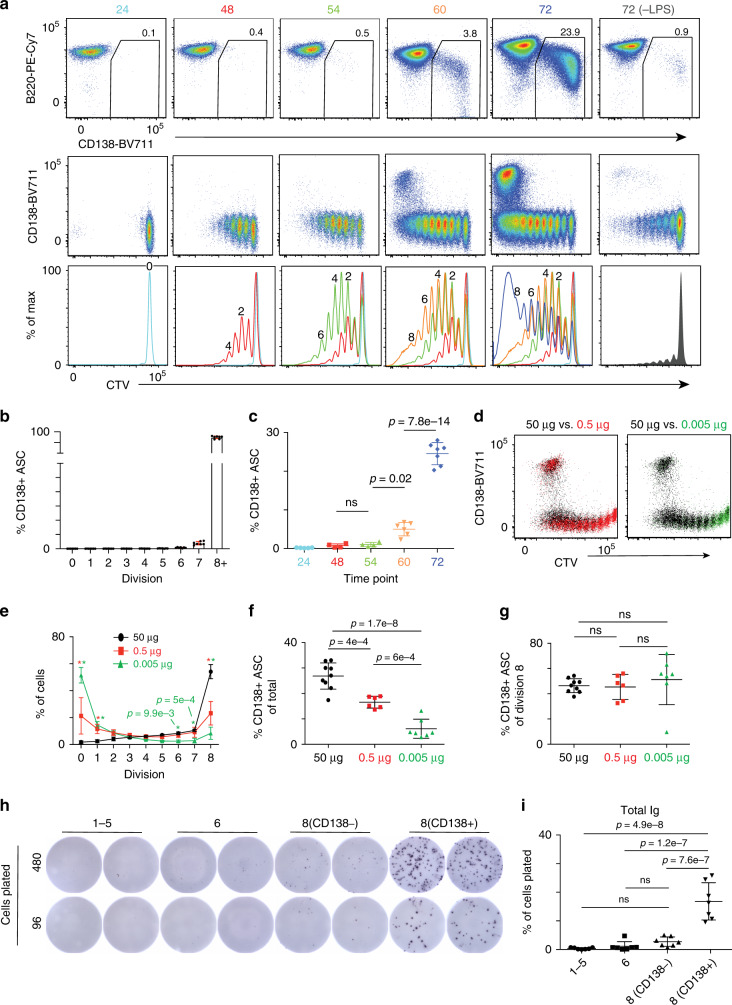
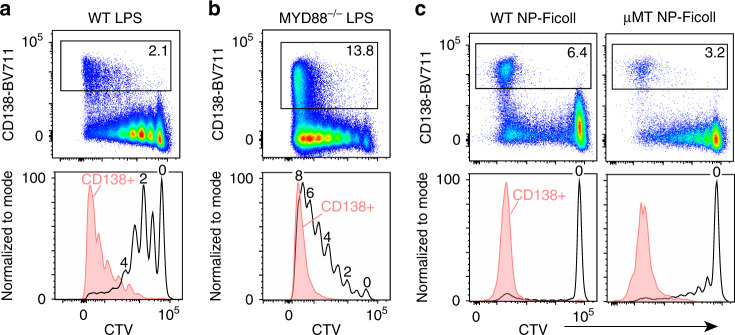
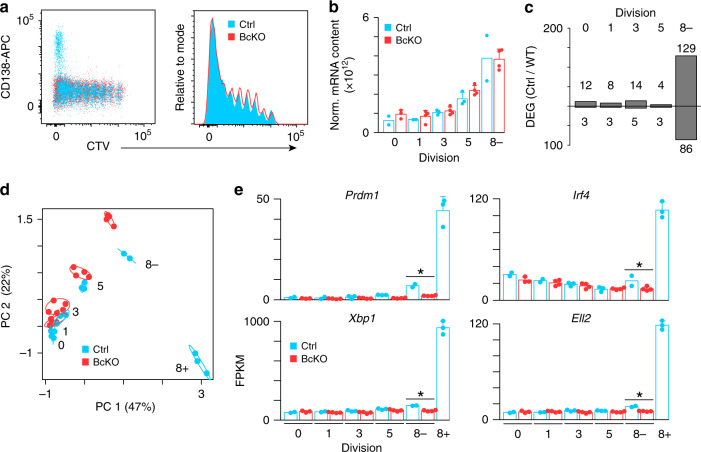
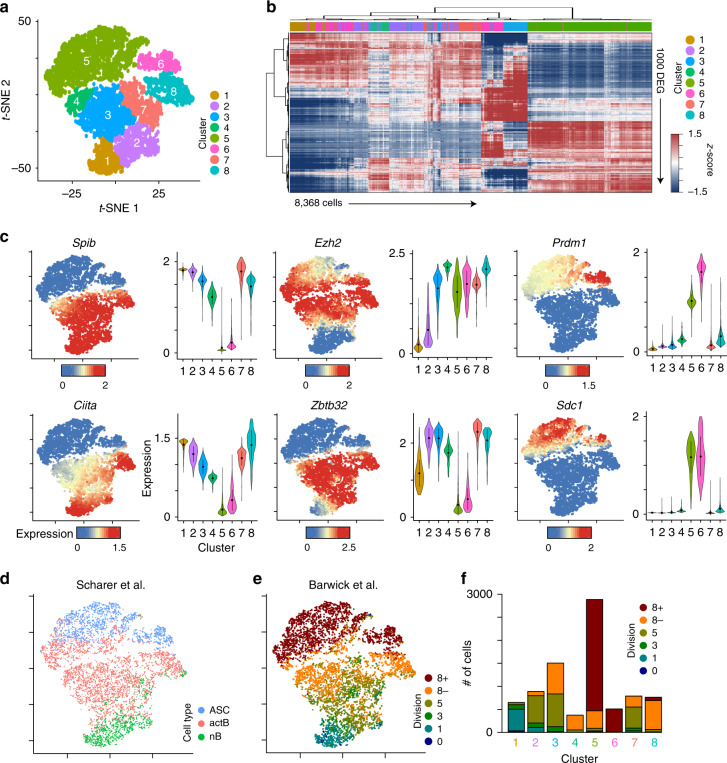
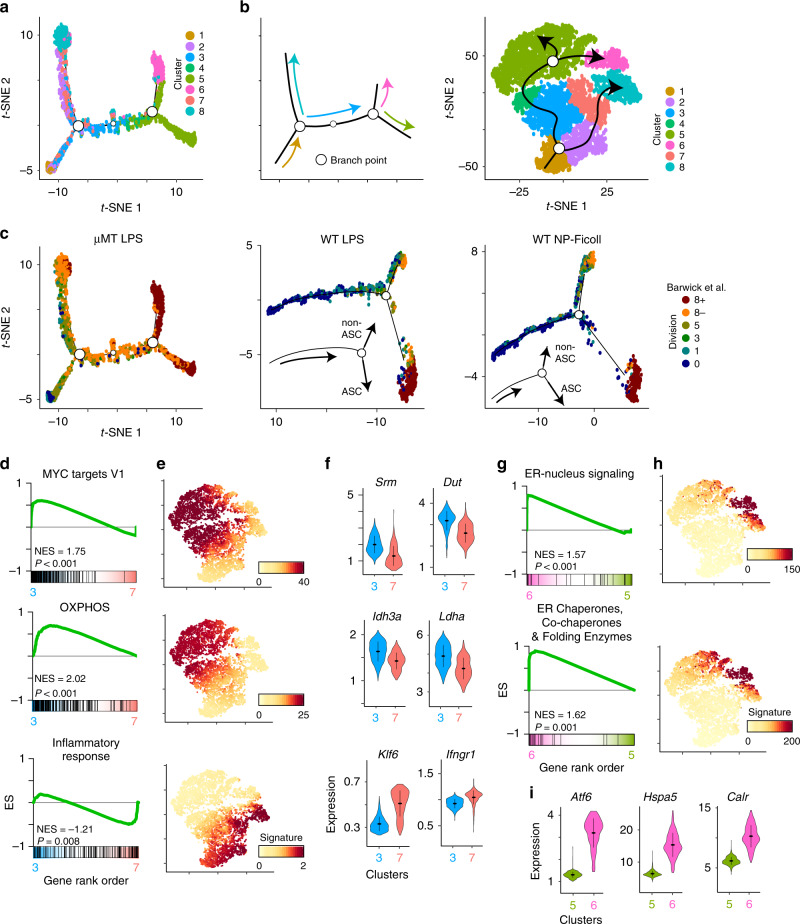
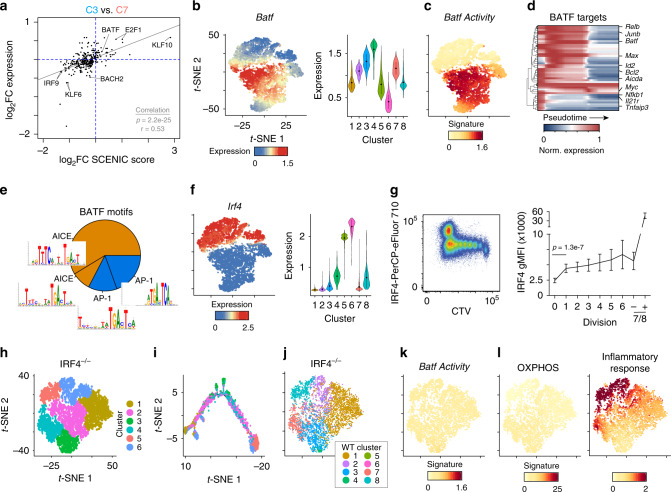
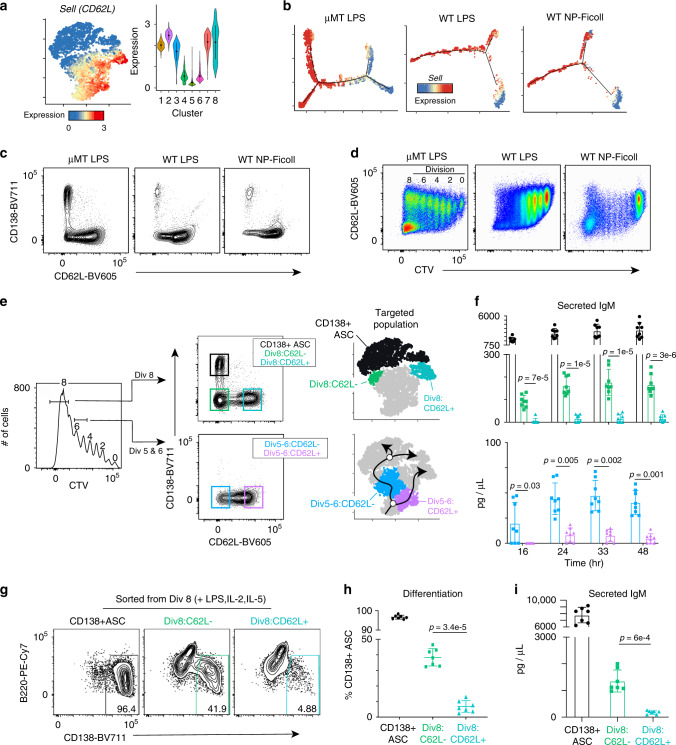
Upon stimulation, B cells assume heterogeneous cell fates, with only a fraction differentiating into antibody-secreting cells (ASC). Here we investigate B cell fate programming and heterogeneity during ASC differentiation using T cell-independent models. We find that maximal ASC induction requires at least eight cell divisions in vivo, with BLIMP-1 being required for differentiation at division eight. Single cell RNA-sequencing of activated B cells and construction of differentiation trajectories reveal an early cell fate bifurcation. The ASC-destined branch requires induction of IRF4, MYC-target genes, and oxidative phosphorylation, with the loss of CD62L expression serving as a potential early marker of ASC fate commitment. Meanwhile, the non-ASC branch expresses an inflammatory signature, and maintains B cell fate programming. Finally, ASC can be further subseted based on their differential responses to ER-stress, indicating multiple development branch points. Our data thus define the cell division kinetics of B cell differentiation in vivo, and identify the molecular trajectories of B cell fate and ASC formation.


Conflict of interest statement

The authors declare no competing interests.

Figures

Fig. 1
Fig. 1. Cell division mapping of ASC differentiation in vivo.
a Representative flow cytometry plots of B220 versus CD138 (top), CD138 versus CTV (middle), and CTV histograms (bottom) at the indicated time points following in vivo LPS inoculation. The percentage of total CD138+ cells is indicated in the top row. b Frequency of CD138+ cells at each division at 72 h. c Frequency of CD138+ cells at each time point. d Representative flow cytometry of CD138 versus CTV plots 72 h after μMT hosts were challenged with 50 μg (black), 0.5 μg (red), or 0.005 μg (green) of LPS. e Frequency of transferred cells at each division for each dose. Red or green asterisk indicates significance of P < 0.0001 between 50 versus 0.5 μg and 50 versus 0.005 μg, respectively, unless otherwise stated. f The percentage of total CD138+ cells is shown for samples from (e). g The percentage of division 8 cells that are CD138+ is shown for samples from (e). h Representative images of total Ig ELISPOTs on cells sorted from division 1–5, 6, or 8 (CD138 or CD138+) 72 h post LPS challenge from one mouse. i ELISPOTs from (h) were quantitated as the percentage of total cells plated that formed ASC. Data in (ac) are representative of three independent experiments containing 24 h (n = 5), 48 h (n = 4), 54 h (n = 4), 60 h (n = 6), and 72 h (n = 7) mice. Data in (dg) were derived from three independent experiments with 50 μg (n = 9), 0.5 μg (n = 6), and 0.005 μg (n = 7) mice. Data in (hi) were derived from two independent experiments from seven total mice. Data in (b, c, eg, i) represent mean ± SD. Statistical significance in (e) was determined by a two-way ANOVA with Tukey’s post test for multiple comparisons. Statistical significance for (c, f, g, i) was determined by one-way ANOVA with Tukey’s post test for multiple comparisons. Source data are provided as a Source Data file.
Fig. 2
Fig. 2. T-independent type I and II antigens reveal similar division requirements.
Representative flow cytometry of CD138 versus CTV plots (top) and CTV histograms (bottom) 72 h post immune challenge for a WT hosts challenged with 50 μg of LPS; b MYD88–/– hosts challenged with 50 μg of LPS; c WT hosts (left) or μMT hosts (right) challenged with 50 μg of NP-Ficoll. Black CTV histograms represent distribution of total transferred cells, while solid red CTV histograms represent CD138+ cells. Gating and percentage of CD138+ cells are indicated in the top row. Data in (a, c) for WT hosts are representative examples from three independent experiments and six total mice each. Data in (b) are representative of two independent experiments with six total mice. Data in (c) for μMT host are representative of two independent experiments with six total mice.
Fig. 3
Fig. 3. BLIMP-1-dependent transcriptional reprogramming is defective in division 8.
(a) Representative flow cytometry analysis of Prdm1fl/fl (Ctrl) and Cd19Cre/+Prdm1fl/fl (BcKO) B cells 72 h after LPS inoculation. (b) ERCC normalized total mRNA content for samples from the indicated divisions sorted from (a). c Bar plot showing the number of differentially expressed genes (DEG) for the indicated division between Ctrl and BcKO B cells. d Principal component analysis of samples from (b) using all DEG. The location of cells in each division is labeled. Circles denote 99% confidence intervals for samples in each division. e Bar plot of expression of select genes from divisions 0, 1, 3, 5, 8 and for Ctrl 8+. FPKM fragments per kilobase per million. Data in (b, e) represent mean ± SD and asterisk indicates statistical significance (FDR < 0.05) as determined by edgeR. Data were derived from 2 to 4 individual mice as follows: Ctrl division 0 (n = 2), 1 (n = 2), 3 (n = 3), 5 (n = 3), 8− (n = 2), and 8+ (n = 3); BcKO division 0 (n = 3), 1 (n = 4), 3 (n = 4), 5 (n = 4), 8− (n = 4). Source data are provided as a Source Data file.
Fig. 4
Fig. 4. scRNA-seq reveals a continuum of heterogeneous LPS-responding B cells.
at-SNE plot of 8368 WT cells responding to LPS showing eight distinct clusters of cells. b Heatmap showing hierarchical clustering of the top 1000 differentially expressed genes (DEG) between cells in each of the eight clusters from (a). Data represent z-score normalized MAGIC expression values. ct-SNE plot (left) from (a) and violin plots (right) for each cluster showing the MAGIC gene expression data for the indicated gene. For violin plots, the dots represent the mean and lines represent first and third quartile ranges. dt-SNE plot from (a) showing the annotation of each cell with naïve B cells (nB) and ex vivo differentiated activated B cells (actB) and ASC from Scharer et al.. et-SNE plot from (a) showing the annotation of each cell with division sorted LPS-responding B cells from Barwick et al.. f Bar plot quantitating the number of cells from each cluster annotated to specific divisions in (e). Data represent combined cells from two independent mice. Source data are provided as a Source Data file.
Fig. 5
Fig. 5. Pseudotime identifies divergent activated B-cell differentiation trajectories.
at-SNE plot of pseudotime ordered cells from Fig. 4a showing the location of cells from each cluster. Open circles denote pseudotime branch points. b Schematic showing the pseudotime order of cells from (a) (left) and from the t-SNE plot from Fig. 4a (right). c Pseudotime t-SNE plot from (a) (left) or from scRNA-seq data on adoptively transferred cells responding to LPS (middle) or NP-Ficoll (right) in WT hosts showing cells annotated based on division sorted LPS-responding B cells from Barwick et al. (see Fig. 4e and Supplementary Fig. 1). Circles denote pseudotime branch points. d GSEA of the indicated datasets comparing the transcriptional profile between cells in clusters 3 and 7. et-SNE plot showing mean MAGIC expression levels for all Leading Edge genes from the GSEA gene set in (d). f Violin plots showing MAGIC expression levels for cells in clusters 3 and 7 for the indicated genes. Genes were chosen from the adjacent GSEA gene set from (d). Within each violin plot, the dots represent mean MAGIC expression levels and lines represent first and third quartile ranges. g GSEA of the indicated datasets comparing the transcriptional profile of cells in clusters 5 and 6. ht-SNE plot showing mean MAGIC expression levels for all Leading Edge genes from the adjacent GSEA gene set in (g). The ER chaperones, co-chaperones, and folding enzymes gene set were described previously. i Violin plots of select genes representative of gene sets in (g). WT LPS and WT NP-Ficoll scRNA-seq data in (c) represent combined cells from two independent mice. Significance for GSEA was calculated by permutation testing with P < 0.001 indicating the gene set was enriched over all 1000 permutations. Source data are provided as a Source Data file.
Fig. 6
Fig. 6. IRF4 is critical for establishing the ASC-destined branch transcriptional program.
a Scatter plot showing the expression log2 fold change (log2FC) versus the log2FC in SCENIC activity score between cluster 3 versus 7 for each transcription factor. Gray line represents linear regression with significance determined by one-way ANOVA. Pearson’s r correlation is indicated. bt-SNE plot (left) from Fig. 4a and violin plot (right) showing the MAGIC gene expression data for the indicated gene. For violin plots, dots represent mean and lines represent first and third quartile ranges. ct-SNE plot showing mean MAGIC expression levels for BATF target genes determined by SCENIC. d Heatmap showing expression of 46 BATF target genes along pseudotime in WT cells. For each gene, the mean MAGIC expression level is normalized to the maximal value. e Pie chart representing the percentage of BATF target genes containing either the canonical AP-1 or composite IRF:AP-1 (AICE) motif. ft-SNE plot (left) and violin plot (right) showing the MAGIC gene expression data for the indicated gene. For violin plots, the dots represent mean and lines represent first and third quartile ranges. g Representative flow cytometry (left) and geometric mean fluorescence intensity at each cell division (right) for intracellular staining of IRF4 levels versus CTV in LPS-responding B cells 72 h after LPS inoculation. Division 7/8 cells are subdivided into CD138 negative (−) and positive (+). Data represent mean ± SD and statistical significance determined by two-tailed Student’s t test. Data represent two independent experiments of nine mice. ht-SNE plot of 6903 Cd19Cre/+Irf4fl/fl (IRF4–/–) cells responding to LPS showing the location of six distinct cell clusters. Data represent combined cells from two independent mice. it-SNE plot of pseudotime ordered cells from (h) showing the location of cells from each cluster. jt-SNE plot from (h) showing the annotation of each cell with a WT cluster from Fig. 4a. kt-SNE plot from (h) showing mean MAGIC expression levels for BATF target genes as in (c). lt-SNE plot from (h) showing mean MAGIC expression for Leading Edge genes from the indicated gene set (see Fig. 5e). Source data are provided as a Source Data file.
Fig. 7
Fig. 7. Loss of CD62L (L-selectin) delineates cells on the ASC-destined branch.
at-SNE plot (left) from Fig. 4a and violin plot (right) for each cluster showing the MAGIC gene expression data for Sell (CD62L) in WT cells. For violin plots, the dots represent mean and lines represent first and third quartile ranges. bSell expression projected along pseudotime for each scRNA-seq dataset (see Fig. 5c). c Representative flow cytometry plot of CD138 versus CD62L for adoptively transferred cells from μMT hosts challenged with 50 μg of LPS (left), WT hosts challenged with 50 μg of LPS (middle), or WT hosts challenged with 50 μg of NP-Ficoll (right). All plots are 72 h after challenge. d Representative flow cytometry plot of CD62L versus CTV for each adoptive transfer setup described in (c). The division number is indicated in the left panel. e Representative FACS strategy for isolating ASC in clusters 5 and 6 (CD62LCD138+ cells), ASC-destined cells in cluster 4 (div8:CD62LCD138), non-ASC-destined cells in cluster 8 (div8:CD62L+CD138), ASC-destined cells in cluster 3 (CD62LCD138), and non-ASC-destined cells in cluster 2 (CD62L+CD138). Cells were gated on division 5, 6, or 8 and then separated by CD138 and CD62L expression 72 h post LPS challenge. f IgM titers in culture over time for the indicated samples from division 8 (top) and divisions 5 and 6 (bottom). g Representative flow cytometry plot of B220 versus CD138 expression after 16 h of culture with LPS, IL-2, and IL-5 for the indicated samples. Percent of CD138+ ASC is indicated. h Percent of CD138+ cells and i IgM titers in culture for each sample. Data in (f, h, i) represent mean ± SD. Statistical significance in (f, h, i) was determined by paired two-tailed Student’s t tests. Data in (f) represent two independent experiments with a total of eight mice; data in (gi) represent two independent experiments with a total of seven mice. Source data are provided as a Source Data file.

References

    1. Tangye SG, Hodgkin PD. Divide and conquer: the importance of cell division in regulating B-cell responses. Immunology. 2004;112:509–520. - PMC - PubMed
    1. Jelinek DF, Lipsky PE. The role of B cell proliferation in the generation of immunoglobulin-secreting cells in man. J. Immunol. 1983;130:2597–2604. - PubMed
    1. Heinzel S, Marchingo JM, Horton MB, Hodgkin PD. The regulation of lymphocyte activation and proliferation. Curr. Opin. Immunol. 2018;51:32–38. - PubMed
    1. Hasbold J, Corcoran LM, Tarlinton DM, Tangye SG, Hodgkin PD. Evidence from the generation of immunoglobulin G-secreting cells that stochastic mechanisms regulate lymphocyte differentiation. Nat. Immunol. 2004;5:55–63. - PubMed
    1. Duffy KR, et al. Activation-induced B cell fates are selected by intracellular stochastic competition. Science. 2012;335:338–341. - PubMed

Publication types

MeSH terms

LinkOut - more resources