. 2020 Aug 10;11(1):3987.
doi: 10.1038/s41467-020-17764-7.

Developmental potential of aneuploid human embryos cultured beyond implantation

Affiliations

Developmental potential of aneuploid human embryos cultured beyond implantation

Marta N Shahbazi et al. Nat Commun. .

Abstract

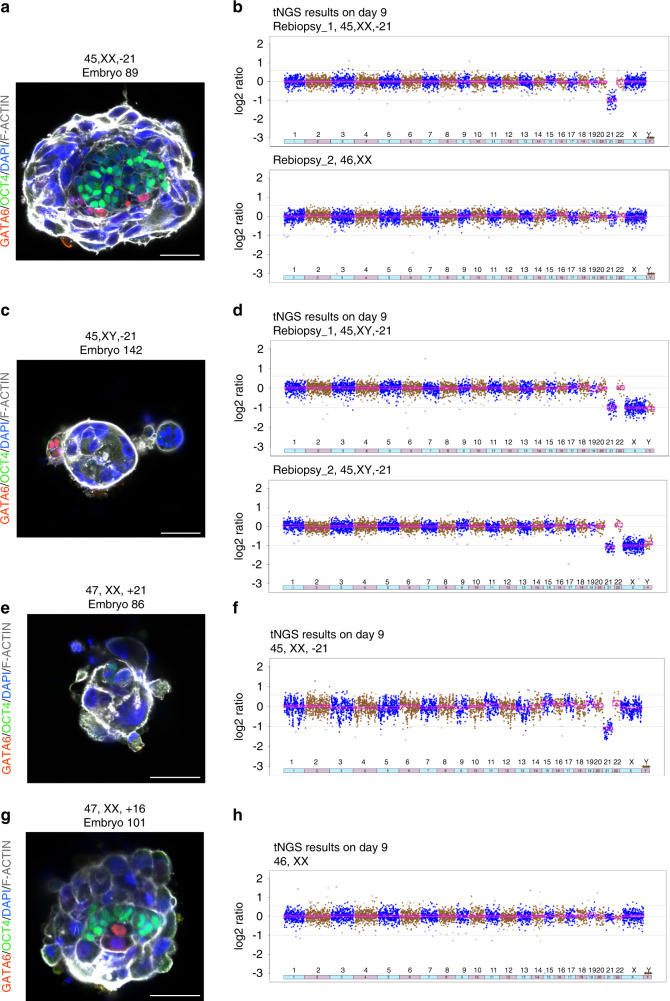
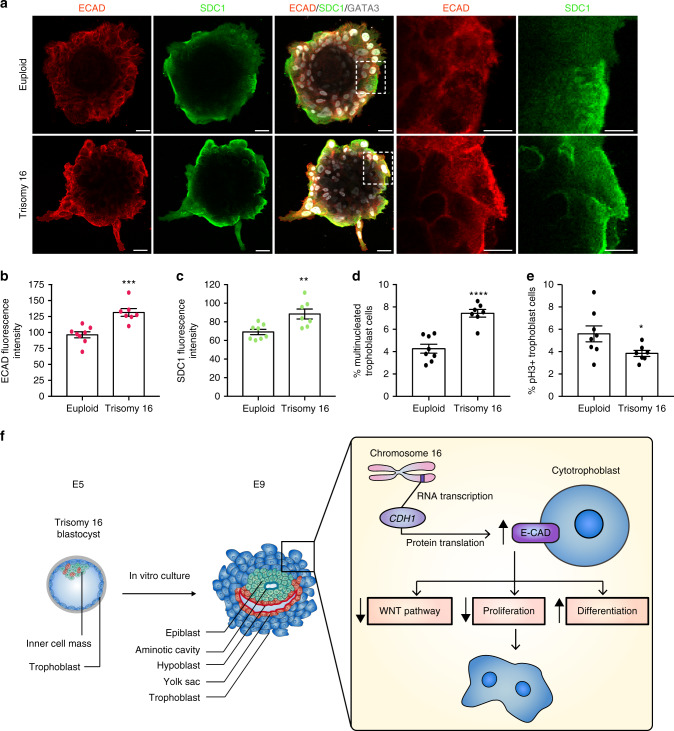
Aneuploidy, the presence of an abnormal number of chromosomes, is a major cause of early pregnancy loss in humans. Yet, the developmental consequences of specific aneuploidies remain unexplored. Here, we determine the extent of post-implantation development of human embryos bearing common aneuploidies using a recently established culture platform. We show that while trisomy 15 and trisomy 21 embryos develop similarly to euploid embryos, monosomy 21 embryos exhibit high rates of developmental arrest, and trisomy 16 embryos display a hypo-proliferation of the trophoblast, the tissue that forms the placenta. Using human trophoblast stem cells, we show that this phenotype can be mechanistically ascribed to increased levels of the cell adhesion protein E-CADHERIN, which lead to premature differentiation and cell cycle arrest. We identify three cases of mosaicism in embryos diagnosed as full aneuploid by pre-implantation genetic testing. Our results present the first detailed analysis of post-implantation development of aneuploid human embryos.


Conflict of interest statement

A.P. is shareholder of IVI-RMA and DIBIMED. E.S. is a consultant for and receives research funding from the Foundation for Embryonic Competence. The remaining authors declare no competing interests.

Figures

Fig. 1
Fig. 1. Preimplantation development of aneuploid human embryos.
a Prevalence of individual single chromosome aneuploidies among all embryos with single chromosome aneuploidy (n = 9,429 embryos). b Odds ratios of embryos developing to the blastocyst stage by day 6 rather than day 5 for single chromosome gain or loss (n = 9,429 embryos) as compared to euploid embryos (n = 25,368). Error bars represent 95% profile likelihood confidence intervals. Blue line represents odds for euploid embryos. Confidence intervals, p values and the specific number of embryos analyzed per genotype is shown in the Source Data file. c Odds ratios of embryos having a higher day 5 expansion score for single chromosome gain or loss (n = 9,429 embryos) as compared to euploid embryos (n = 25,368). Error bars are 95% profile likelihood confidence intervals. Blue line represents odds for euploid embryos. Orange bar represents gain of chromosome (trisomy) while cyan bar represents loss of chromosome (monosomy). Confidence intervals, p values and the specific number of embryos analyzed per genotype is shown in the Source Data file. *p < 0.05, **p < 0.01, ***p < 0.001. Source data are provided as a Source Data file.
Fig. 2
Fig. 2. Early post-implantation development of aneuploid human embryos.
a Schematic representation of the methodology used in this study. b Immunostaining of human embryos cultured until day 9. Representative images of each karyotype are shown. Scale bars, 50 μm. c Developmental phenotypes of embryos from panel (b). The number of embryos per category is indicated. Chi-square test, **p = 0.0018, *p = 0.0105, ns nonsignificant. d Total number of cells in embryos with all lineages from panel (b). Each dot represents an individual embryo. n = 10 euploid, 6 trisomy 21, 13 trisomy 15, 15 trisomy 16 and 7 monosomy 21 embryos. One-way ANOVA with a multiple comparisons test, **p = 0.0011 (trisomy 16) and **p = 0.0027 (monosomy 21). eg, Number of epiblast (e), hypoblast (f), and trophoblast (g) cells in embryos with all lineages from panel (b). Each dot represents an individual embryo, with green for epiblast, red for hypoblast and blue for trophoblast cell counts. n = 10 euploid, 6 trisomy 21, 13 trisomy 15, 15 trisomy 16 and 7 monosomy 21 embryos. One-way ANOVA with a multiple comparisons test, **p = 0.0015, ***p = 0.0005, ns nonsignificant. All error bars represent s.e.m. four independent experiments. ICM inner cell mass, tNGS targeted next generation sequencing, IVC in vitro culture. Source data are provided as a Source Data file.
Fig. 3
Fig. 3. Chromosome copy number analysis of post-implantation embryos cultured in vitro until day 9.
a Immunostaining of mosaic monosomy 21 embryo (#89, diagnosed as monosomy 21 on day 5) showed normal development of hypoblast and epiblast with limited development of trophoblast. b Chromosome copy number analysis from two of the three dissections of the fixed embryo (#89) consistent with mosaic monosomy 21. c Immunostaining of arrested monosomy 21 embryo (#142, also diagnosed as monosomy 21 on day 5). d Chromosome copy number analysis from the dissections of the fixed dissected embryo (#142) confirmed the previous PTG-A result from day 5 embryo biopsy (45,XX,−21). e Immunostaining of a mosaic trisomy 21 and monosomy 21 embryo (#86, diagnosed as trisomy 21 on day 5) showed arrested development. f Chromosome copy number analysis showed the presence of monosomy 21 cells. g Immunostaining of a euploid day 9 human embryo (#101, diagnosed as trisomy 16 on day 5). h Chromosome copy number analysis was consistent with euploidy. All scale bars, 50 μm. tNGS targeted next-generation sequencing.
Fig. 4
Fig. 4. Characterization of ECAD-overexpressing human TSCs and ESCs.
a Immunostaining of human TSCs transfected with a CDH1-EGFP expressing plasmid. ECAD expression is triggered upon 1 µg mL−1 DOX addition. b Quantification of GATA3 levels in cells from panel (a). n = 2,052, 589, 285, and 136 cells per condition. Kruskal Wallis test, ****p < 0.0001. Data are shown in a box plot. Whiskers go from minimum to maximum values. The box extends from the 25th to 75th percentile, and the middle line represents the median. c Percentage of phospho-HISTONE H3 (pH3) positive cells in cells from panel (a). n = 2,789, 805, 156, and 183 cells per condition. Chi-square test, *p = 0.018. d RT-PCR analysis of SDC1, HLA-G, and AXIN2 levels in human TSCs that were/were not transfected with a CDH1-EGFP expressing plasmid in the presence or absence of 1 µg mL−1 DOX. Each dot represents one sample. n = 4 samples per condition. One-way ANOVA with a multiple comparisons test, *p < 0.0479, **p = 0.0022. Error bars represent s.e.m. e Immunostaining of human ESCs transfected with a CDH1-EGFP expressing plasmid. ECAD expression is triggered upon DOX addition. f Quantification of NANOG levels in cells from panel (e). n = 2,980, 803, 1,080, and 1,829 cells per condition. Kurskal Wallis test, ns nonsignificant. Data are shown in a box plot. Whiskers go from minimum to maximum values. The box extends from the 25th to 75th percentile, and the middle line represents the median. g Percentage of phospho-HISTONE H3 (pH3) positive cells in cells from panel (e). n = 3,091, 717, 1,497, and 2,243 cells per condition. Chi-square test, ****p < 0.0001. h RT-PCR analysis of NANOG, OCT3/4, and AXIN2 levels in human ESCs that were/were not transfected with a CDH1-EGFP expressing plasmid in the presence or absence of 1 µg mL−1 DOX. Each dot represents one sample. n = 4 samples per condition. One-way ANOVA with a multiple comparisons test, ns nonsignificant. All error bars represent s.e.m. three independent experiments (panels ac, eg) and two independent experiments (panels d and h). All scale bars, 50 μm. Source data are provided as a Source Data file.
Fig. 5
Fig. 5. Role of ECAD during trophoblast differentiation.
ac RT-PCR analysis of CDH1, SDC1, and HLA-G levels in human TSCs transfected with a CDH1-EGFP expressing plasmid in the presence or absence of 10 ng mL−1 DOX. Each dot represents one sample. n = 3 samples for −DOX and 4 samples for 10 ng mL−1 DOX. Unpaired Student’s t test, CDH1 *p = 0.0131. SDC1 *p = 0.0357. HLA-G *p = 0.0634. d Immunostaining of human TSCs transfected with CDH1-EGFP expressing plasmid in the presence or absence of 10 ng mL−1 DOX. n = 4 samples per condition. e Percentage of phospho-HISTONE H3 (pH3)-positive cells, SDC1-positive cells, and multinucleated cells in human TSCs transfected with a CDH1-EGFP expressing plasmid in the presence or absence of 10 ng mL−1 DOX. n = 743 and 1,675, 1,407 and 2,752, and 2,132 and 3,707 cells for each condition. Chi-square test, PH3+ ***p = 0.00321, SDC1+ ****p = 0.0001, multinucleated ****p < 0.0001. f Quantification of relative GATA3 fluorescence from (d). n = 4,424 and 2,120 per condition. Unpaired Student’s t test, ****p < 0.0001. g RT-PCR of CDH1 in cells transfected with control or CDH1 siRNA. Each dot represents one sample. n = 4 samples for control siRNA and five samples fo CDH1 siRNA. Unpaired Student’s t test, ****p = 0.00000170. h Immunostaining of human TSCs transfected with control or CDH1 siRNA. i Quantification of relative GATA3 levels from panel (h). n = 1,772 and 1,856 cells per condition. Unpaired Student’s t test, ns nonsignificant, p = 0.331. j, k RT-PCR of SDC1, HLA-G, AXIN2, GATA3, TP63, and ELF5 in cells transfected with control or CDH1 siRNA. Each dot represents one sample. n = 4 samples for control siRNA and 5 samples fo CDH1 siRNA. Unpaired Student’s t test, ns nonsignificant. All error bars represent s.e.m. Scale bars, 50 µm two independent experiments (panels a, b, c, h, and i) and three independent experiments (panels d, e, g, j, and k). Source data are provided as a Source Data file.
Fig. 6
Fig. 6. Trophoblast characterization in trisomy 16 embryos.
a Immunostaining of euploid and trisomy 16 embryos. Representative images of each karyotype are shown. Squares denote magnified areas. Scale bars, 50 μm. b, c Quantification of ECAD (b) and SDC1 (c) levels in embryos from panel (a). Each dot represents an individual embryo. n = 8 euploid and 7 trisomy 16 embryos. Unpaired Student’s t test, **p = 0.0055, ***p = 0.0005. d Percentage of multinucleated trophoblast cells in embryos from panel (a). Each dot represents an individual embryo. n = 8 euploid and 7 trisomy 16 embryos. Unpaired Student’s t test, ****p < 0.0001. e Percentage of phospho-HISTONE H3 (pH3) positive cells in embryos from panel (a). Each dot represents an individual embryo. n = 8 euploid and 7 trisomy 16 embryos. Unpaired Student’s t test, *p = 0.0474. f Mechanistic model of trisomy 16 embryo development beyond the blastocyst stage. All error bars represent s.e.m. Source data are provided as a Source Data file.

References

    1. van den Berg MM, van Maarle MC, van Wely M, Goddijn M. Genetics of early miscarriage. Biochim. Biophys. Acta. 2012;1822:1951–1959. - PubMed
    1. Ljunger E, Cnattingius S, Lundin C, Anneren G. Chromosomal anomalies in first-trimester miscarriages. Acta Obstet. Gynecol. Scand. 2005;84:1103–1107. - PubMed
    1. Strom CM, et al. Analyses of 95 first-trimester spontaneous abortions by chorionic villus sampling and karyotype. J. Assist. Reprod. Genet. 1992;9:458–461. - PubMed
    1. Martinez MC, et al. Cytogenetic analysis of early nonviable pregnancies after assisted reproduction treatment. Fertil. Steril. 2010;93:289–292. - PubMed
    1. Vanneste E, et al. Chromosome instability is common in human cleavage-stage embryos. Nat. Med. 2009;15:577–583. - PubMed

Publication types

MeSH terms

Supplementary concepts