. 2020 Sep;26(9):1392-1397.
doi: 10.1038/s41591-020-0966-5. Epub 2020 Aug 10.

The role of exome sequencing in newborn screening for inborn errors of metabolism

Affiliations

The role of exome sequencing in newborn screening for inborn errors of metabolism

Aashish N Adhikari et al. Nat Med. 2020 Sep.

Abstract

Public health newborn screening (NBS) programs provide population-scale ascertainment of rare, treatable conditions that require urgent intervention. Tandem mass spectrometry (MS/MS) is currently used to screen newborns for a panel of rare inborn errors of metabolism (IEMs)1-4. The NBSeq project evaluated whole-exome sequencing (WES) as an innovative methodology for NBS. We obtained archived residual dried blood spots and data for nearly all IEM cases from the 4.5 million infants born in California between mid-2005 and 2013 and from some infants who screened positive by MS/MS, but were unaffected upon follow-up testing. WES had an overall sensitivity of 88% and specificity of 98.4%, compared to 99.0% and 99.8%, respectively for MS/MS, although effectiveness varied among individual IEMs. Thus, WES alone was insufficiently sensitive or specific to be a primary screen for most NBS IEMs. However, as a secondary test for infants with abnormal MS/MS screens, WES could reduce false-positive results, facilitate timely case resolution and in some instances even suggest more appropriate or specific diagnosis than that initially obtained. This study represents the largest, to date, sequencing effort of an entire population of IEM-affected cases, allowing unbiased assessment of current capabilities of WES as a tool for population screening.


Figures

Extended Data Fig. 1
Extended Data Fig. 1. Metrics for WES reads and coverage.
a, Percentage of reads unmapped to the reference genome. b, Percentage of high quality read pairs (MQ > 20), without duplicates and properly paired. c, Percentage of duplicates in the reads across three sequencing batches d-e, Number of reads and high quality reads plotted batchwise. f, Inferred insert sizes plotted batchwise. g, Median coverage across Nimblegen capture region plotted batchwise h, Median coverage across 78 genes region plotted batchwise. i, Median fraction of capture covered at coverage depths of 1x to 30x plotted batchwise. j, Median fraction of 78 genes region covered at coverage depths of 1x to 30x plotted batchwise. In figures a-f and i-j, individual sample values are plotted, and adjacent box plots display the median (red) and interquartile ranges for the dataset, whiskers extend to the last data point within 1.5 times the interquartile range. The sample sizes for the boxplots in a-h were: batch1 (n = 180), batch2 (n = 292), batch3 (n = 744). Violin plots superimposed on the box plots show the data density and mean value (blue).
Extended Data Fig. 2
Extended Data Fig. 2. DNA damage related metrics for the three sequencing batches.
a, b, Fraction of reads with 0 (green), 1 (yellow), 2 (orange), and ≥3 (red) mismatches with reference genome considering (a) all bases of the reads and (b) first 100 bases of the reads. Batches 1 and 2 had read lengths of 101 bases and batch 3 had read length of 151 bases. All three batches had similar mismatch rates when only the first 100 bases were considered. c, Nucleotide mismatches by base change (NMBC) in the 1,216 samples plotted batch wise. d, Frequencies of all single nucleotide changes by base type in high quality SNVs in the 1,216 samples plotted batchwise. High quality SNVs from the VCF calls defined as marked PASS by GATK VQSR algorithm and with GQ ≥ 30. In both c and d, box plots display the median and interquartile ranges for the dataset, whiskers extend to the last data point within 1.5 times the interquartile range and outliers beyond this are marked with circles. The sample sizes for the boxplots were batch1 (n = 180), batch2 (n = 292), batch3 (n = 744).
Extended Data Fig. 3
Extended Data Fig. 3. Variant related quality metrics for 1,216 samples plotted batch wise.
a, Confident sites across capture (from the GVCF file) b, Confident sites across 78 genes (from the GVCF file) c, Common high quality SNVs d, Rare high quality SNVs e, Common high quality indels f, Rare high quality indels g, Transition/Transversion ratios for high quality common SNVs h, Transition/Transition ratios for high quality rare SNVs. High quality variants are those marked as PASS by GATK VQSR and have GQ ≥ 30. Common variants have a frequency greater than 0.001 in 1000 Genomes Project phase 3 database and rare variants have a frequency less than 0.001 in the database. Individual sample values are plotted and adjacent box plots display the median (red) and interquartile ranges for the dataset, whiskers extend to the last data point within 1.5 times the interquartile range. Violin plots superimposed on the box plots show the data density and mean value (blue). The sample sizes for the boxplots were batch1 (n = 180), batch2 (n = 292), batch3 (n = 744).
Extended Data Fig. 4
Extended Data Fig. 4. Example showing variability of gene coverage in two IEM genes in the study across 1,216 samples.
MCCC2, top, has poor coverage in the first exon across all samples. In contrast, ACADM, bottom, has good coverage across the gene. The blue vertical lines indicate positions with known pathogenic variants in HGMD and ClinVar. Plot of log10 of the median, 20th percentile and minimum coverage for each coding exon across all samples for a given sample set. Dark grey: Median coverage, medium grey: 20th percentile coverage, light grey: minimum coverage for each position. Coverage quality of each exon is indicated by colored blocks beneath the exon. Coverage quality of each exon is indicated by colored blocks beneath the coverage plot. Red: Greater than 15% of exon has less than 10x median coverage; green: 95% of the exon has minimum 20x coverage. UTRs that are part of the coding exons have a smaller indicator thickness. Regions of the exon that overlap with the capture array are indicated in blue just below the coverage plot. Exon scale in bases is shown in each plot.
Extended Data Fig. 5
Extended Data Fig. 5. Alternative pipelines derived from the final exome analysis pipeline to explore sensitivity-specificity tradeoffs.
We created several alternate pipelines, altering or truncating different parts of the final exome analysis pipeline to probe contributions to overall sensitivity and specificity from various components of the pipeline. For each pipeline, the overall sensitivity and specificity on the NBSeq test set are shown. a, Final exome analysis pipeline b-i) Alternatives: b) Altering final pipeline by considering every CNV call homozygous c-e) Truncating the CNV arm, curation arm and predicted impact arm, respectively. f-g, Retaining the predicted impact arm or curation arm only, respectively h) Retaining only the rare pathogenic HGMD & ClinVar databases i) Allowing multiple gene calls for each sample if more than one gene predicted.
Extended Data Fig. 6
Extended Data Fig. 6. Distribution of variants reported by the exome analysis pipeline in the NBSeq test set.
a, Number of different variant types reported by the pipeline in IEM-affected individuals in genes associated with their IEMs the NBSeq test set (n = 674 individuals). b, Distribution of the types of variants responsible for the predictions of disease status in the 571 affected individuals correctly identified by the exome analysis pipeline.
Extended Data Fig. 7
Extended Data Fig. 7. Whole genome sequencing confirms potential IVDdeletions in two individuals diagnosed with isovaleric acidemia initially missed in exome.
In two cases where we performed WGS upon follow up of an exome false negative, we identified large deletions in the associated IVD gene. The WGS read alignments in the genomic region spanning the IVD is shown on the right for the two cases. The first case had almost no coverage in the region spanning the first three exons of IVD. The second case had almost no coverage of exon 12 of IVD along with low coverage across the whole gene. The first case had 11 split reads spanning the deleted region confirming the deletion event of the first three exons.
Extended Data Fig. 8
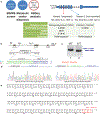
Extended Data Fig. 8. Experimental splicing assay of a potentially pathogenic intronic variant in an exome false negative case.
a, In an individual affected with MCADD, the exome analysis pipeline reported only a single rare nonsynonymous variant. A second rare intronic variant 14 bases from the splice site (NM_000016.4:c.388–14A>G) was a suspected pathogenic modification of the branchpoint A nucleotide. b, Diagram of the heterologous HBB splicing reporter construct containing the wild type ACADM sequence or the c.388–14A>G variant. c, RT-PCR analysis of reporter transcripts from wild type or mutant (lanes 1 and 2, respectively) reporter plasmids expressed in HEK293T cells (amplicons resolved by 12% PAGE and stained with SYBR Gold). The two spliced products are shown to the right of the gel image. The experiments were performed three times independently with similar results. d, Chromatograms corresponding to the sequence spliced junctions between HBB exon 1 and the wild type or mutant ACADM exon 6 constructs (left and right panel, respectively). e, Open reading frame of aberrant ACADM mRNA containing a 13 nt extension of exon 6 (red), resulting in a premature termination codon (PTC, *). Top, DNA sense strand; middle, predicted polypeptide; bottom, DNA reverse complement.
Extended Data Fig. 9
Extended Data Fig. 9. Stratification of IEM-affected and MS/MS false positives by alleles reported by the exome analysis pipeline for NPV estimation of NPV of exome as a follow-up test after a positive MS/MS screen.
For six MS/MS screens (VLCADD, PKU, LCHADD/TFP, IVA, MSUD, and GA-II), IEM-affected and MS/MS false positive cases in the NBSeq test set are stratified by the number of alleles reported by the exome analysis pipeline in the genes associated with those screens.
Extended Data Fig. 10
Extended Data Fig. 10. Zygosity distribution of variants reported by the pipeline in relevant gene(s).
For each IEM, bars show the zygosity distribution of the variants in relevant genes reported by the exome pipeline for the 674 IEM-affected cases from the test set. The numbers of cases correctly identified by the pipeline are broken down into those that had homozygous variants in relevant gene(s) (dark blue) and those that had two heterozygous variants in relevant genes(s) (orange). The number of cases that failed to be identified by the pipeline are broken down into those that had one heterozygous variant in relevant gene(s) (light blue) and those that had no reported variants in the relevant gene(s) (dark red). Left, core IEMs screened by California; right, secondary/add-on IEMs. IEMs sharing a common causative gene were not distinguished by the exome predictions alone. These included TFP and LCHADD (blue shading), PKU and hyperphenylalaninemia (pink shading), and the various MMA subtypes (yellow shading).
Fig. 1.
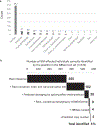
Fig. 1.. Low positive predictive value and complex differential diagnoses of MS/MS newborn screening for glutaric acidemia (GA-I).
Among 1,254 cases with positive GA-I MS/MS screen (California, July, 2005 through December, 2013), only 130 were ultimately diagnosed with any IEM. Of these 130, only 43 actually had a diagnosis of GA-I, while the rest had other IEMs, including medium chain acyl-CoA dehydrogenase deficiency (MCADD), long-chain 3-hydroxy acyl-CoA dehydrogenase deficiency (LCHADD), methylmalonic acidemia (MMA), carnitine palmitoyl transferase deficiency type II (CPT2D), medium/short-chain 3-hydroxyacyl-CoA dehydrogenase deficiency (M/SCHADD), multiple acyl-CoA dehydrogenase deficiency (MADD), short chain acyl-CoA dehydrogenase deficiency (SCADD), carnitine-acylcarnitine translocase deficiency (CACTD), other fatty acid oxidation disorder (FAOD). The GA-I MS/MS screen is based on elevations of glutaryl carnitine (C5DC), along with informative ratios. During the early part of the study, a derivatized method was used, in which hydroxydecanoyl carnitine (C10OH) had the same mass to charge ratio as C5DC. After the methodology was switched to use underivatized metabolites, it became hydroxyhexanoyl carnitine (C6OH) that was coincident with C5DC.
Fig. 2.
Fig. 2.. Whole exome pipeline design and analysis.
a) Diagram of pipeline for analysis. For each exome, the pipeline considered only variants with genotype quality (GQ) >15 that impacted principal transcripts (per annotation of principal and alternative splice isoforms, APPRIS) for 78 genes associated with currently screened inborn errors of metabolism (IEMs). Variants were identified through any of three arms. Left, predicted impact, included variants with population MAF <0.5% in both 1000 Genomes and ExAC and i) predicted protein alteration (stop gain or loss, frameshift insertion or deletion, alteration of canonical splice motif, nonsynonymous missense, in-frame insertion or deletion, start gain or loss); ii) Combined Annotation Dependent Depletion (CADD) score >23; and iii) predicted splicing variants (determined by database of splicing consensus single nucleotide variant, dbscSNV, labeled RF) with meta prediction score >0.5. Center, curation, included variants with MAF <0.1% annotated as disease mutation (DM) or questionable disease mutation (DM?) in HGMD or as pathogenic/likely pathogenic by ClinVar with at least 1 expert review. Among HGMD DM/DM? or ClinVar pathogenic/likely pathogenic variants with MAF ≥0.1% (n=60), 19 were considered reportable and 41 were excluded (Supplementary Table 2). Right, predicted CNV (XHMM) applied to IEM genes except three with common intragenic deletions (ETFA, HCFC1, PRODH). For variants in X chromosome genes(*), the MAF threshold was adjusted to 0.02%. For genes with ≥1 heterozygous variant, local phasing was performed when reads overlapped the multiple variant positions. Finally, variants annotated as benign in ClinVar with at least 2 review stars were excluded. From the list of resulting variants, the corresponding genes with ≥1 homozygous or ≥2 heterozygous variants were reported. Exceptions(**) were X-linked ornithine transcarbamylase, for which ≥1 flagged, heterozygous OTC gene variant was reported, since heterozygous females can display a clinical phenotype; and methionine adenosyltransferase-1A, for which heterozygous variant MAT1A NP_000420.1:p.Arg264His causes autosomal dominant disease. For each case, a single gene was chosen as the likely disease causing gene by a score incorporating IEM prevalence and variant severity (Methods). b) Contributions from components of the pipeline in identifying variants in the test set of exomes from 674 IEM-affected infants. Of the 571 cases correctly identified by the pipeline, 360 had only rare HGMD/ClinVar curated variants, while the rest required additional curation or predictions. Of the 103 cases missed by exomes, the pipeline reported a single autosomal heterozygous variant in 53 in a gene consistent with the disorder, and no variants in 50. c) Sensitivity of exome pipeline by disorder for the 674 IEM-affected cases from the test set. For each IEM, the numbers of individuals correctly identified by exomes are shown by green bars and the number missed by exomes shown by brown bars, with sensitivity for each IEM disorder shown in parentheses. Left, core IEMs screened by California; right, secondary/add-on IEMs. IEMs sharing a common causative gene were not distinguished by the exome predictions alone. These included TFP and LCHAD (blue shading), PKU and hyperphenylalaninemia (pink shading), and the various MMA subtypes (yellow shading).

Similar articles

Cited by

References

    1. Hall PL, et al. Postanalytical tools improve performance of newborn screening by tandem mass spectrometry. Genet Med 16, 889–895 (2014). - PMC - PubMed
    1. Mak CM, Lee HC, Chan AY & Lam CW Inborn errors of metabolism and expanded newborn screening: review and update. Crit Rev Clin Lab Sci 50, 142–162 (2013). - PubMed
    1. McHugh D, et al. Clinical validation of cutoff target ranges in newborn screening of metabolic disorders by tandem mass spectrometry: a worldwide collaborative project. Genet Med 13, 230–254 (2011). - PubMed
    1. Wilcken B, Wiley V, Hammond J & Carpenter K Screening newborns for inborn errors of metabolism by tandem mass spectrometry. N Engl J Med 348, 2304–2312 (2003). - PubMed
    1. Tang H, et al. Damaged goods?: an empirical cohort study of blood specimens collected 12 to 23 hours after birth in newborn screening in California. Genet Med 18, 259–264 (2016). - PubMed

References (Methods only)

    1. Rodriguez JM, et al. APPRIS: annotation of principal and alternative splice isoforms. Nucleic Acids Res 41, D110–117 (2013). - PMC - PubMed
    1. Kircher M, et al. A general framework for estimating the relative pathogenicity of human genetic variants. Nat Genet 46, 310–315 (2014). - PMC - PubMed
    1. Jian X, Boerwinkle E & Liu X In silico prediction of splice-altering single nucleotide variants in the human genome. Nucleic Acids Res 42, 13534–13544 (2014). - PMC - PubMed
    1. Fromer M, et al. Discovery and statistical genotyping of copy-number variation from whole-exome sequencing depth. Am J Hum Genet 91, 597–607 (2012). - PMC - PubMed
    1. Chamberlin ME, Ubagai T, Mudd SH, Levy HL & Chou JY Dominant inheritance of isolated hypermethioninemia is associated with a mutation in the human methionine adenosyltransferase 1A gene. Am J Hum Genet 60, 540–546 (1997). - PMC - PubMed

Publication types