

doi: 10.1038/s41592-020-0925-6.
Epub 2020 Aug 10.
Time-resolved cryo-EM using Spotiton
Affiliations
- PMID: 32778833
- PMCID: PMC7799389
- DOI: 10.1038/s41592-020-0925-6
Item in Clipboard
Time-resolved cryo-EM using Spotiton
Nat Methods.
2020 Sep.
Abstract
We present an approach for preparing cryo-electron microscopy (cryo-EM) grids to study short-lived molecular states. Using piezoelectric dispensing, two independent streams of ~50-pl droplets of sample are deposited within 10 ms of each other onto the surface of a nanowire EM grid, and the mixing reaction stops when the grid is vitrified in liquid ethane ~100 ms later. We demonstrate this approach for four biological systems where short-lived states are of high interest.
Figures
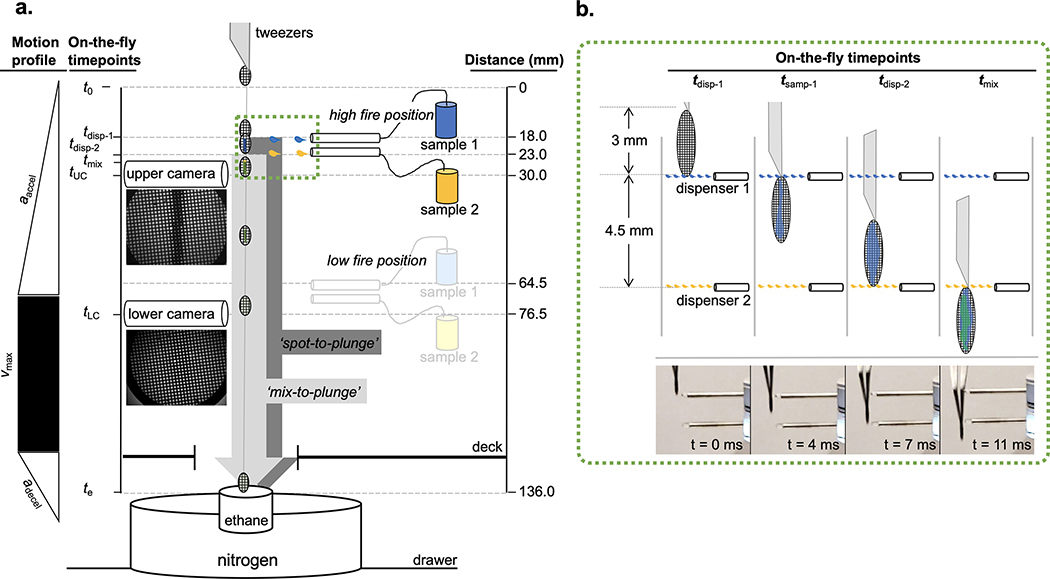
Specifications of time-resolved Spotiton operation (a) Diagrammatic overview of the distances (fixed) and elapsed times (variable) relevant to spraying and mixing two samples on a moving grid. Simultaneous dispensing of both samples is triggered after the grid plunge begins. Representative images from the upper and lower cameras are shown directly below the illustrations of each. Sample 1 and sample 2 are indicated in blue and yellow, respectively. (b) Magnified view of (green-dashed) boxed area in (a) showing grid and dispensing at specific time-points with corresponding high-speed video captures of the tips and grid below. Elapsed times shown on each image reflect estimates from a video of a grid plunged under Condition 2 (Supplementary Table 1). Objects in (a) and (b) are not drawn to scale. Supplementary Tables 1–4 list values for the following parameters of a grid plunged as depicted in (a) and (b): aaccel, acceleration rate; adecel, deceleration rate; vmax, maximum velocity; t0, plunge start point; tdisp-1, grid leading edge reaches first dispenser; tsamp-1, sample 1 fully applied to grid; tdisp-2, grid leading edge reaches second dispenser; tmix, samples 1 and 2 fully applied to grid; tUC, grid reaches upper camera, tLC, grid reaches lower camera; te, grid plunges into ethane. ‘Spot-to-plunge’ and ‘mix-to-plunge’ in (a) reflect the elapsed times from tdisp-1 or tmix to te, respectively.
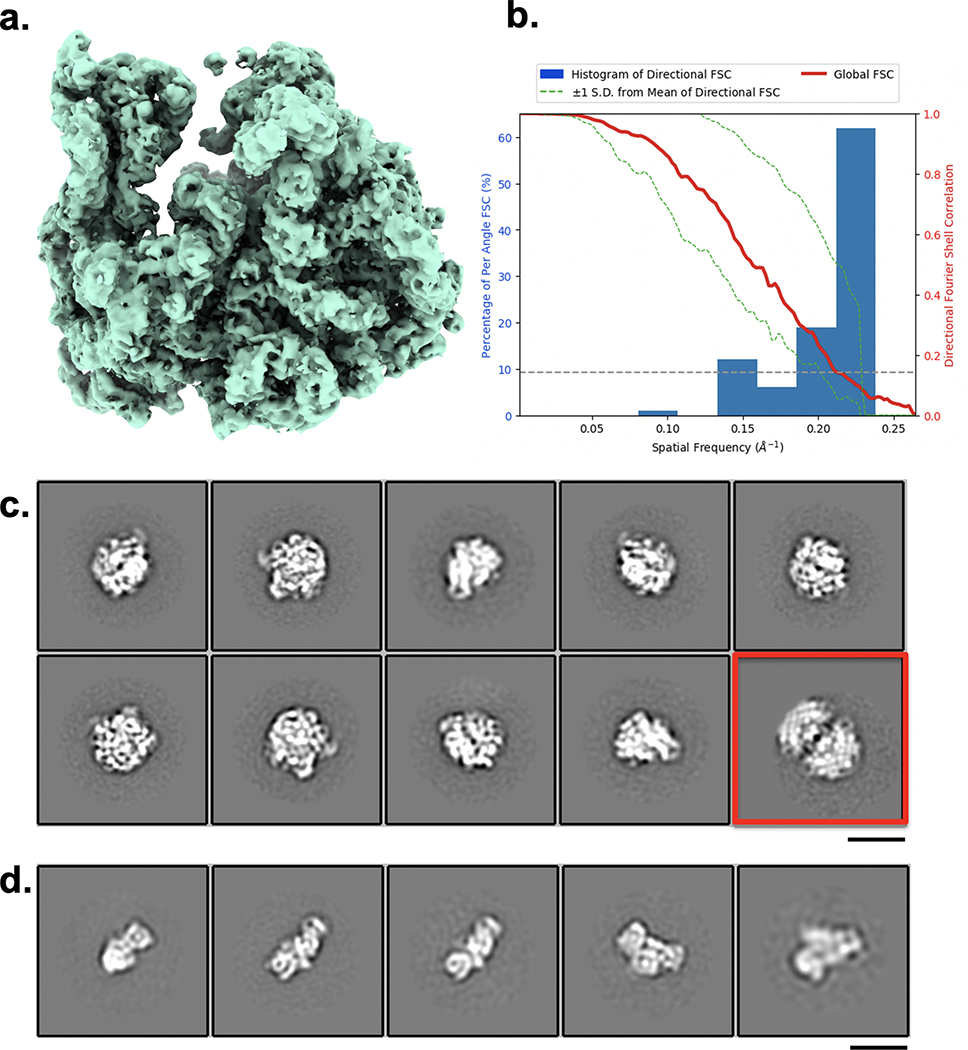
Mixing 30S and 50S ribosomal subunits to form 70S complexes (a) ~20% of particles present were reconstructed to 70S complex at a resolution of 4.75 Å as indicated by FSC0.5 (b). (c) 2D classes of 50S ribosomal subunit obtained from the control experiment; 2D class of 50S-50S dimer is shown in red. (d) 2D classes of the 30S ribosomal subunit obtained from the control experiment. Both control experiments show no evidence of 70S ribosomes as observed in the mixed experiment. Scale bars, 20 nm.
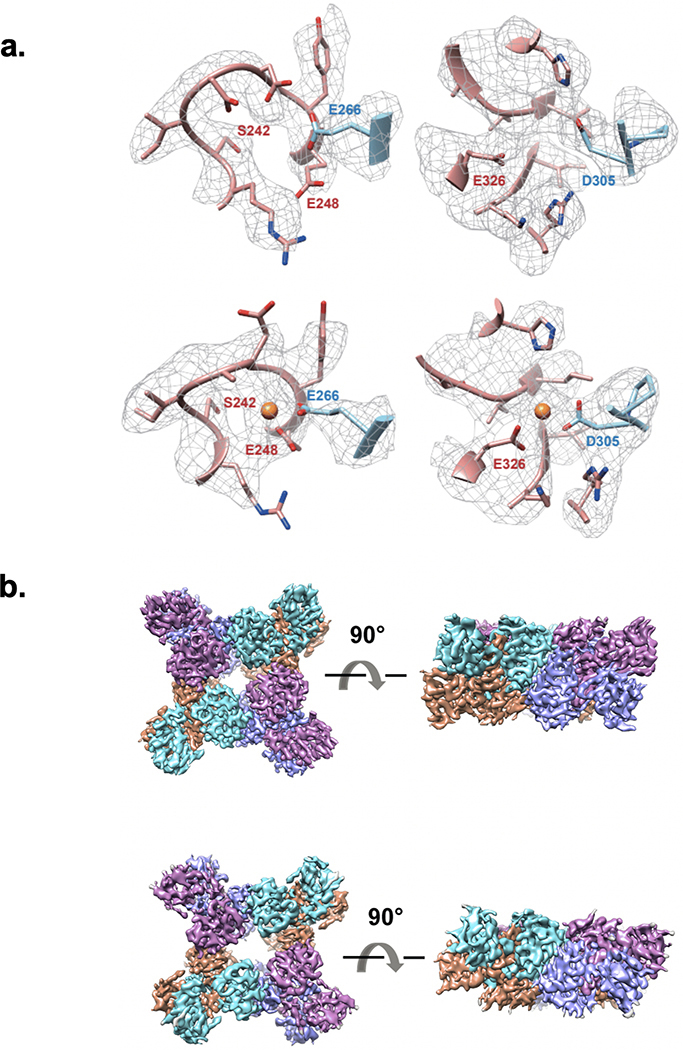
Cryo-EM maps of MthK RCK domain with and without Ca2+ (a) The two additional Ca2+ binding sites of MthK either vacant from a control experiment (top row) or occupied after mixing with calcium (bottom row). (b) 3D volumes of MthK RCK domains without (top row) and with (bottom row) Ca2+ bound.
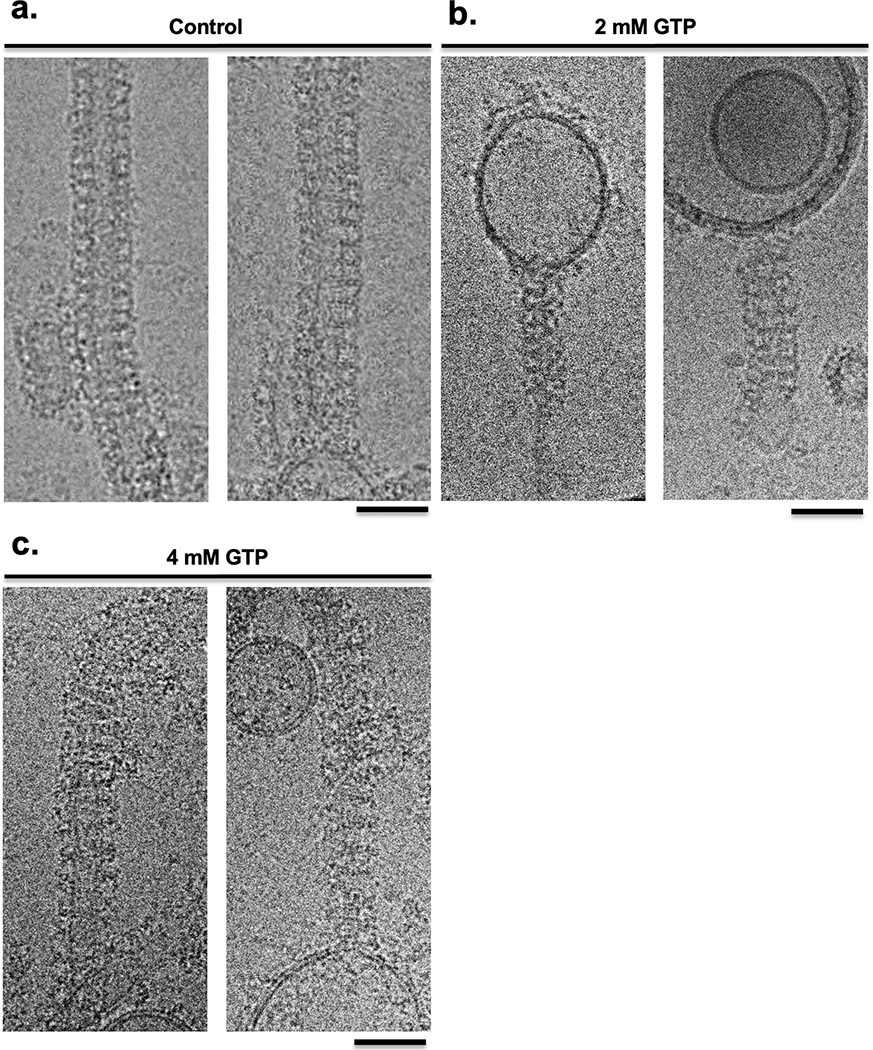
Mixing of GTP with dynamin-decorated lipid tubes results in constriction Representative cryo-electron micrographs of control dynamin-decorated tubes without GTP (a), with 2 mM GTP (b) and 4mM GTP (c). Scale bars, 50 nm.
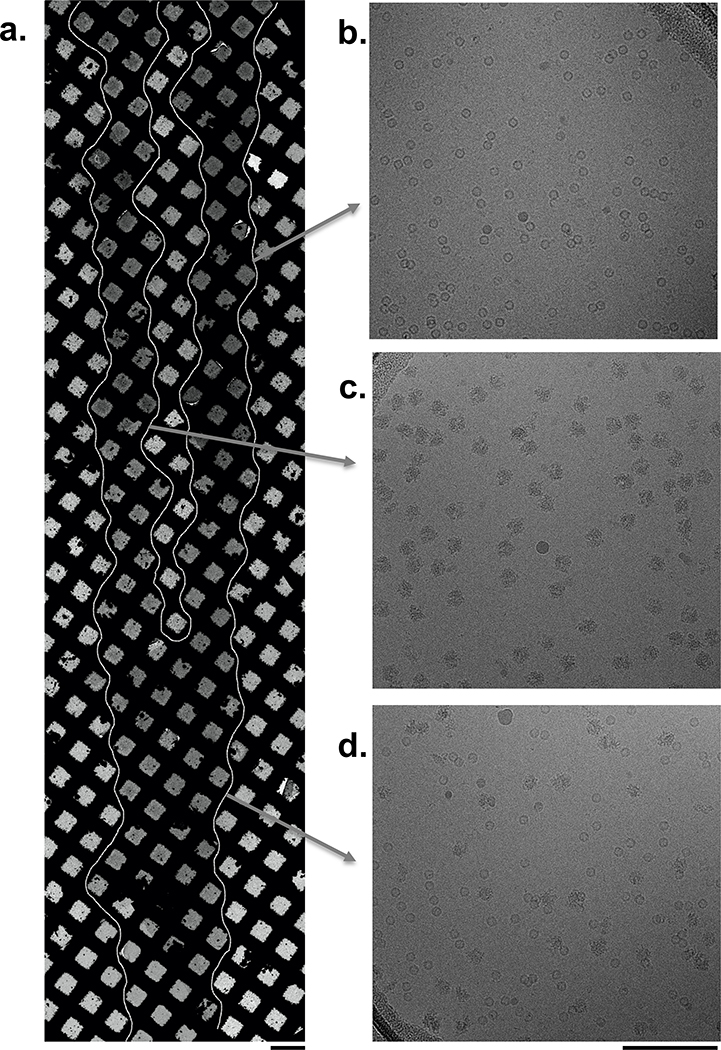
(a) Overview of the vitrified grid showing the sample streams merged at the leading edge (bottom) and separated at the trailing edge (top). Squares containing vitrified ice are indicated by a white outline. Scale bar, 100 μm. Micrographs obtained from the indicated regions show either only (b) apoferritin or (c) 70S ribosomes or (d) a mix of both samples and are representative of approximately 470 images each. Scale bar, 100 nm.
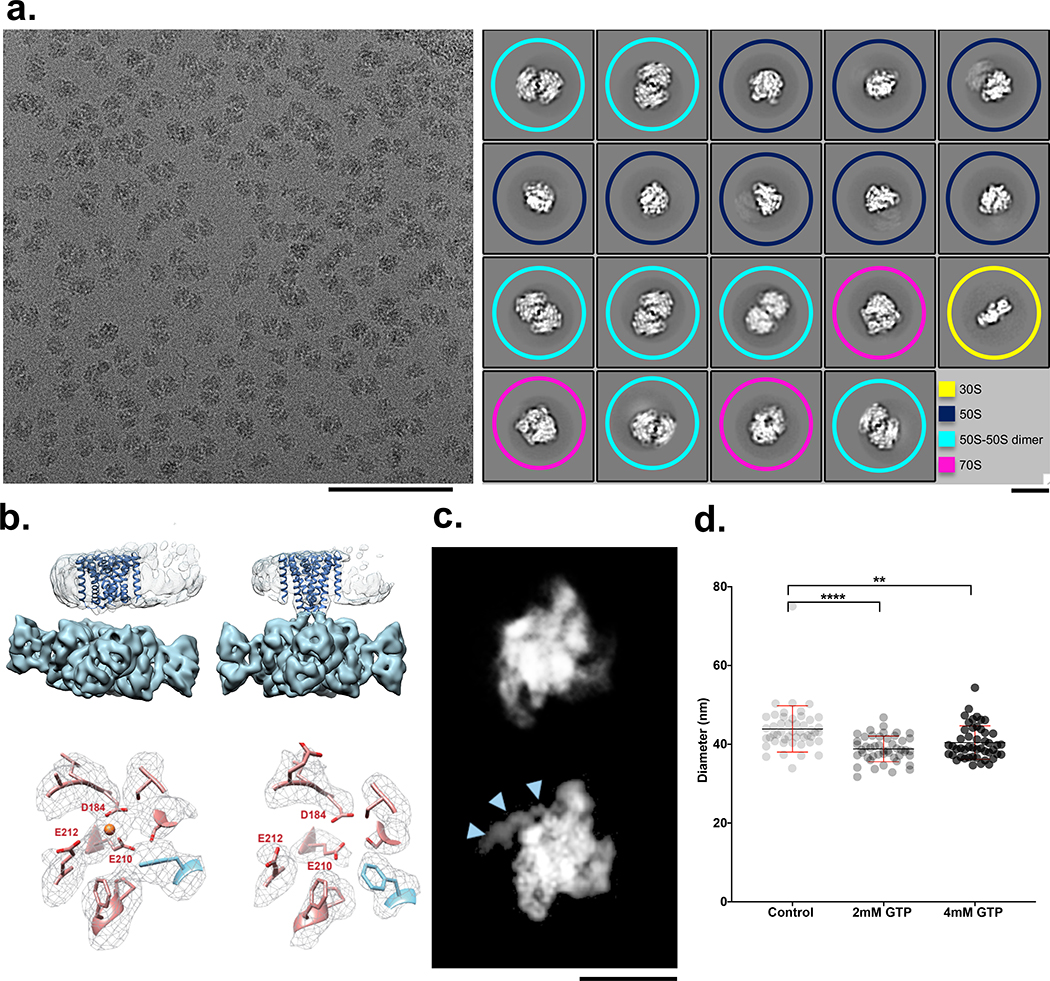
(a) left: Micrograph from the mixed region of a Spotiton prepared grid shows 30S and 50S ribosomal subunits and 70S complexes and is representative of 311 images. Scale bar, 100 nm; right: corresponding 2D classes show particles representing a population of 30S (yellow), 50S (blue), 50S-50S dimers (turquoise), and 70S (magenta). ~20% of particles were reconstructed to a 70S complex at a resolution of 4.75 Å (see Methods and Extended Data Fig. 2). Scale bar, 20nm. (b) 3D volumes generated from MthK in the presence (top left) or absence (top right) of calcium showing clear differences in the overall conformation of the channel. The bottom row shows one of the three Ca2+ binding sites in MthK either occupied in the case of a mixing experiment (left) or vacant as with the MthK only control (right). (c) Representative class averages of RNAP alone (top) or mixed with promoter DNA (bottom) showing DNA clearly bound (blue arrowheads). Scale bar, 10nm. (d) Measured diameters (mean ± SD) of dynamin-decorated tubes without (Control: 43.85, ± 5.86, n=48) and with GTP (2 mM: 38.80, ± 3.2, n=48; 4 mM: 40.40, ± 4.23, n=48,). **P = 0.0014, ****P = 0.0001, two-sided Student’s t test.
References
-
- Berriman J & Unwin N Analysis of transient structures by cryo-microscopy combined with rapid mixing of spray droplets. Ultramicroscopy 56, 241–252 (1994). - PubMed
-
- Unwin N Acetylcholine receptor channel imaged in the open state. Nature 373, 37–43 (1995). - PubMed
-
- White HD, Walker ML & Trinick J A computer-controlled spraying-freezing apparatus for millisecond time-resolution electron cryomicroscopy. J Struct Biol 121, 306–313 (1998). - PubMed
Publication types
MeSH terms
Grants and funding
LinkOut - more resources
Full Text Sources
Other Literature Sources
