. 2020 Dec;16(12):1343-1350.
doi: 10.1038/s41589-020-0617-7. Epub 2020 Aug 10.

G12/13 is activated by acute tethered agonist exposure in the adhesion GPCR ADGRL3

Affiliations

G12/13 is activated by acute tethered agonist exposure in the adhesion GPCR ADGRL3

Signe Mathiasen et al. Nat Chem Biol. 2020 Dec.

Erratum in

Abstract

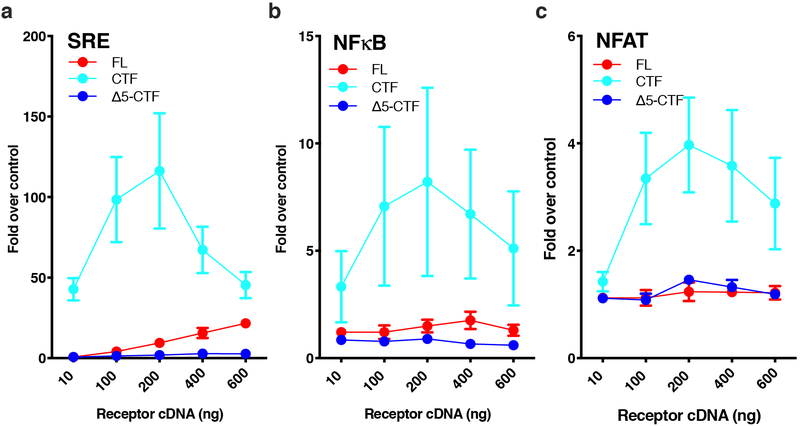
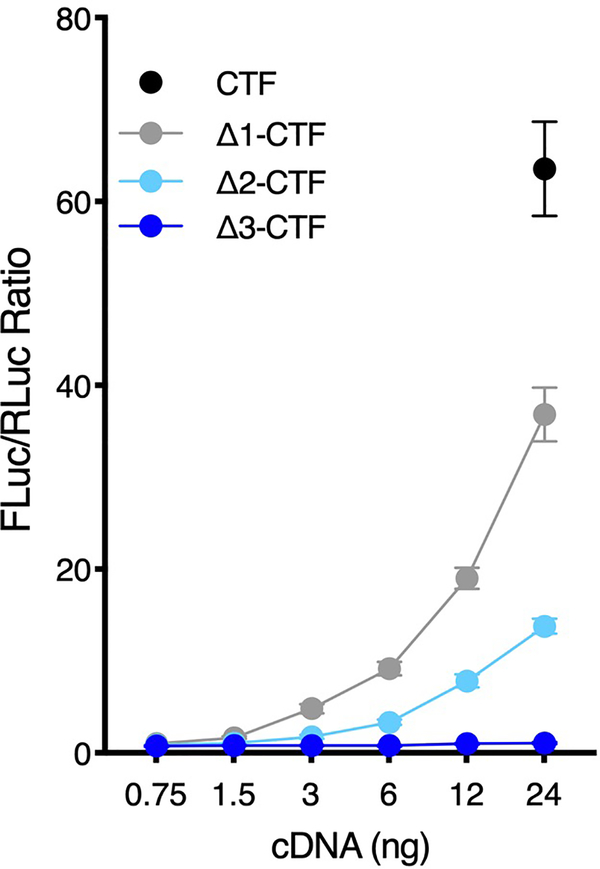
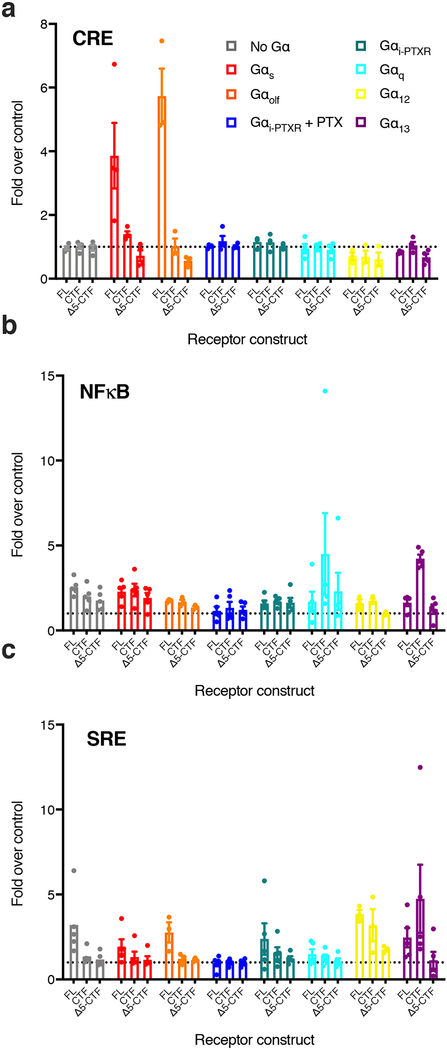
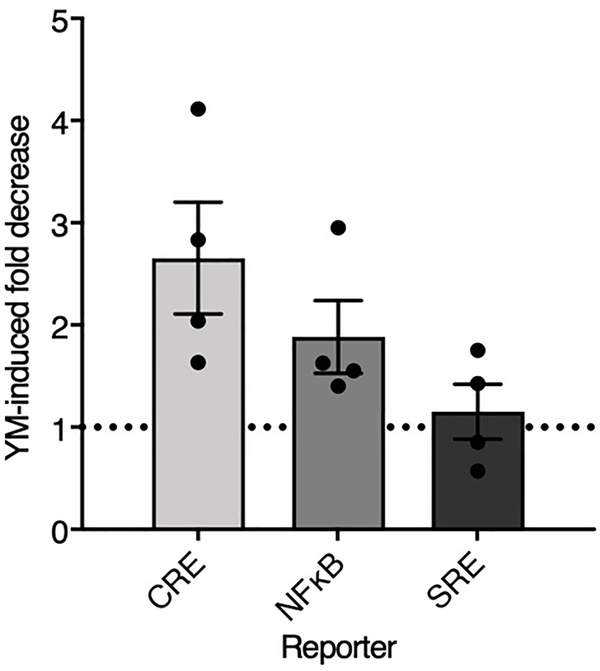
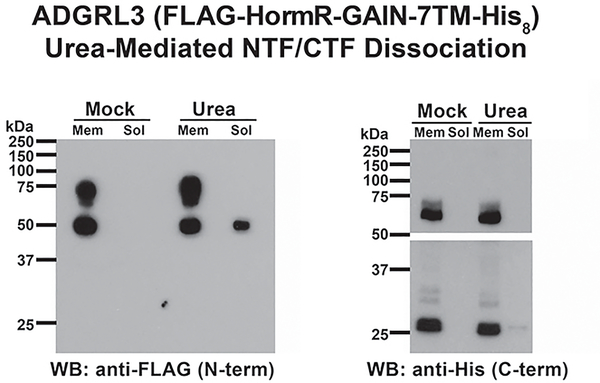
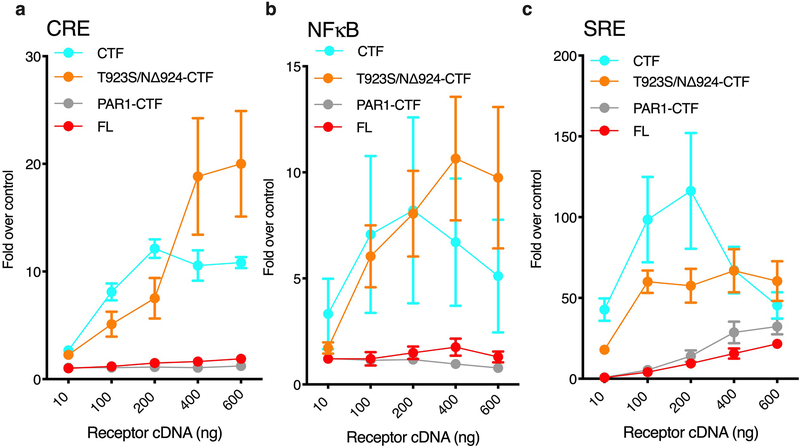
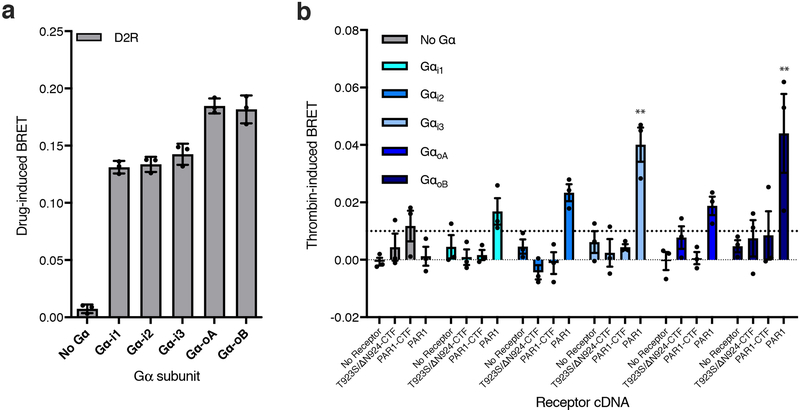
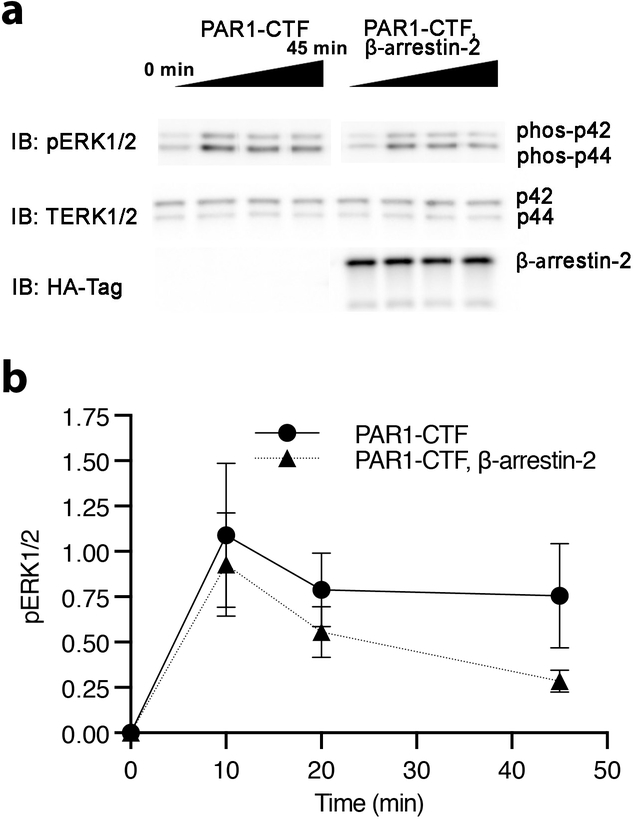
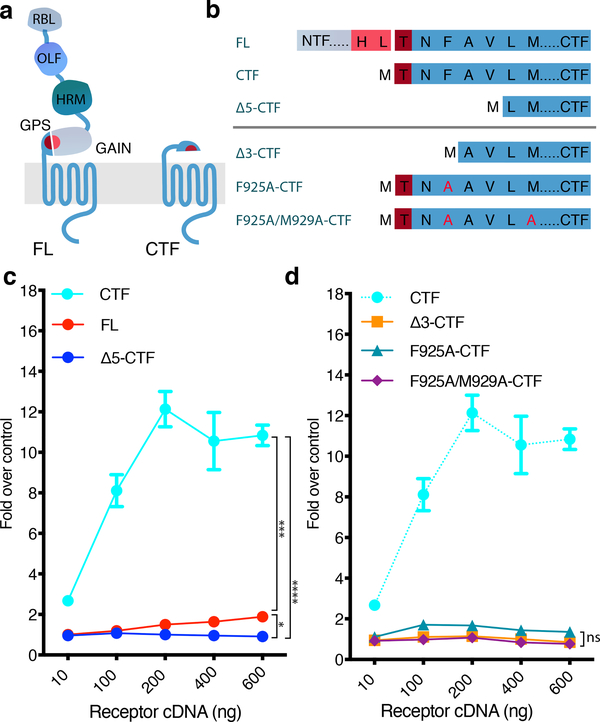
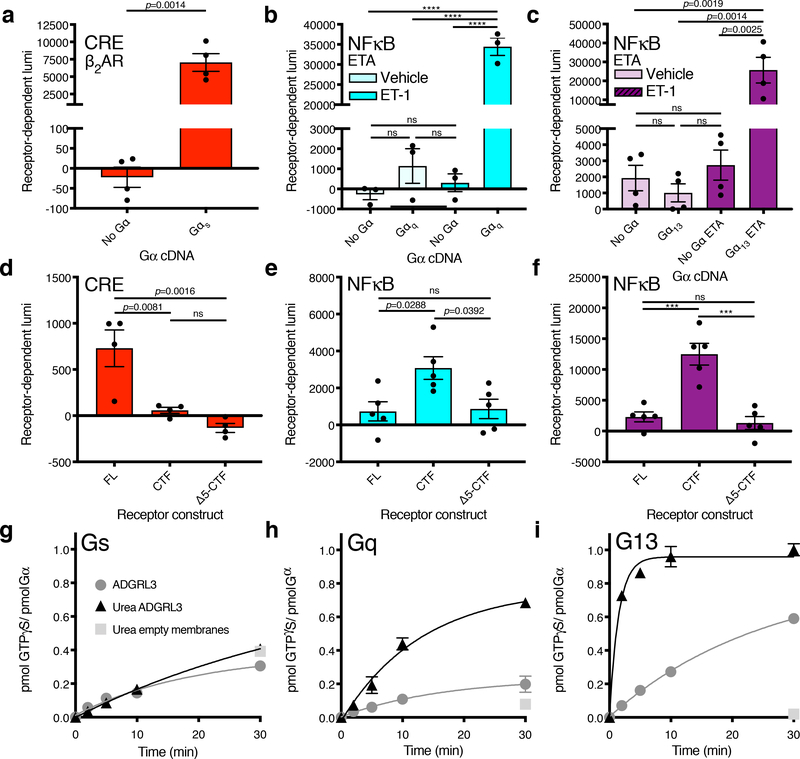
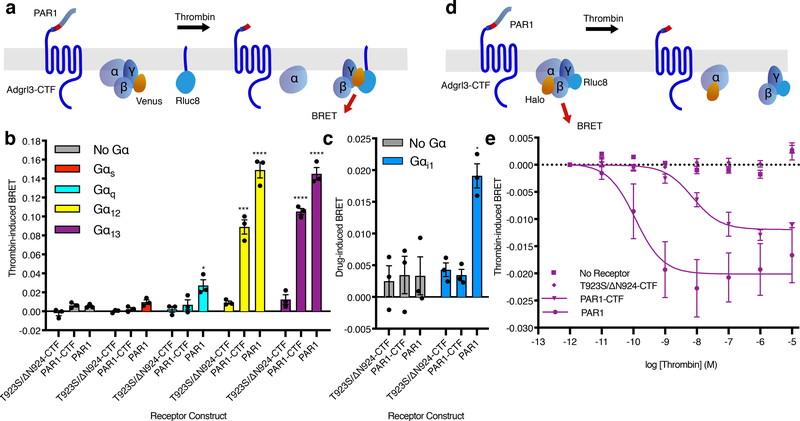
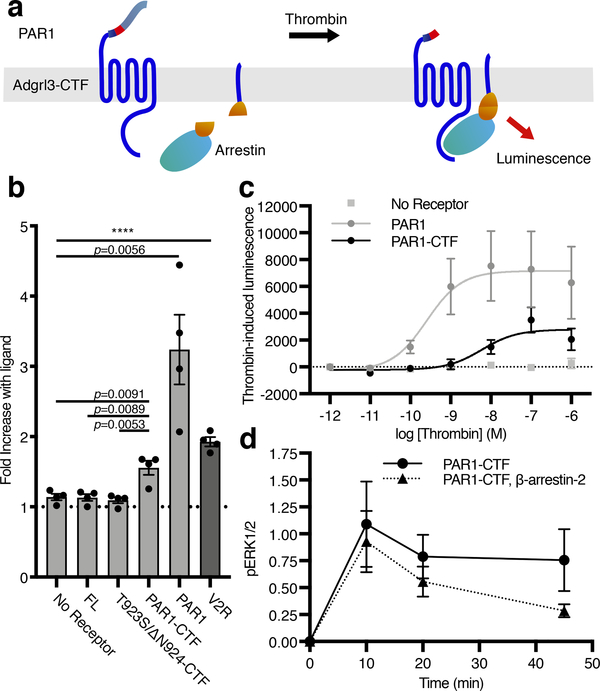
The adhesion G-protein-coupled receptor (GPCR) latrophilin 3 (ADGRL3) has been associated with increased risk of attention deficit hyperactivity disorder (ADHD) and substance use in human genetic studies. Knockdown in multiple species leads to hyperlocomotion and altered dopamine signaling. Thus, ADGRL3 is a potential target for treatment of neuropsychiatric disorders that involve dopamine dysfunction, but its basic signaling properties are poorly understood. Identification of adhesion GPCR signaling partners has been limited by a lack of tools to acutely activate these receptors in living cells. Here, we design a novel acute activation strategy to characterize ADGRL3 signaling by engineering a receptor construct in which we could trigger acute activation enzymatically. Using this assay, we found that ADGRL3 signals through G12/G13 and Gq, with G12/13 the most robustly activated. Gα12/13 is a new player in ADGRL3 biology, opening up unexplored roles for ADGRL3 in the brain. Our methodological advancements should be broadly useful in adhesion GPCR research.


Conflict of interest statement

Competing Interests statement

The authors declare no competing financial interests.

Figures

Extended Data Fig. 1
Extended Data Fig. 1. TA-enhanced signaling effect is also observed in SRE, NFAT, and NFκB gene expression assays.
(a) SRE (b) NFκB and (c) NFAT. For all gene response elements (SRE, NFAT, and NFκB) signaling was increased significantly when the entire N-terminal fragment up to the GPS cleavage site (CTF) was removed; FL receptor also showed some activity in SRE (comparable to CRE in Figure 1). Luminescence in (a-c) was measured for a range of increased receptor cDNA concentrations ~24 hours after transfection in HEK293T cells. All data points are normalized to an empty vector control. Data are presented as mean values ±SEM from 3 independent experimental replicates.
Extended Data Fig. 2
Extended Data Fig. 2. Successive truncation of the first three ADGRL3 tethered agonist residues dramatically blunts SRE-Luciferase gene reporter activation.
SRE gene expression assay for ADGRL3 (human homolog) CTF, Δ1-CTF, Δ2-CTF and Δ3-CTF. Luminescence was measured for a range of increased receptor cDNA amounts (ng) ~24 hours after transfection in HEK293T cells. For the dual luciferase assay, data are presented as Firefly/Renilla luciferase units, and all data points are normalized to the corresponding ratio for the empty vector control,–. Data are from one representative experiment performed 3 times. Data are presented as mean ±SD from triplicate technical replicates.
Extended Data Fig. 3
Extended Data Fig. 3. Screen of Adgrl3 (FL, CTF, and Δ5-CTF constructs) signaling in the 4 major G protein signaling pathways utilizing a HEK-293 CRISPR knockout cell line (HEKΔ7) and a panel of gene expression assays.
(a) CRE (b) NFκB (c) SRE. Each Gα protein species was reintroduced one at a time (see color legend for specification) at optimized cDNA concentrations and luminescence signals were evaluated for empty vector control and receptor constructs ~24 hours after transfection. All data points are normalized to corresponding empty vector control. Bars indicate mean values ±SEM from 4 (a) and 5 (b-c) independent experimental replicates. Bars for Gαolf and12 are presented as mean values ±SEM from 3 independent experimental replicates.
Extended Data Fig. 4
Extended Data Fig. 4. CTF Gαq signaling is detected both in CRE and NFκB
CTF signaling in CRE, NFκB, and SRE was evaluated after 18 hours of treatment with either vehicle or a potent Gαq inhibitor (YM-254890, 1 μM). Data was collected in regular HEK293T cells. Data points are normalized to empty vector control and displayed as the fold decrease with YM-254890. Bars show mean ±SFM from 4 independent experimental replicates
Extended Data Fig. 5
Extended Data Fig. 5. Urea-mediated ADGRL3 N-terminal Fragment dissociation
For the membrane urea treatment experiments presented in this figure, a FLAG- (N-terminal) and His8- (C-terminal) tagged ADGRL3 construct that was truncated N-terminally to the HormR domain was used (See Fig. 1 for Adgrl3 architecture). Insect cell membranes (High-Five) with expressed ADGRL3 were mock treated or extracted with urea. The presence of the ADGRL3 NTF and CTF in the membrane (Mem) and extract (Soluble, Sol) fractions was determined by immunoblotting with an anti-FLAG antibody to detect the NTF and an anti-penta-His antibody to detect the CTF. The NTF (apparent MW ~50 kDa) was partially solubilized with the urea, whereas the CTF (apparent MW ~27 kDa) was not. The penta-His blot panels are from one contiguous blot, but broken to avoid oversaturation of the ~70 kDa band (unprocessed receptor) and to show a higher exposure of low MW panel (~27 kDa CTF). Data from one representative experiment that was repeated three times.
Extended Data Fig. 6
Extended Data Fig. 6. CRE, NFκB, and SRE gene expression assays for PAR1-CTF and corresponding T923S/ΔN924-CTF control construct.
CRE (a), NFκB (b) and SRE (c) signaling was increased significantly for T923S/ΔN924-CTF to levels comparable with CTF, whereas PAR1-CTF signals were comparable to FL levels. CTF and FL are replotted from Figure 1c and Extended Data Fig. 1 for direct comparison. Luminescence was measured for a range of receptor cDNA concentrations ~24 hours after transfection in HEK293T cells. All data points are normalized to an empty vector control. Data are shown as mean ±SEM from 3 independent experimental replicates.
Extended Data Fig. 7
Extended Data Fig. 7. TA-exposed Adgrl3 does not activate the Gαi/o family
(a) Gβγ release assay testing D2R activation of Gαi1, Gαi2, Gαi3, GαoA and GαoB in HEK full G protein KO cells. In comparison to the HEKΔ7 CRISPR knockout, this cell line also lacks the full Gαi/o family. Luminescence was read 10 min after stimulation with 10 jliM quinpirole. (b) Gβγ release assay testing the T923S/ΔN924-CTF, PAR1-CTF, and PAR1 activation of Gαi1, Gαi2, Gαi3, GαoA and GαoB in HEK full G protein KO cells. Luminescence was read 10 min after stimulation with 1 μM thrombin. All data are normalized to buffer controls and show the BRET effect induced by ligands. Bars show mean ±SEM from 3 independent experimental replicates. One-way ANOVA with Dunnett’s multiple-comparison post-hoc test was performed for each cDNA construct individually, (no receptor (empty vector), T923S/ΔN924-CTF, PAR1-CTF, and PAR1) to determine statistical significance between the No Gα control and each Gα subtype (For Gαi3**p=0.0064, for GαoB **p=0.0032). See Supplementary Data for the full set of p-values.
Extended Data Fig. 8
Extended Data Fig. 8. β-arrestin-2 decreases G protein-dependent ERK1/2 phosphorylation.
HEK Δarr1/2 cells were transfected with PAR1-CTF or PAR1-CTF with β-arrestin-2. After 48 hr, the cells were acutely activated with 1 μM thrombin over a time course of 45 min. (a) Representative immunoblotting analysis with antibodies against phosphoERK1/2 (#9101S), total ERK1/2 (#9102S), and HA (#2367S). Each sample was derived from the same experiment and the blots were processed in parallel. The HA blot was used as a sample processing control to ensure uniform β-arrestin-2 expression. (b) The level of phospho-ERK1/2 was normalized to total ERK and the baseline at 0 min was subtracted to produce the time-dependent change in pERK1/2. Data are presented as mean ±SEM from 3 (PAR1-CTF) 4 (PAR1-CTF, β-Arrestin-2) independent experimental replicates.
Figure 1.
Figure 1.. Exposure of the Adgrl3 TA promotes intracellular signaling.
(a) Schematic outlining the tertiary architecture of full-length (FL) and TA-exposed (CTF) Adgrl3 constructs. Adgrl3 FL is composed of a transmembrane GPCR fold (CTF) and a large N terminus (NTF) comprising 4 protein domains. Proteolysis occurs at the GPS cleavage site, which is buried in the GAIN domain. The peptide stretch (TA) immediately following the GPS is involved in regulating signaling. RBL: Rhamnose-binding lectin. OLF: Olfactomedin. HRM: Hormone receptor motif. GPS: GPCR proteolytic site. GAIN: GPCR autoproteolysis-inducing domain. GPCR: 7 transmembrane helix domain. (b) Schematic outlining the sequences of Adgrl3 constructs used in c and d. Proteolysis is marked in FL by a break in sequence between HL and T. (c) FL Adgrl3 constitutively enhances CRE and this signaling is increased when the entire N-terminal fragment (NTF) up to the GPS cleavage site (CTF) is removed. Further truncating 5 amino acids from the GPS site (Δ5-CTF) abolish es signaling (d) Truncating the first three amino acids following the GPS abolish CTF signaling (Δ3-CTF). Mutating the conserved phenylalanine in the TA (F943A-CTF) almost eliminates CTF activity, and two TA point mutations (F925A/M929A-CTF) abolish CTF signaling. The cyan dashed line is reprinted from c for direct comparison. All data points are normalized to empty vector control. In all panels data are presented as mean ±SEM from 3 independent experimental replicates. Unpaired two-tailed t-tests were performed to compare the conditions indicated by horizontal brackets using the 600 ng datapoints (a, *p=0.0325, ***p=0.0002, ****p<0.0001) (b, F925A-CTF vs. Δ3-CTF ns, p= 0.0660, F925A/M929A-CTF vs. Δ3-CTF ns, p=0.6227, F925A/M929A-CTF vs. F925A-CTF ns, p=0.0522).
Figure 2.
Figure 2.. Adgrl3 CTF signals through Gq and G13.
Screen of Adgrl3 signaling in the major G protein signaling pathways utilizing a CRISPR knockout cell line (HEKΔ7) and a panel of gene expression assays. (a-c) Assay controls showing that the Gαs-coupled β2AR signals in CRE only when Gαs is reintroduced (a) and that ETA signals in NFκB only when Gαq (b) or Gα13 (c) is reintroduced. In (a) an unpaired two-tailed t-test was used to determine statistical significance between the No Gα and Gαs conditions; in (b,c) One-way ANOVA was employed with Tukey’s multiple-comparison post-hoc test (b, ****p<0.0001). (d-f) Gene expression signals for Adgrl3 constructs FL, CTF, and Δ5-CTF. (d) CRE with Gαs (e) NFκB with Gαq (f) NFκB with Gα13. Each Gα protein species was reintroduced at an optimized cDNA concentrations (Supplementary Fig. 5). In (d-f) One-way ANOVA with Tukey’s multiple-comparison post-hoc test was performed to determine statistical significance between the FL, CTF and Δ5-CTF conditions (ns p>0.05, ***p<0.001, ****p<0.0001). In panels (a-f) the baseline signal of empty vector was subtracted to show receptor-dependent luminescence (lumi). The full screen for Adgr3 in HEKΔ7 is shown in Extended Data Fig. 3. (g-i) ADGRL3 N-terminal dissociation induced by urea enhances G13 and Gq activation. Mock and urea-treated ADGRL3 membranes or empty High-Five membranes were reconstituted with purified Gαs (g) Gαq (h) Gα13 (i) and Gβ12 heterodimer and receptor-stimulated [35S]-GTPγS binding kinetics were measured,,. In panels (a-f) bars are presented as mean ±SEM from (a) n=4 (b-c) n=3 (d) n=4 (e-f) n=5 independent experimental replicates. In panels (g-i) data are from one representative experiment performed 3 times. Error bars mean ±SD from three technical replicates. See Supplementary Data for the full set of p-values.
Figure 3.
Figure 3.. Adgrl3 couples to Gα12/13 upon acute exposure of the TA.
(a) Cartoon outlining the principle of the Gβγ release BRET assay. Drug-induced BRET occurs when Gβγ-Venus is released from the G protein to interact with the C-terminal fragment of the G protein receptor kinase 3 fused to Rluc8. (b) Gβγ release assay testing the T923S/ΔN924-CTF, PAR1-CTF, and PAR1 activation of Gs, Gq, G12, and G13 in HEKΔ7 cells. Unpaired two-tailed t-tests were performed for T923S/ΔN924-CTF, PAR1-CTF, and PAR1 individually, to determine statistical significance between the No Gα control and each Gα subtype (*p<0.05, ***p<0.001, ****p<0.0001). (c) Gβγ release assay testing the T923S/ΔN924-CTF, PAR1-CTF, and PAR1 activation of Gαi in HEK full G KO cells. Experimental conditions identical to b. An unpaired two-tailed t-test was performed for each cDNA construct to determine statistical significance between the No Gα control and Gαi conditions (*p<0.05). (d) Cartoon outlining the principle of the inter-molecular heterotrimer α-γ BRET assay. BRET occurs between the heterotrimer subunits Gα-Halo (labelled by JF-525) and Gγ-Rluc8. When the heterotrimer is activated the BRET signal is decreased. (e) Thrombin dose-response curves for empty vector control, T923S/ΔN924-CTF, PAR1-CTF, and PAR1 receptor constructs in the Gα-γ BRET assay. In b-e Luminescence was read after 10 min of stimulation with 1 μM thrombin. Data are normalized to buffer controls and show the BRET effect induced by thrombin. For panels (b-c) and (e) error bars represent ±SEM from 3 independent experimental replicates. See Supplementary Data for the full set of p-values in b and c.
Figure 4.
Figure 4.. Adgrl3 recruits β-arrestin to the plasma membrane in living cells.
(a) Cartoon outlining the principle of the split complementation luminescence β-arrestin assay. After receptor activation (and potentially phosphorylation) β-arrestin-C-nluc is recruited to the membrane to complement a membrane anchored N-nluc. Upon β-arrestin-translocation and reconstitution of a functional nluc, a luminescence signal is produced. (b) β-Arrestin-2 membrane-recruitment complementation assay for negative controls of empty vector, FL, and T923S/ΔN924-CTF constructs as well as for PAR1-CTF, PAR1 in response to 1 μM thrombin, and the vasopressin receptor V2R in response to 1 uM Vasopressin (AVP), which is a high affinity β-arrestin binder. Data are shown as fold over control (buffer). Unpaired two-tailed t-tests were performed to determine statistical significance between the PAR1-CTF and ‘No receptor’, FL and T923S/ΔN924-CTF constructs, as well as ‘No receptor’ and controls PAR1 and the vasopressin receptor V2R. (c) Dose-response curves for a negative control (empty vector), PAR1-CTF, and PAR1. Bars in (b) and data points in (c) are presented as mean ±SEM from 4 independent experimental replicates. (d) β-arrestin-2 decreased PAR1-CTF ERK1/2 phosphorylation. HEK Δβarr1/2 cells were transfected with PAR1-CTF, or PAR1-CTF with β-arrestin-2. After 48 hr, the cells were acutely activated with 1 μM thrombin. The level of phospho-ERK1/2 was normalized to total ERK and the baseline at 0 min was subtracted to produce the time-dependent change in pERK1/2. Data in (d) represent mean ±SEM from 3 (PAR1-CTF) and 4 (PAR1-CTF, β-arrestin-2) independent experimental replicates.

Comment in

References

References main text

    1. Purcell RH & Hall RA Adhesion G Protein-Coupled Receptors as Drug Targets. Annu Rev Pharmacol Toxicol 58, 429–449 (2018). - PMC - PubMed
    1. Hamann J, Aust G, Arac D, Engel FB,Formstone C,Fredriksson R,Hall RA,Harty BL, Kirchhoff C, Knapp B, Krishnan A, Liebscher I, Lin HH, Martinelli DC, Monk KR, Peeters MC, Piao X, Promel S, Schoneberg T, Schwartz TW, Singer K, Stacey M, Ushkaryov YA, Vallon, Wolfrum U, Wright MW, Xu L, Langenhan T & Schioth HB. International Union of Basic and Clinical Pharmacology. XCIV. Adhesion G protein-coupled receptors. Pharmacol Rev 67, 338–367 (2015). - PMC - PubMed
    1. Arcos-Burgos M, Castellanos F.x., Pineda D, Lopera F, Palacio JD, Palacio LG, Rapoport JL, Berg K, Bailey-Wilson JE & Muenke M Attention-deficit/hyperactivity disorder in a population isolate: Linkage to loci at 4q13.2, 5q33.3, 11q22, and 17p11. Am J Hum Genet 75, 998–1014 (2004). - PMC - PubMed
    1. Arcos-Burgos M, Velez JI, Martinez AF, Ribases M, Ramos-Quiroga JA, Sanchez-Mora C, Richarte V, Roncero C, Cormand B, Fernandez-Castillo N, Casas M, Lopera F, Pineda DA, Palacio JD, Acosta-Lopez JE, Cervantes-Henriquez ML, Sanchez-Rojas MG, Puentes-Rozo PJ, Molina BSG, Group MTAC, Boden MT, Wallis D, Lidbury B, Newman S, Easteal S, Swanson J, Patel H, Volkow N, Acosta MT, Castellanos FX, de Leon J, Mastronardi CA & Muenke M ADGRL3 (LPHN3) variants predict substance use disorder. Transl Psychiatry 9, 42 (2019). - PMC - PubMed
    1. van de Voet M, Harich B, Franke B & Schenck A ADHA-asoociated dopamine transporter, latrophilin and neurofibromin share a dopamine-related locomotor signature in Drosophila. Mol Psychiatry (2015). - PMC - PubMed

References online methods

    1. Stoveken HM, Bahr LL, Anders MW, Wojtovich AP, Smrcka AV & Tall GG Dihydromunduletone Is a Small-Molecule Selective Adhesion G Protein-Coupled Receptor Antagonist. Molecular Pharmacology 90, 214–224 (2016). - PMC - PubMed
    1. Stoveken HM, Larsen SD, Smrcka AV & Tall GG Gedunin- and Khivorin-Derivatives Are Small-Molecule Partial Agonists for Adhesion G Protein-Coupled Receptors GPR56/ADGRG1 and GPR114/ADGRG5. Molecular Pharmacology 93, 477–488 (2018). - PMC - PubMed
    1. Grundmann M, Merten N, Malfacini D, Inoue A, Preis P, Simon K, Ruttiger N, Ziegler N, Benkel T, Schmitt NK, Ishida S, Muller I, Reher R, Kawakami K, Inoue A, Rick U, Kuhl T, Imhof D, Aoki J, Konig GM, Hoffmann C, Gomeza J, Wess J & Kostenis E Lack of beta-arrestin signaling in the absence of active G proteins. Nat Commun 9, 341 (2018). - PMC - PubMed
    1. Stallaert W, van der Westhuizen ET, Schonegge AM, Plouffe B, Hogue M, Lukashova V,Inoue A, Ishida S, Aoki J, Le Gouill C & Bouvier M Purinergic Receptor Transactivation by the beta2-Adrenergic Receptor Increases Intracellular Ca(2+) in Nonexcitable Cells. Mol Pharmacol 91, 533–544 (2017). - PubMed
    1. Schneider CA, Rasband WS & Eliceiri KW NIH Image to Image J: 25 yearsof image analysis. Nat Methods 9, 671–675 (2012). - PMC - PubMed

Publication types

MeSH terms