. 2020 Dec;16(12):1351-1360.
doi: 10.1038/s41589-020-0613-y. Epub 2020 Aug 10.

Metabolic determinants of cancer cell sensitivity to canonical ferroptosis inducers

Affiliations

Metabolic determinants of cancer cell sensitivity to canonical ferroptosis inducers

Mariluz Soula et al. Nat Chem Biol. 2020 Dec.

Abstract

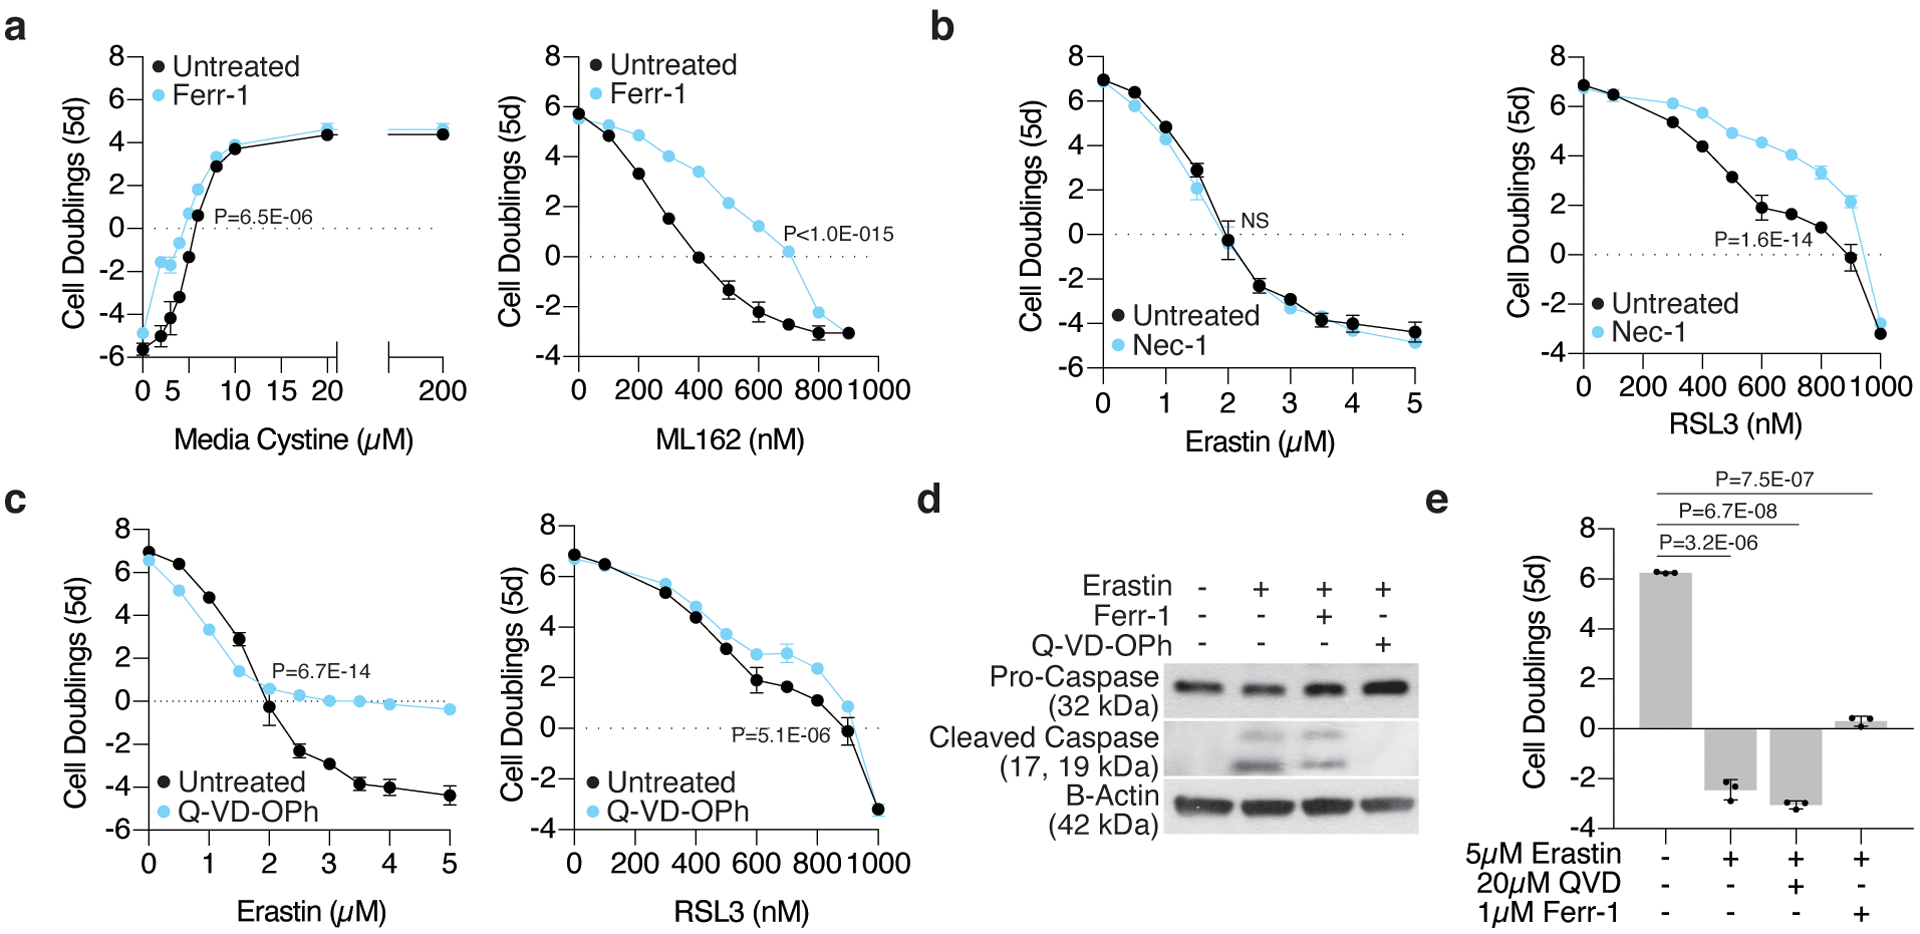
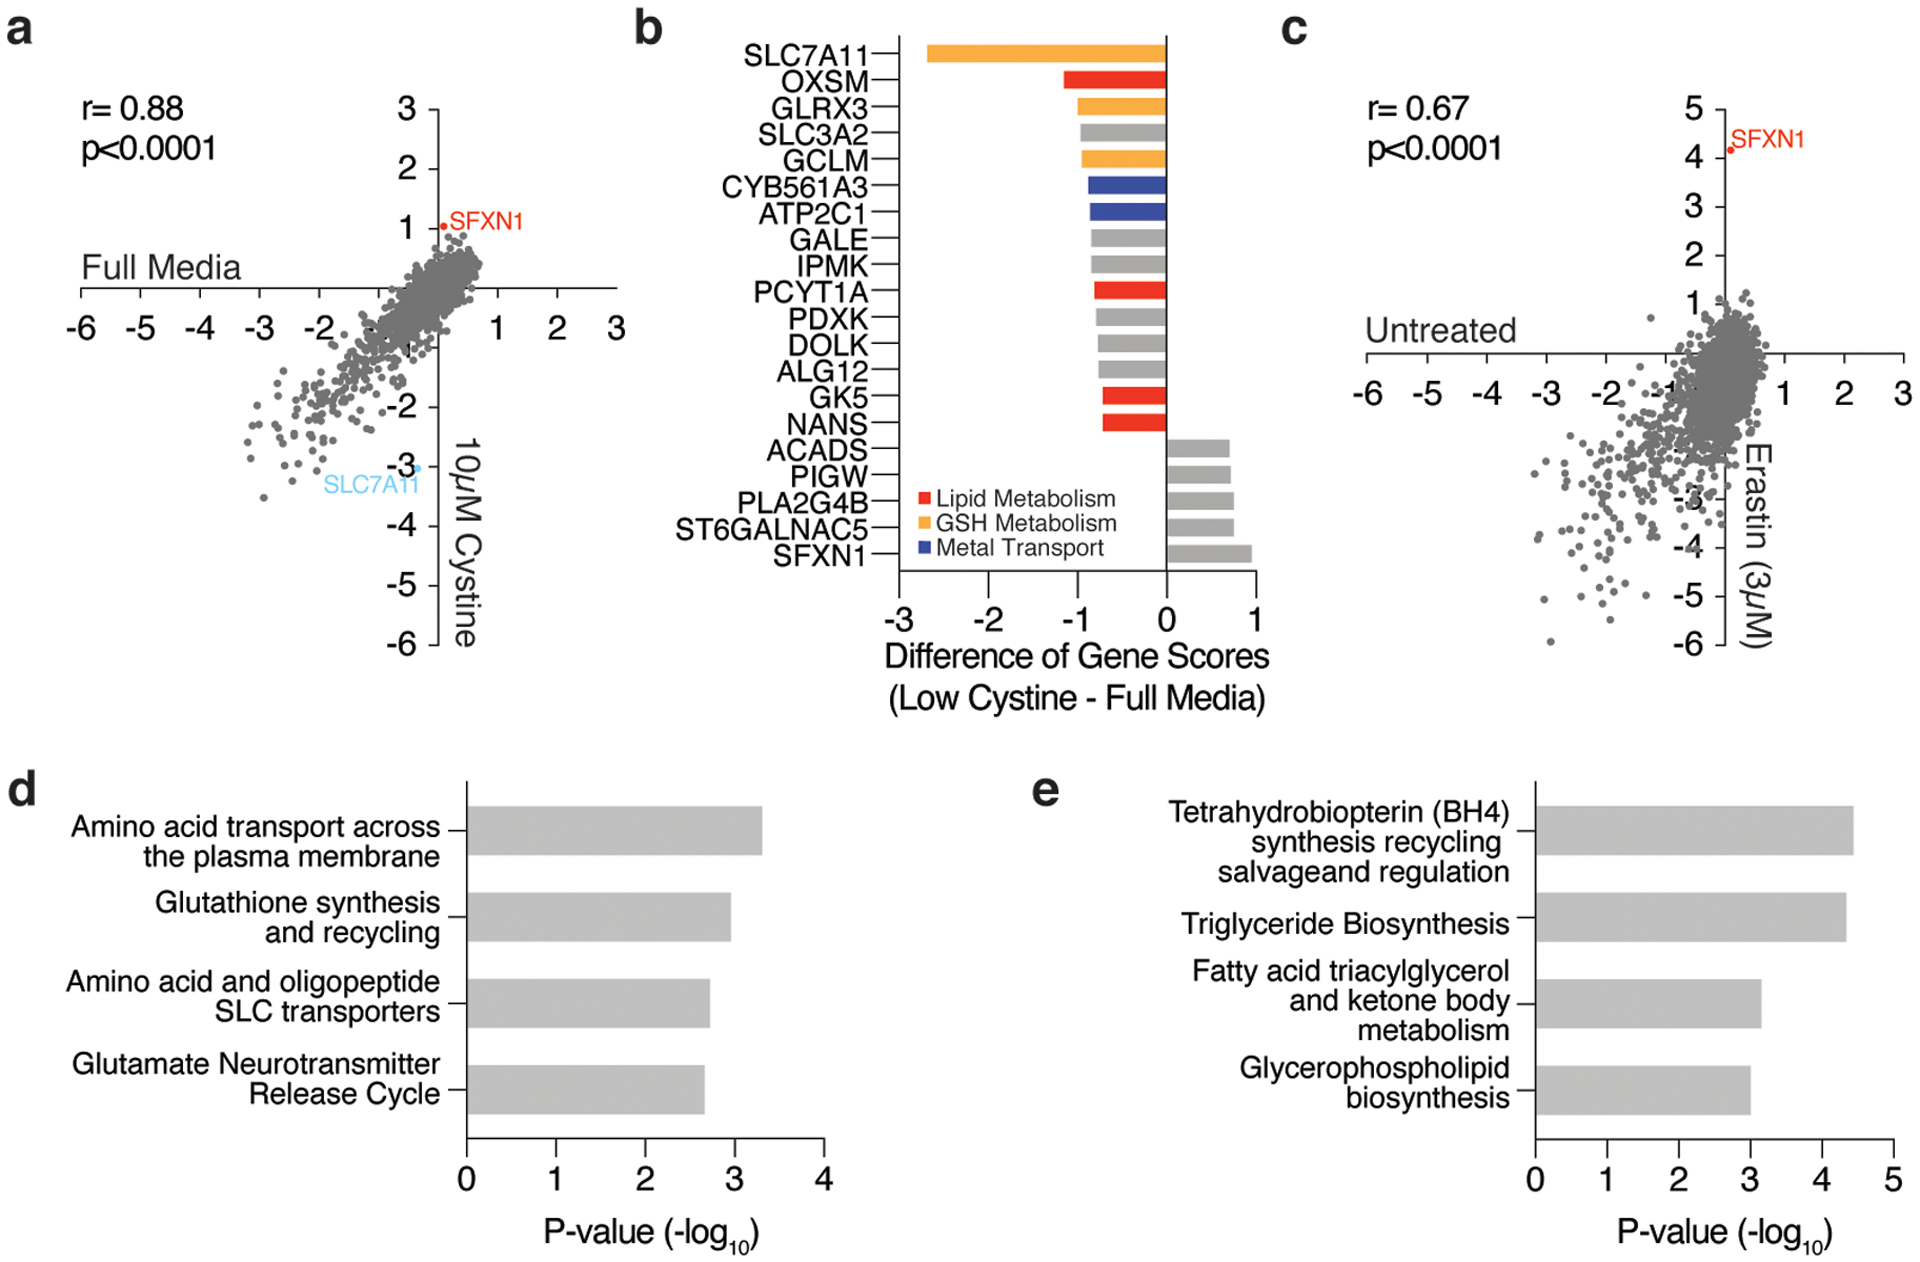
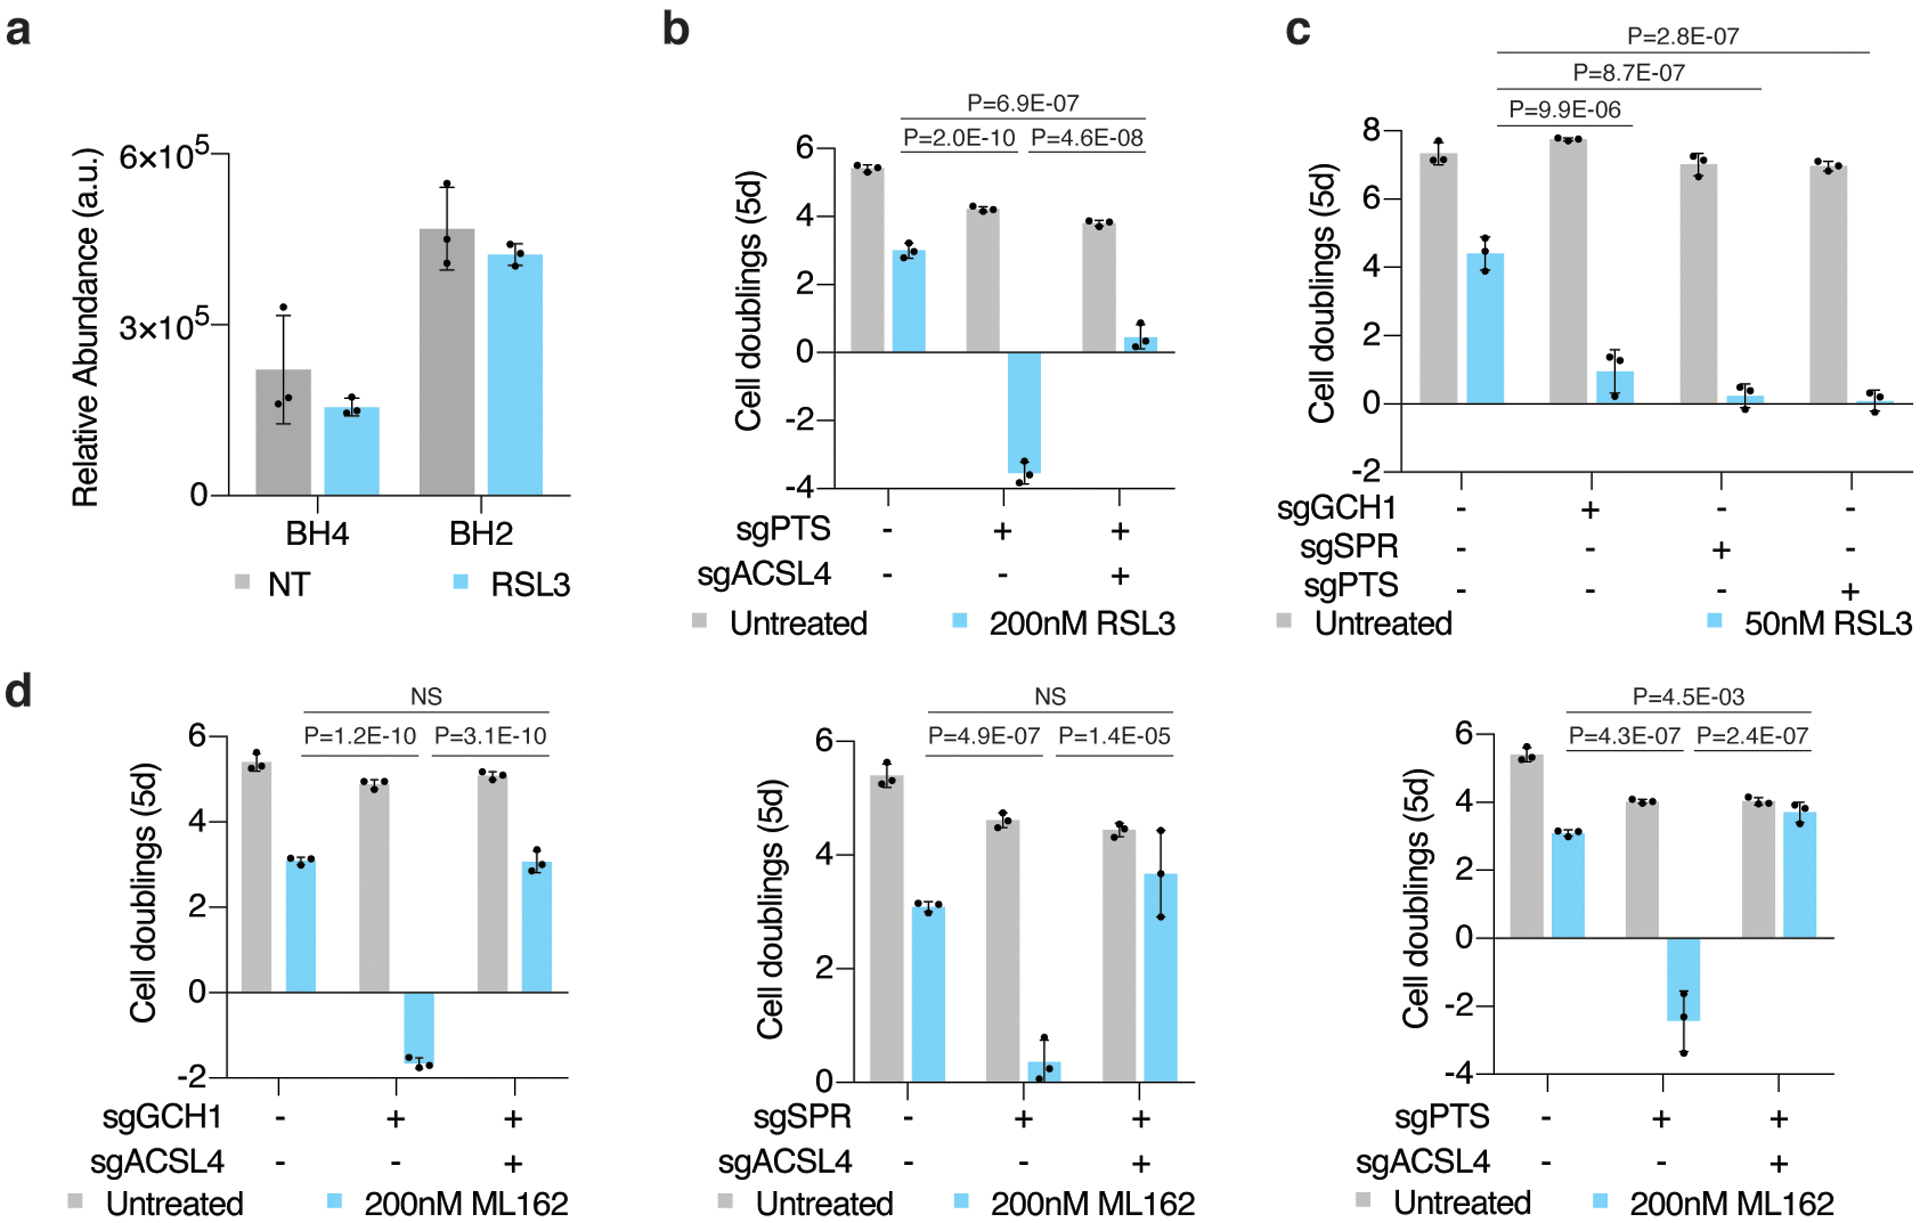
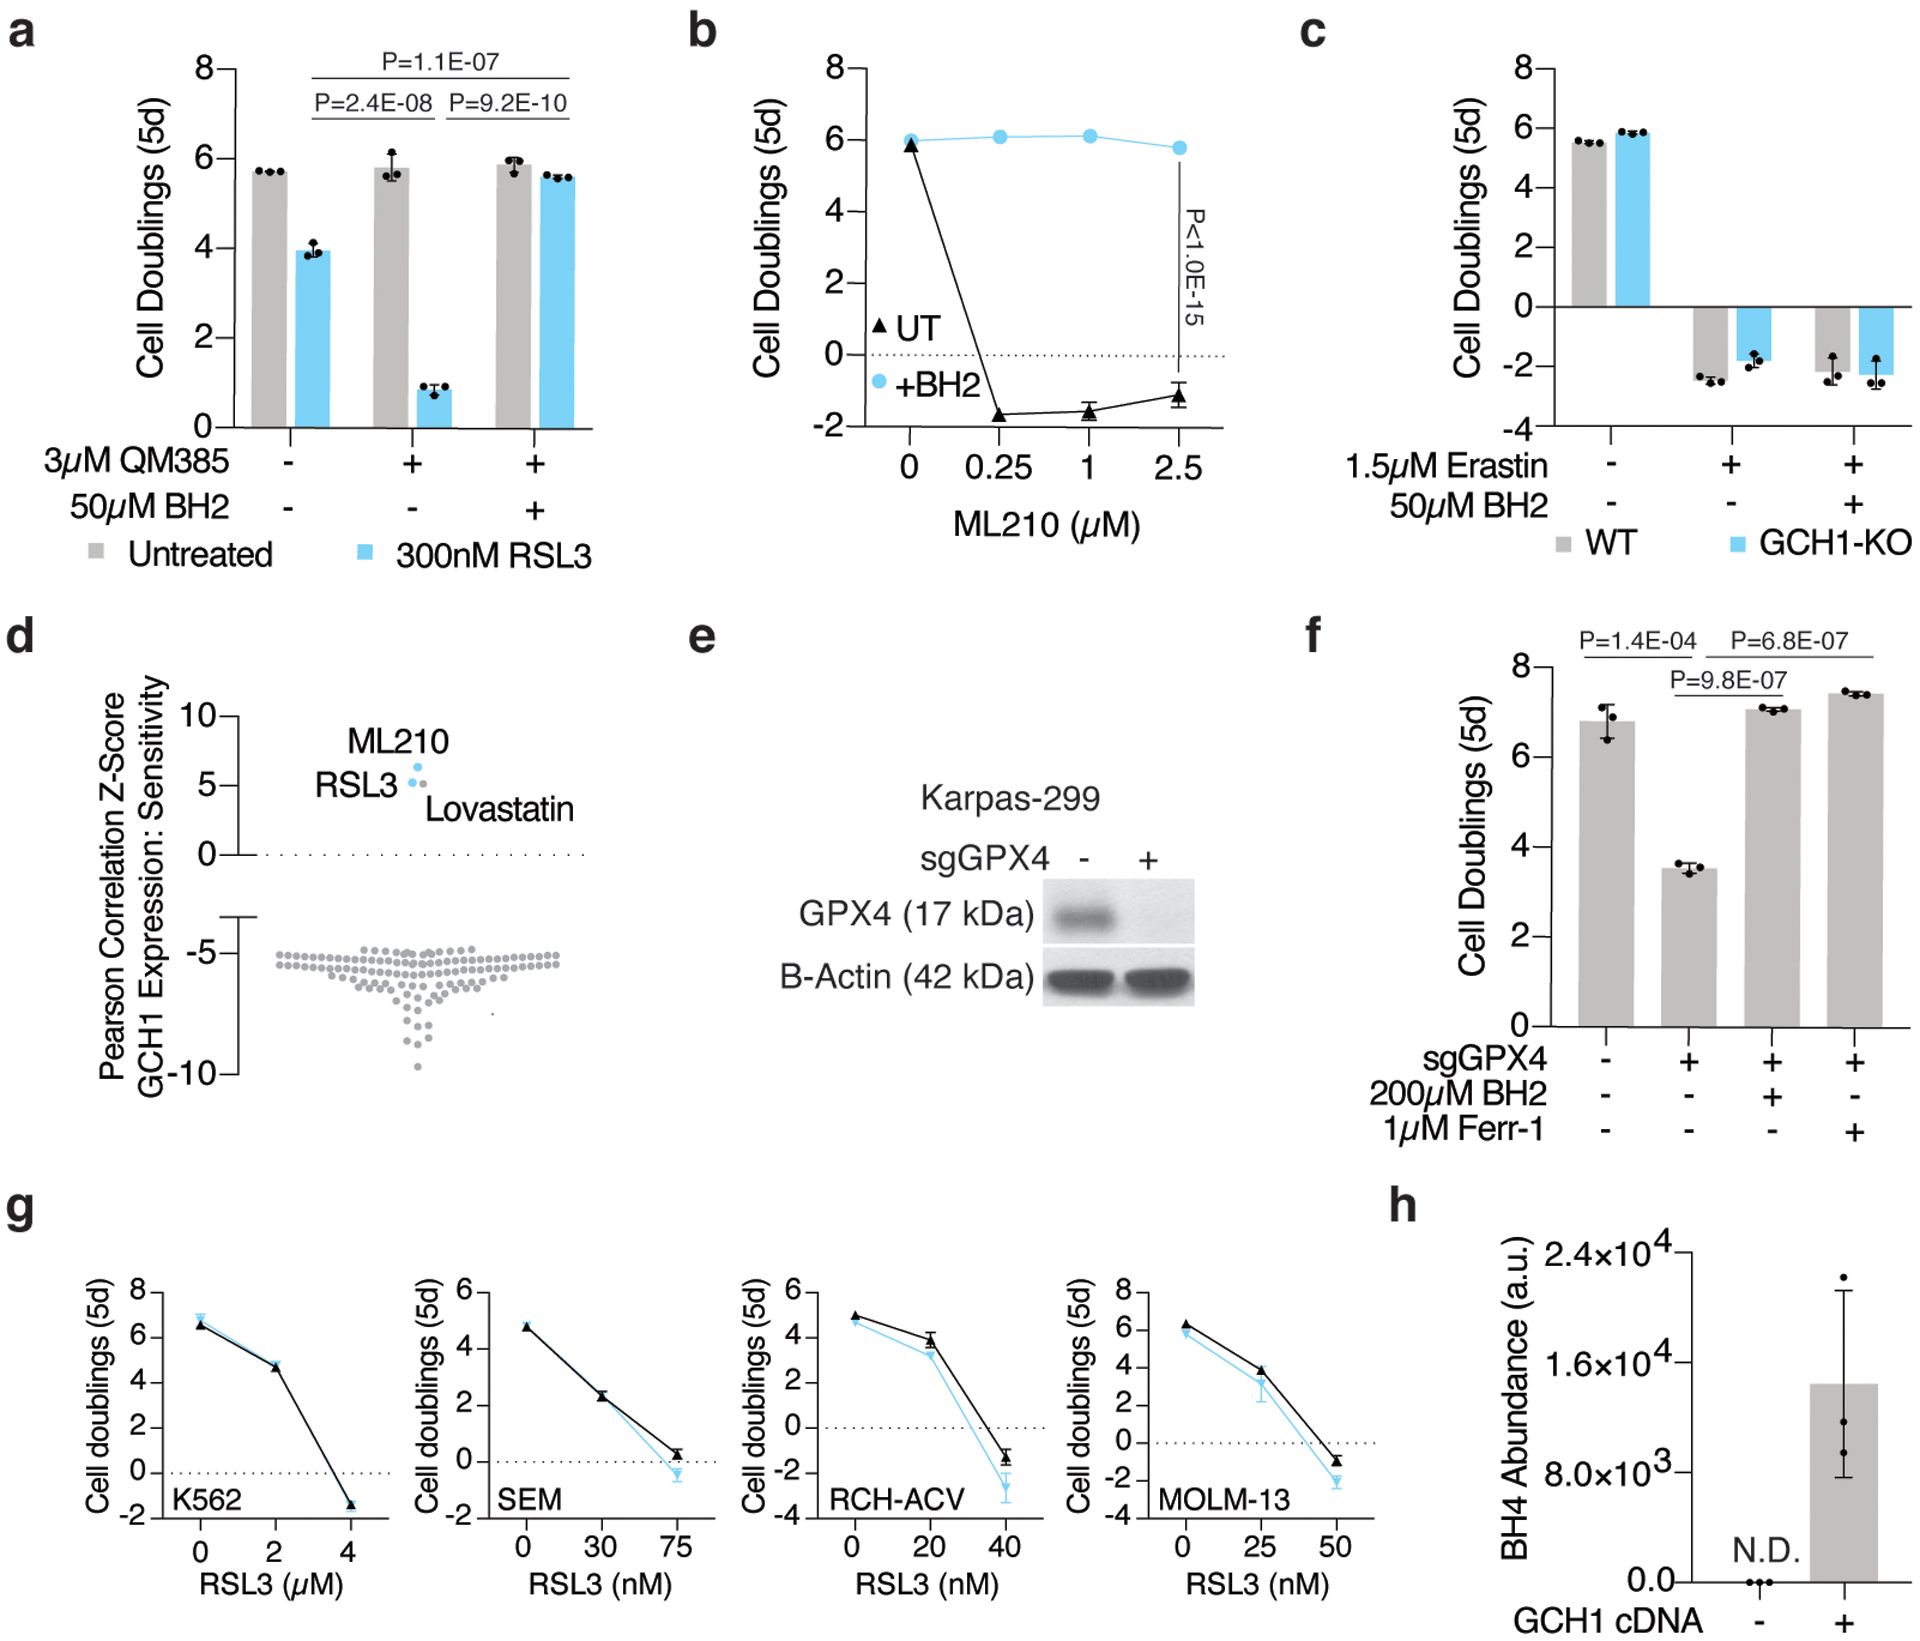
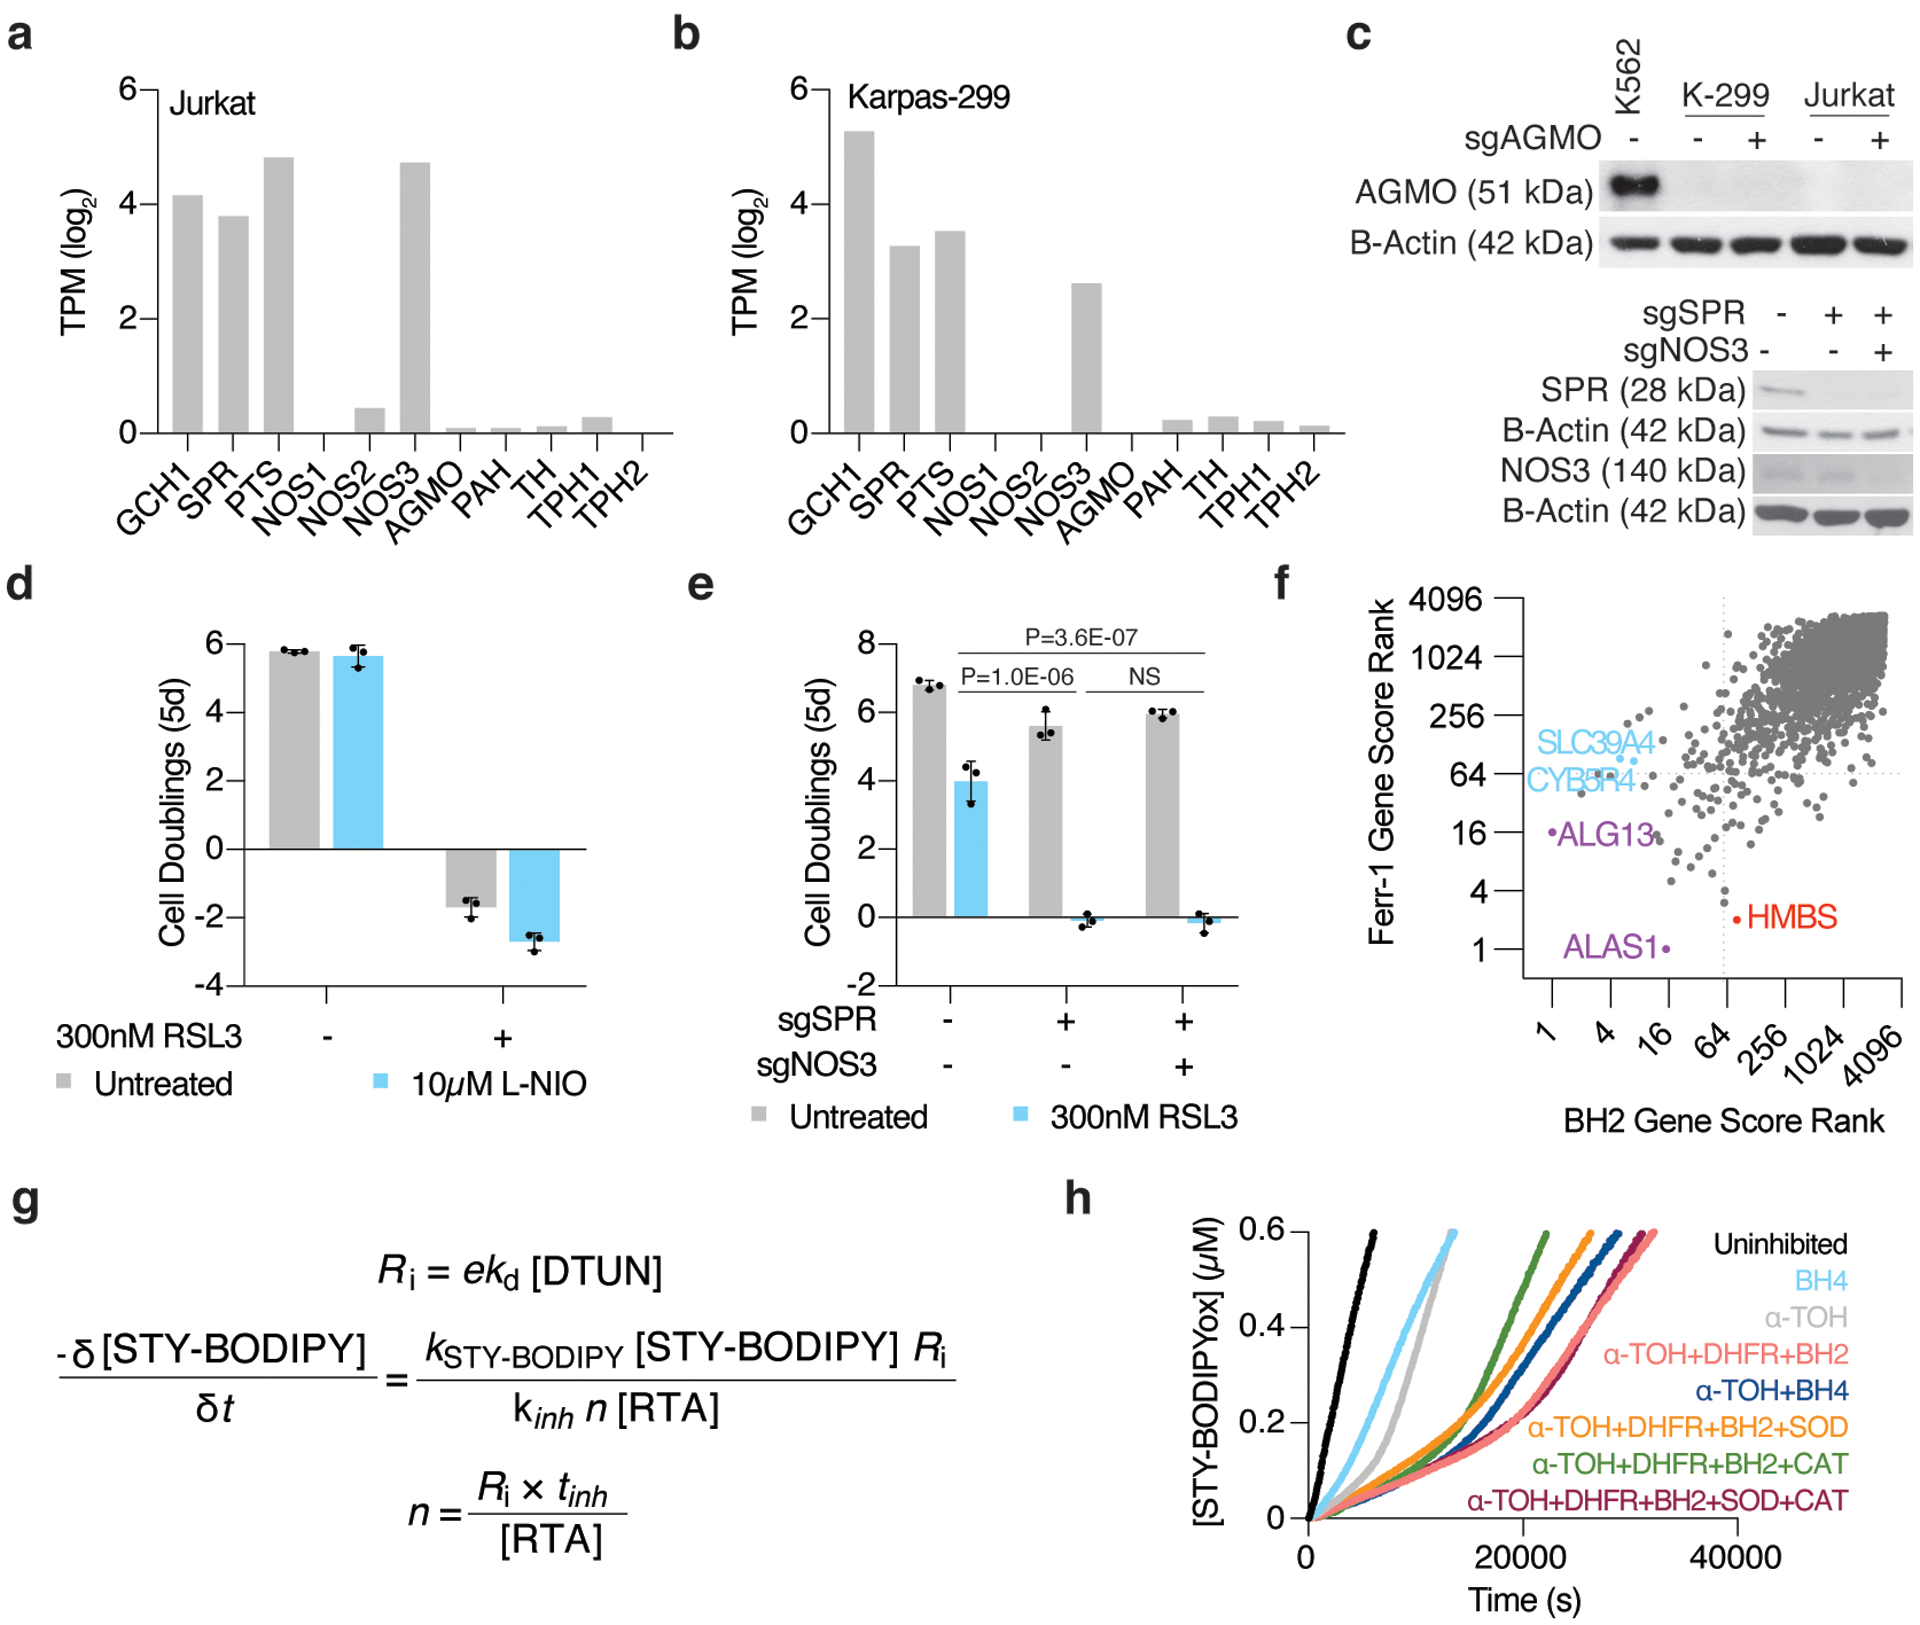
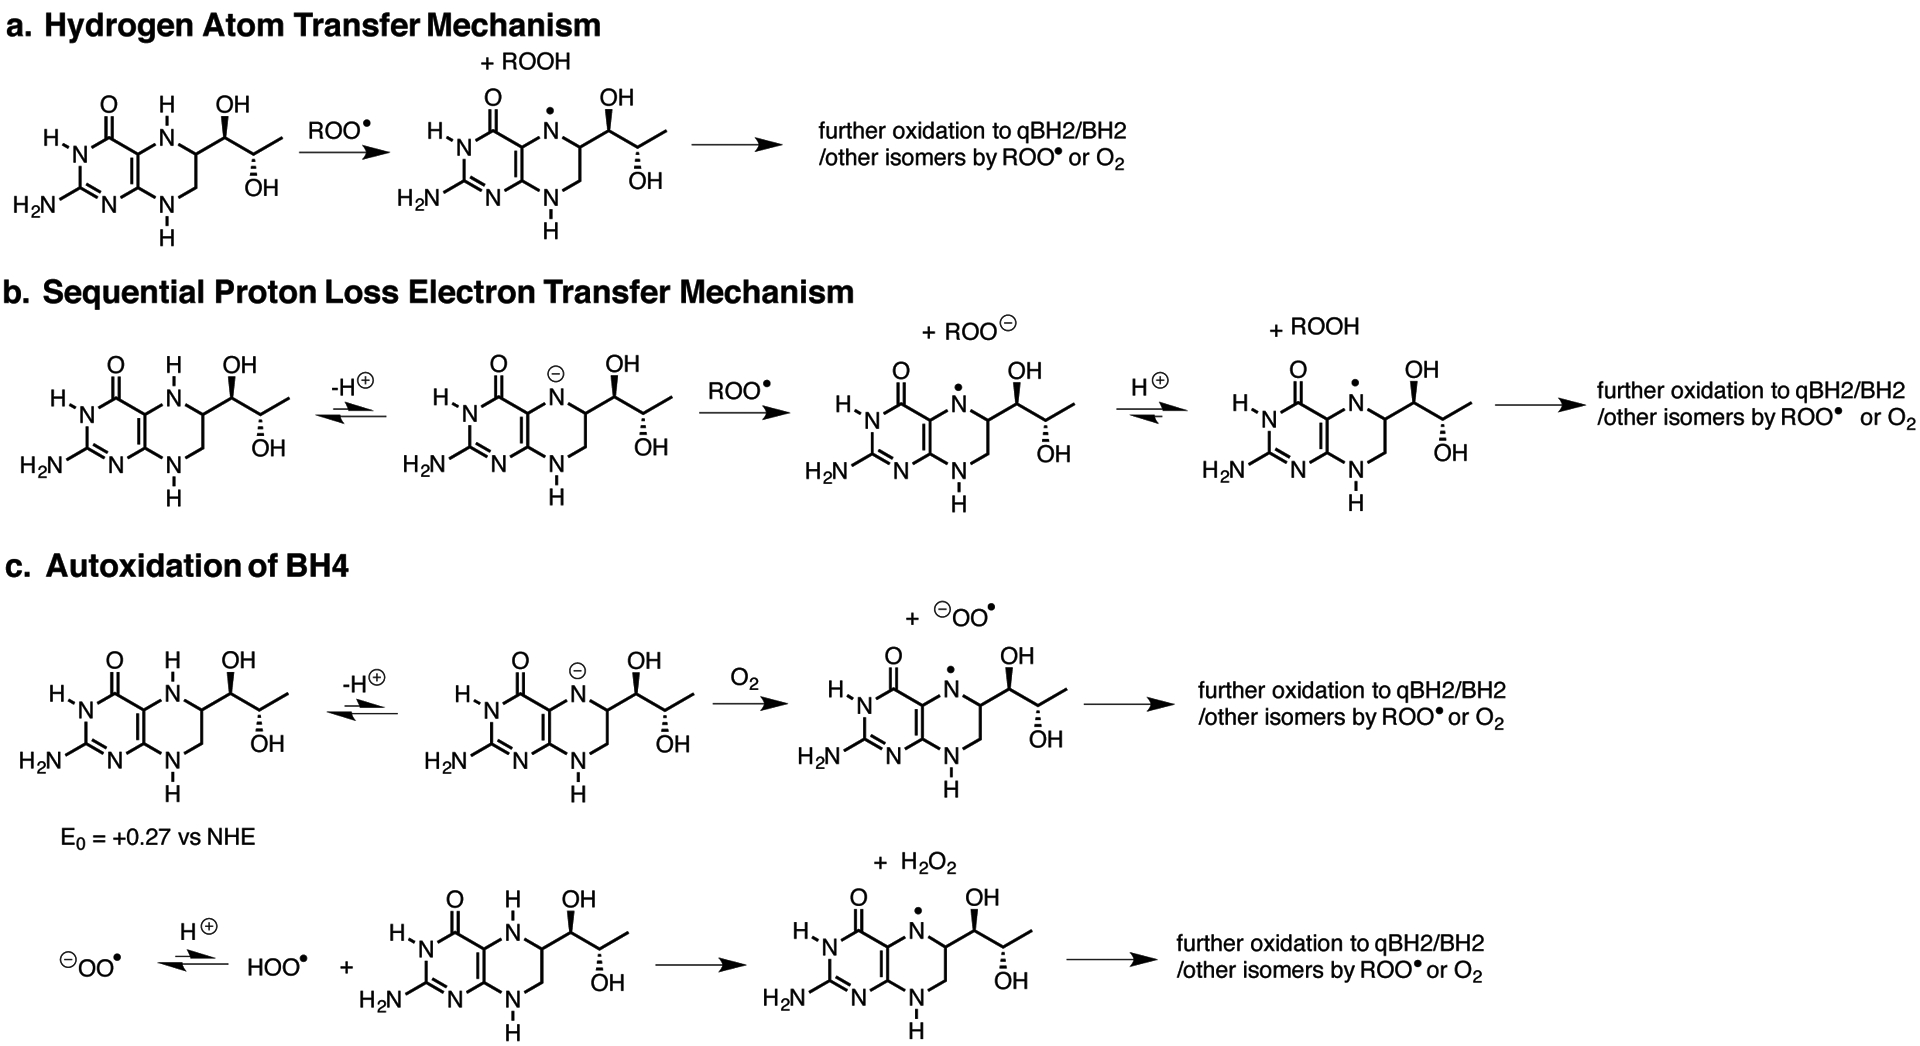
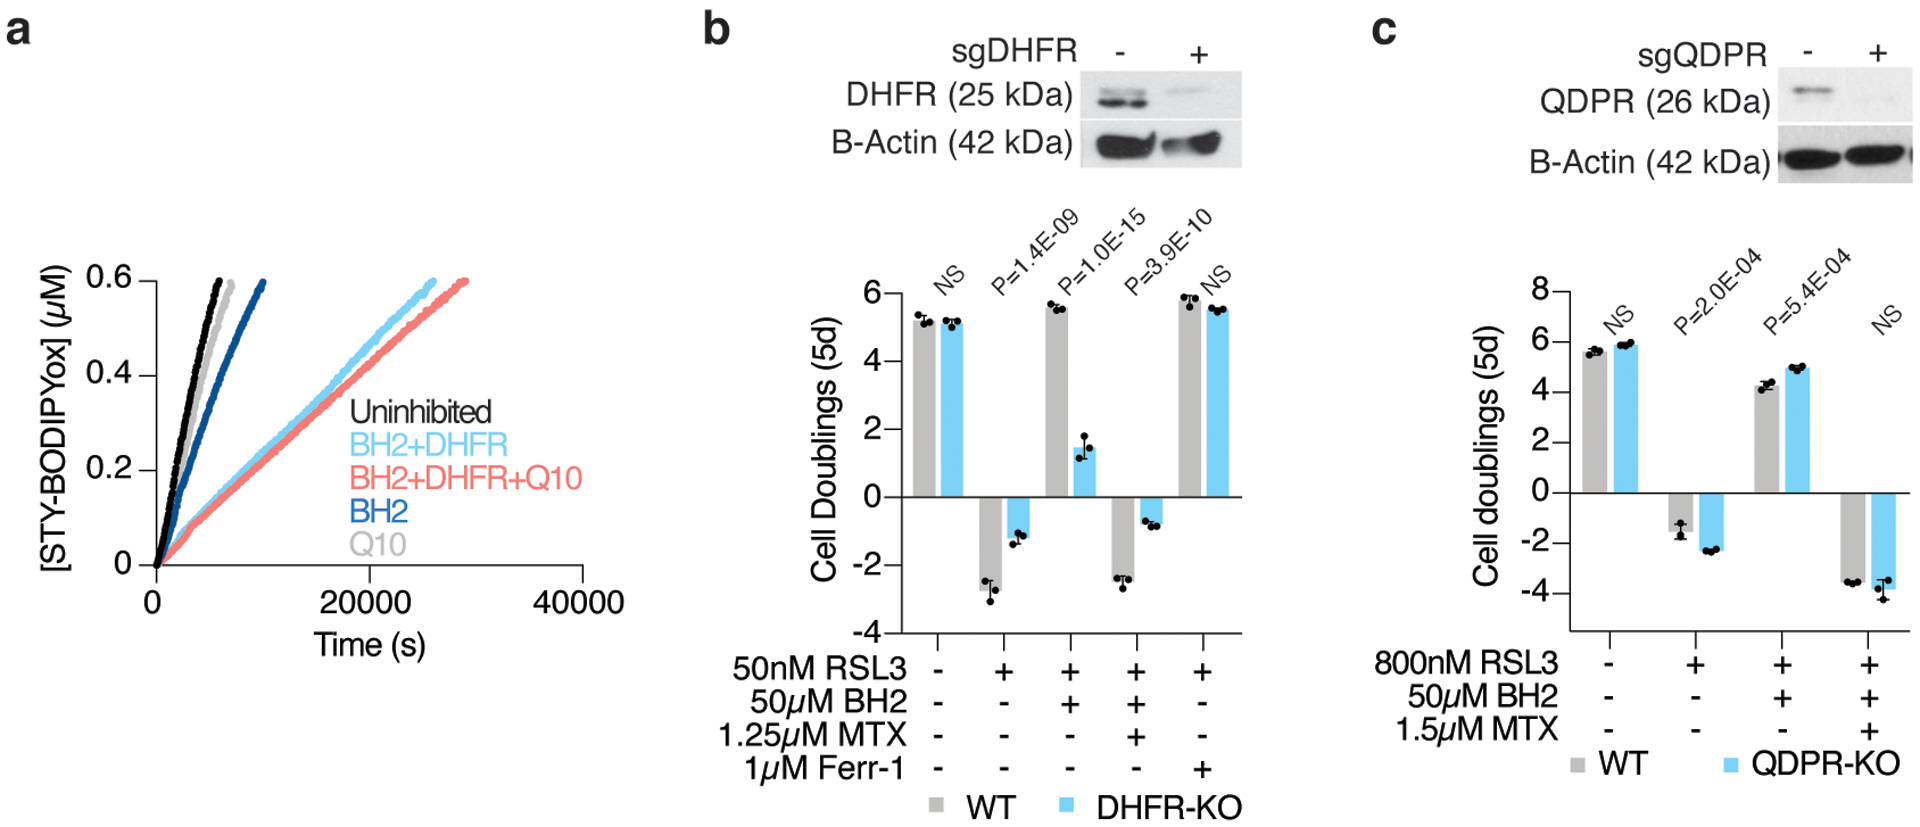
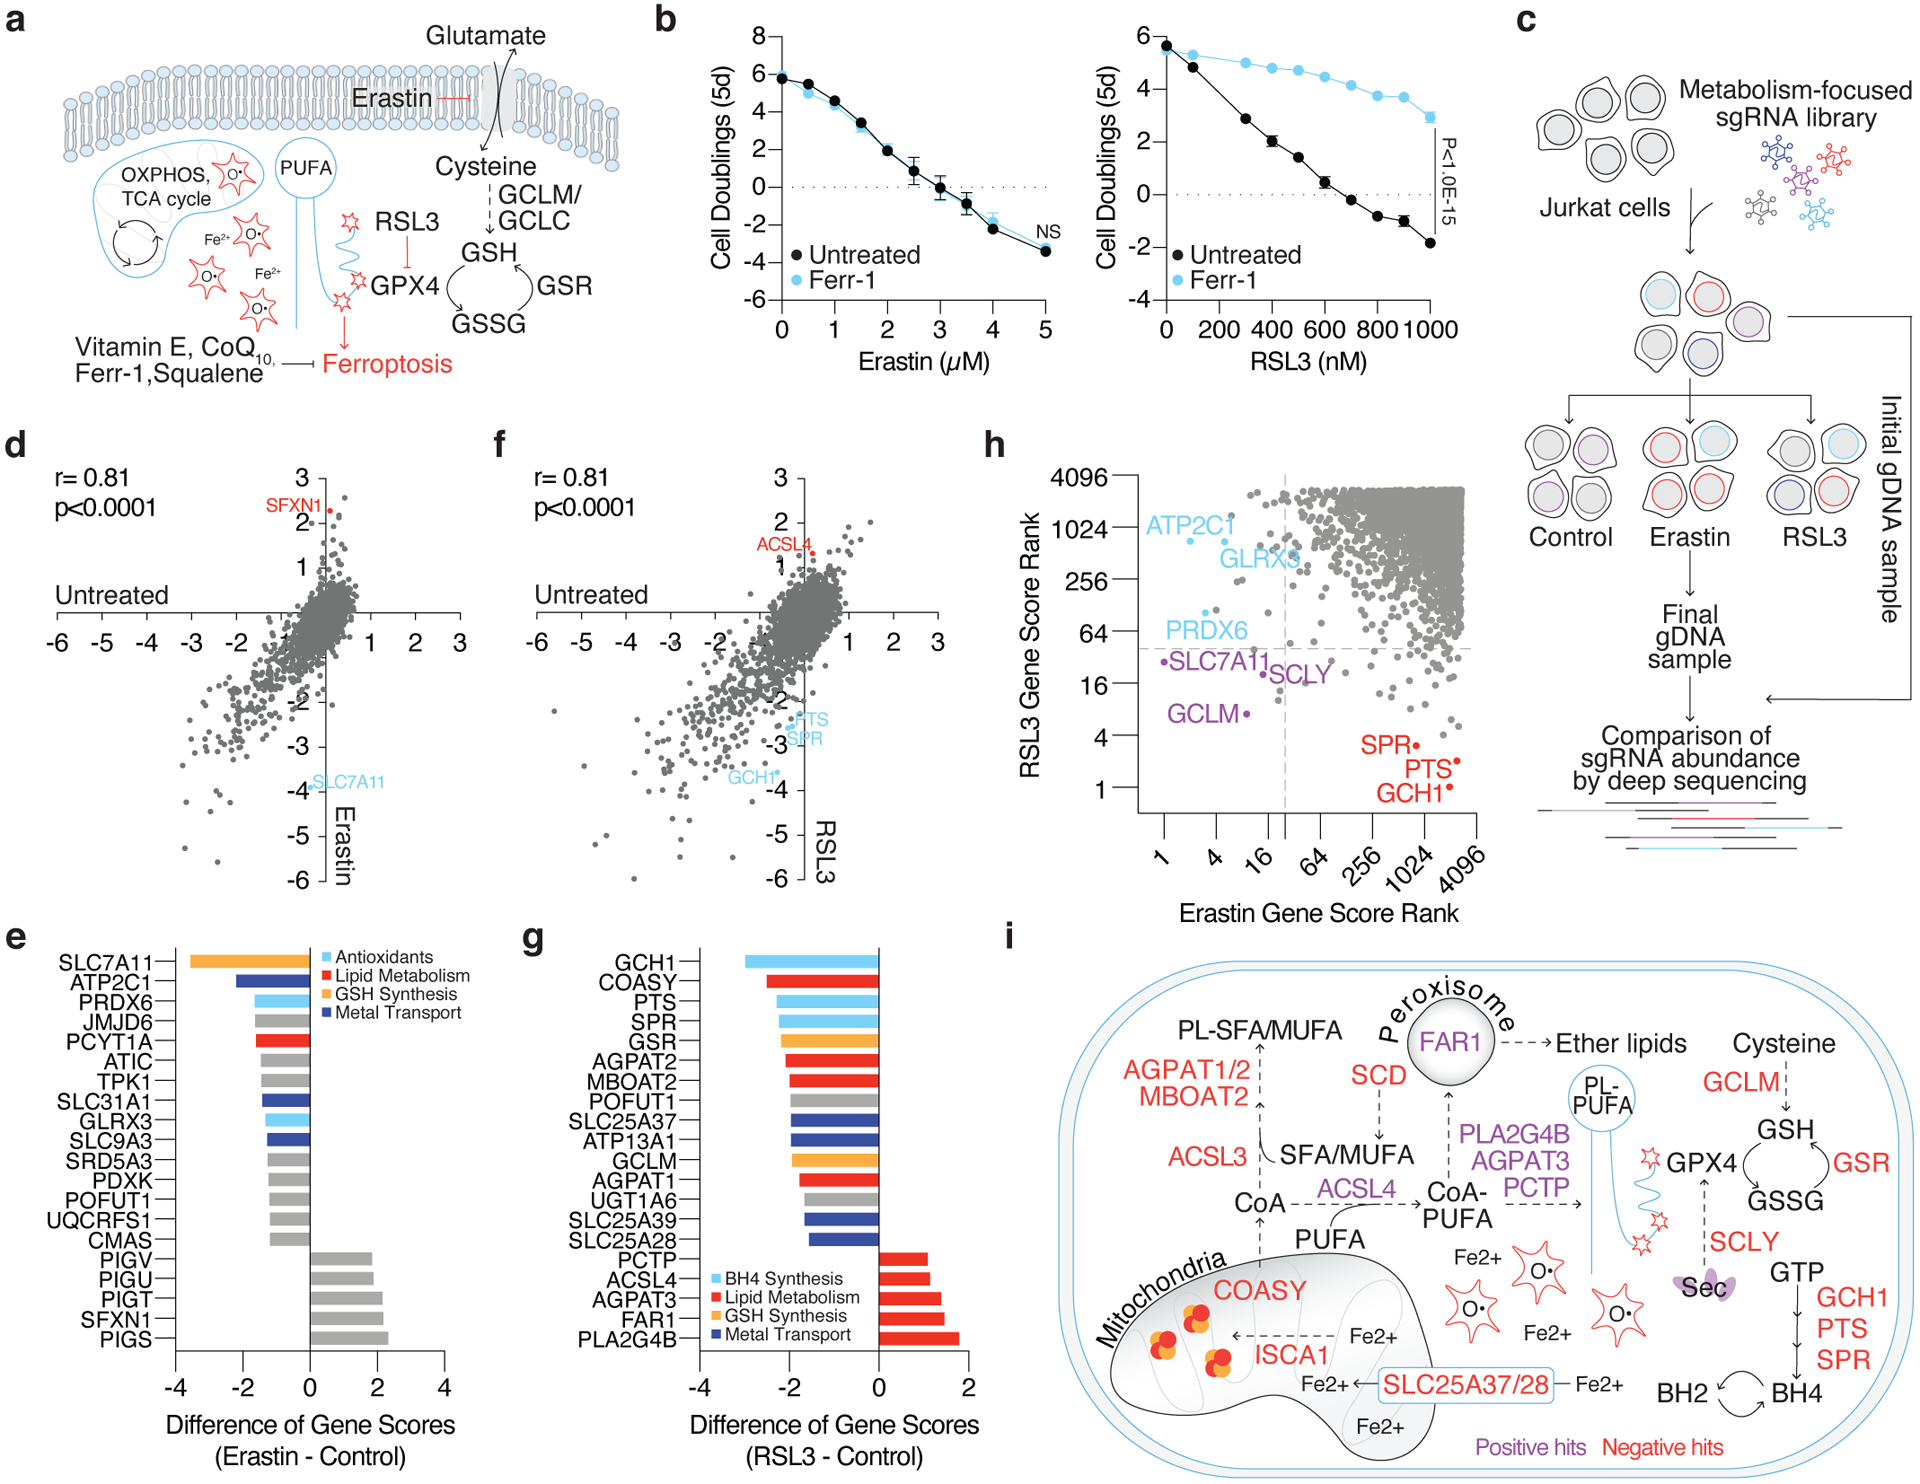
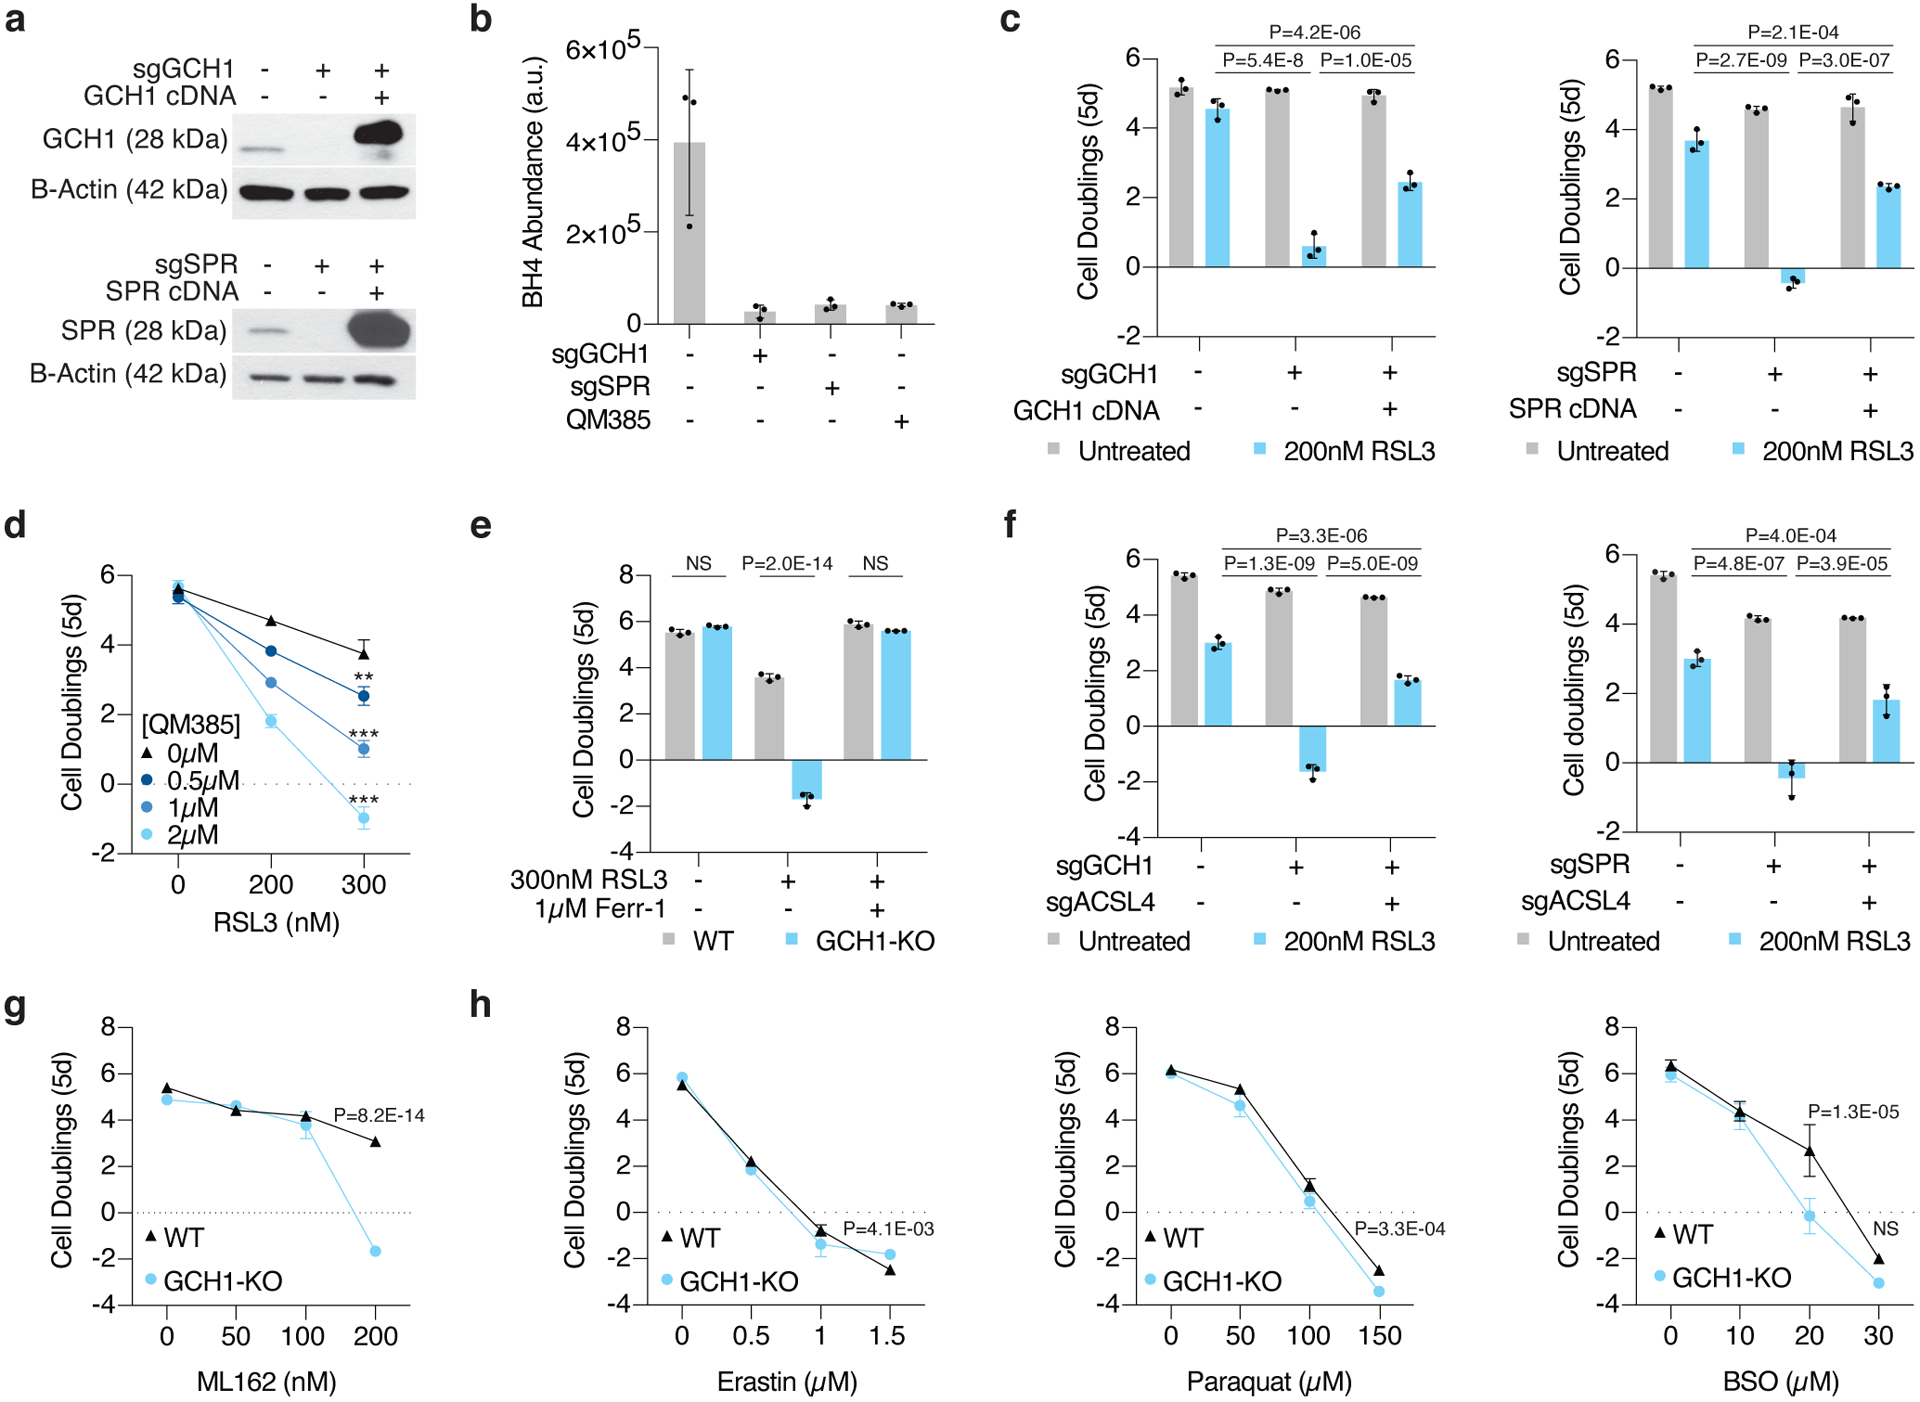
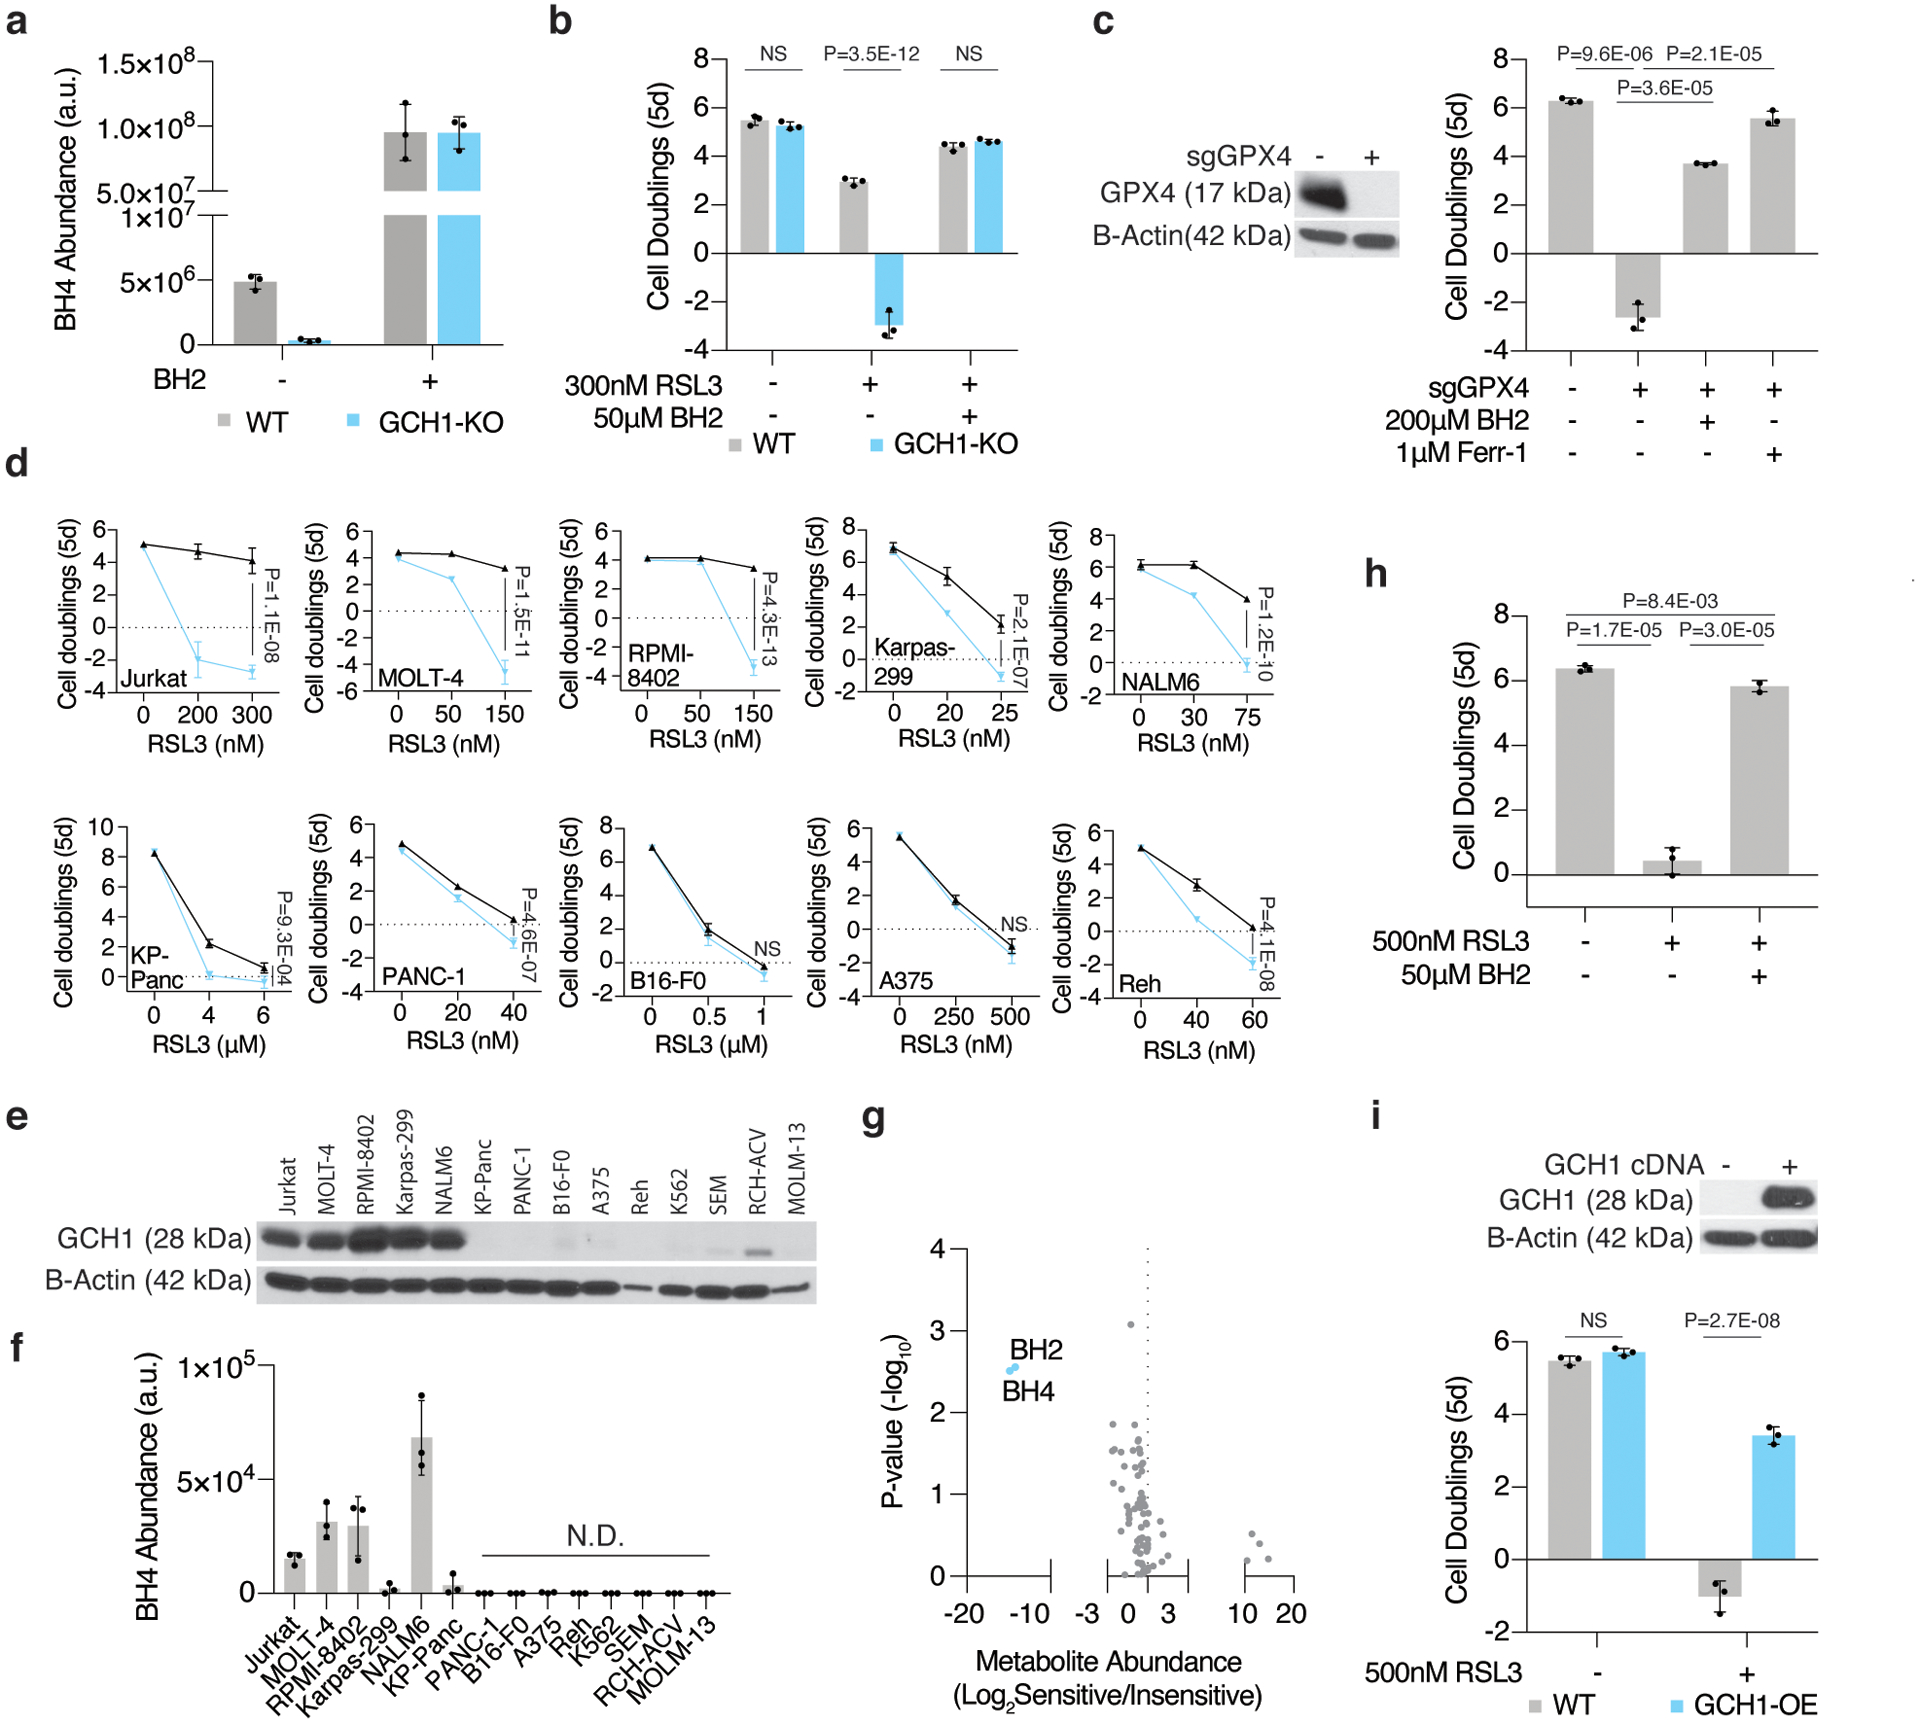
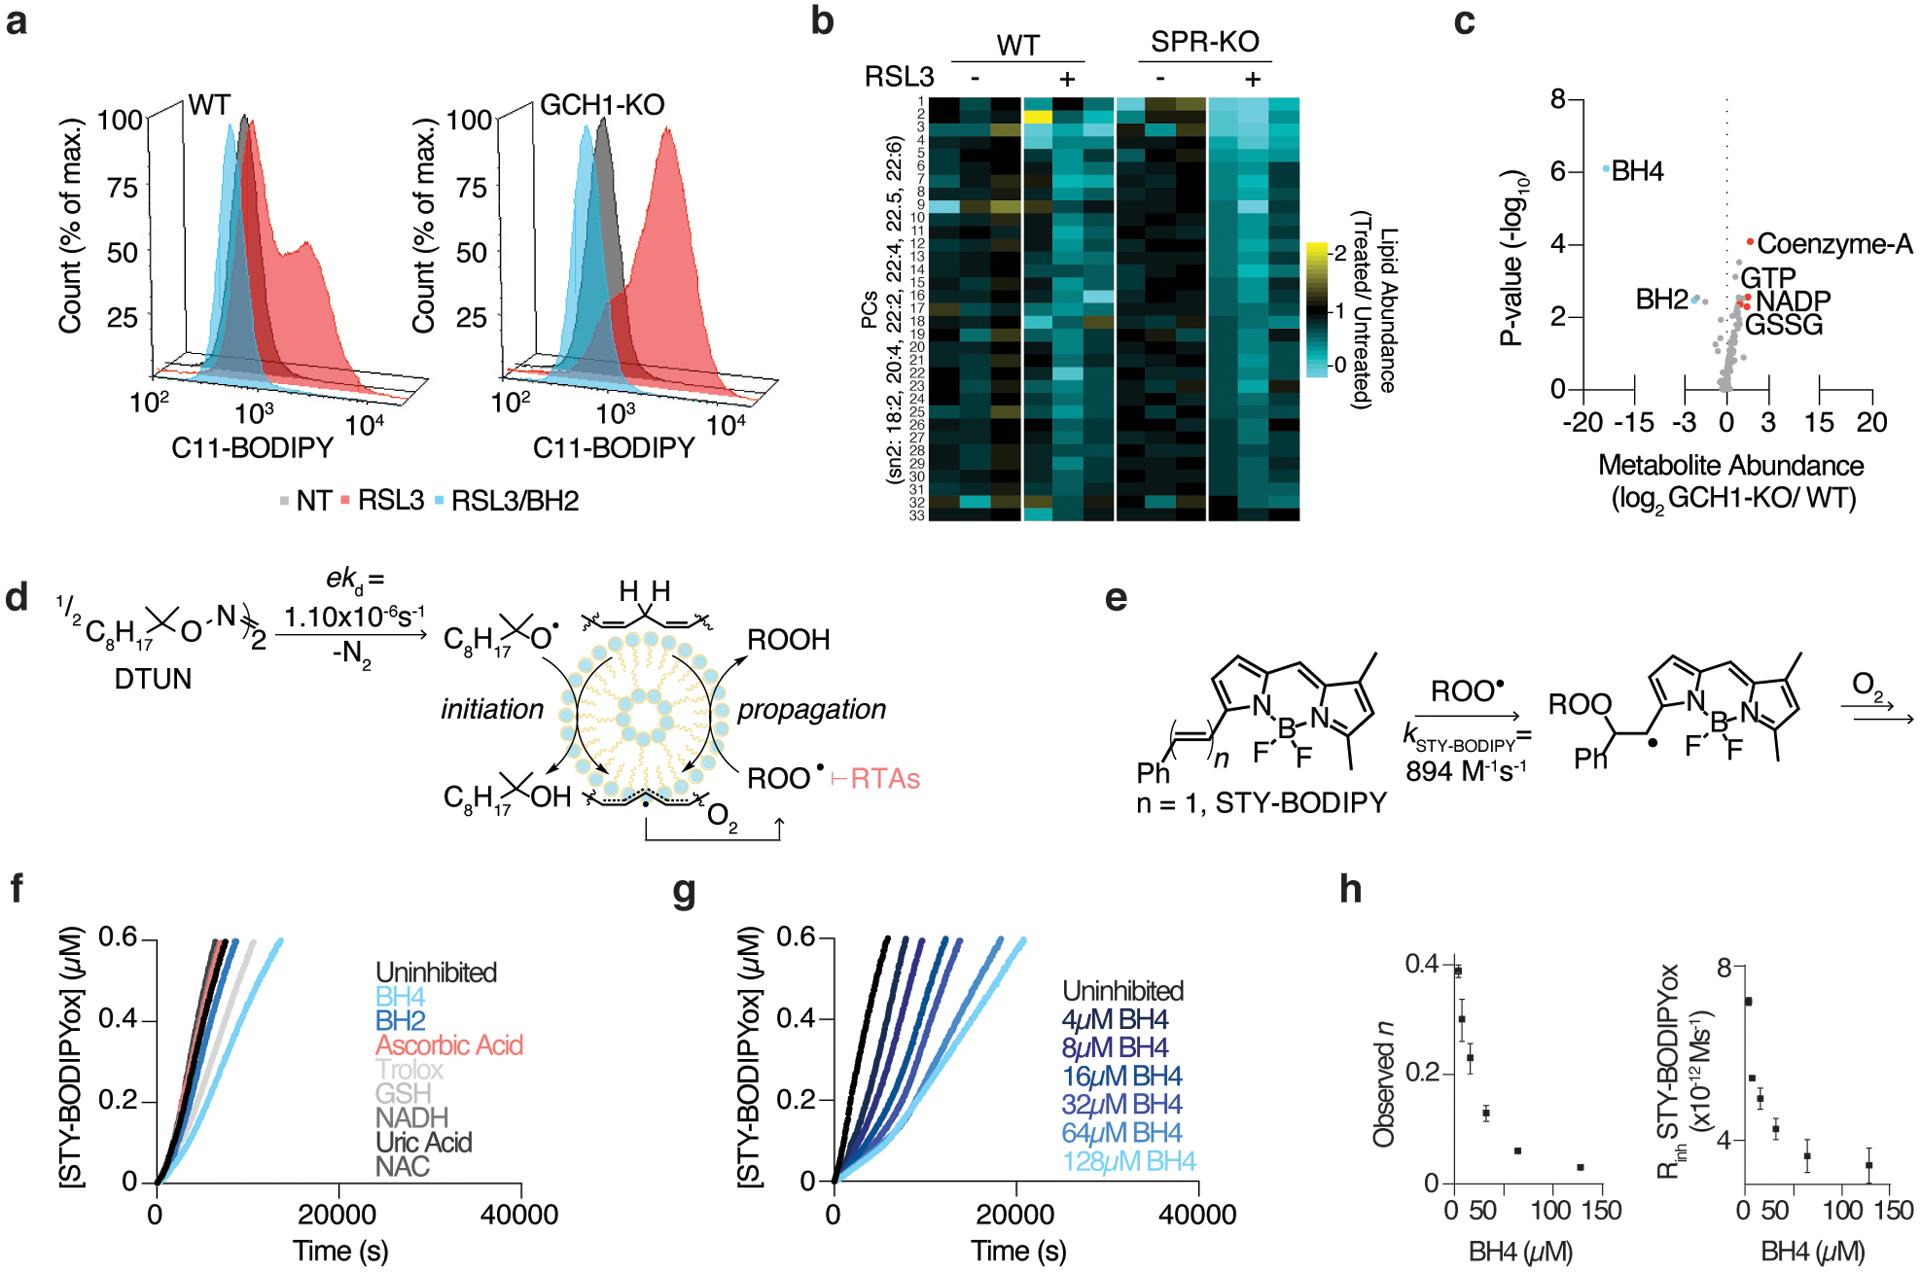
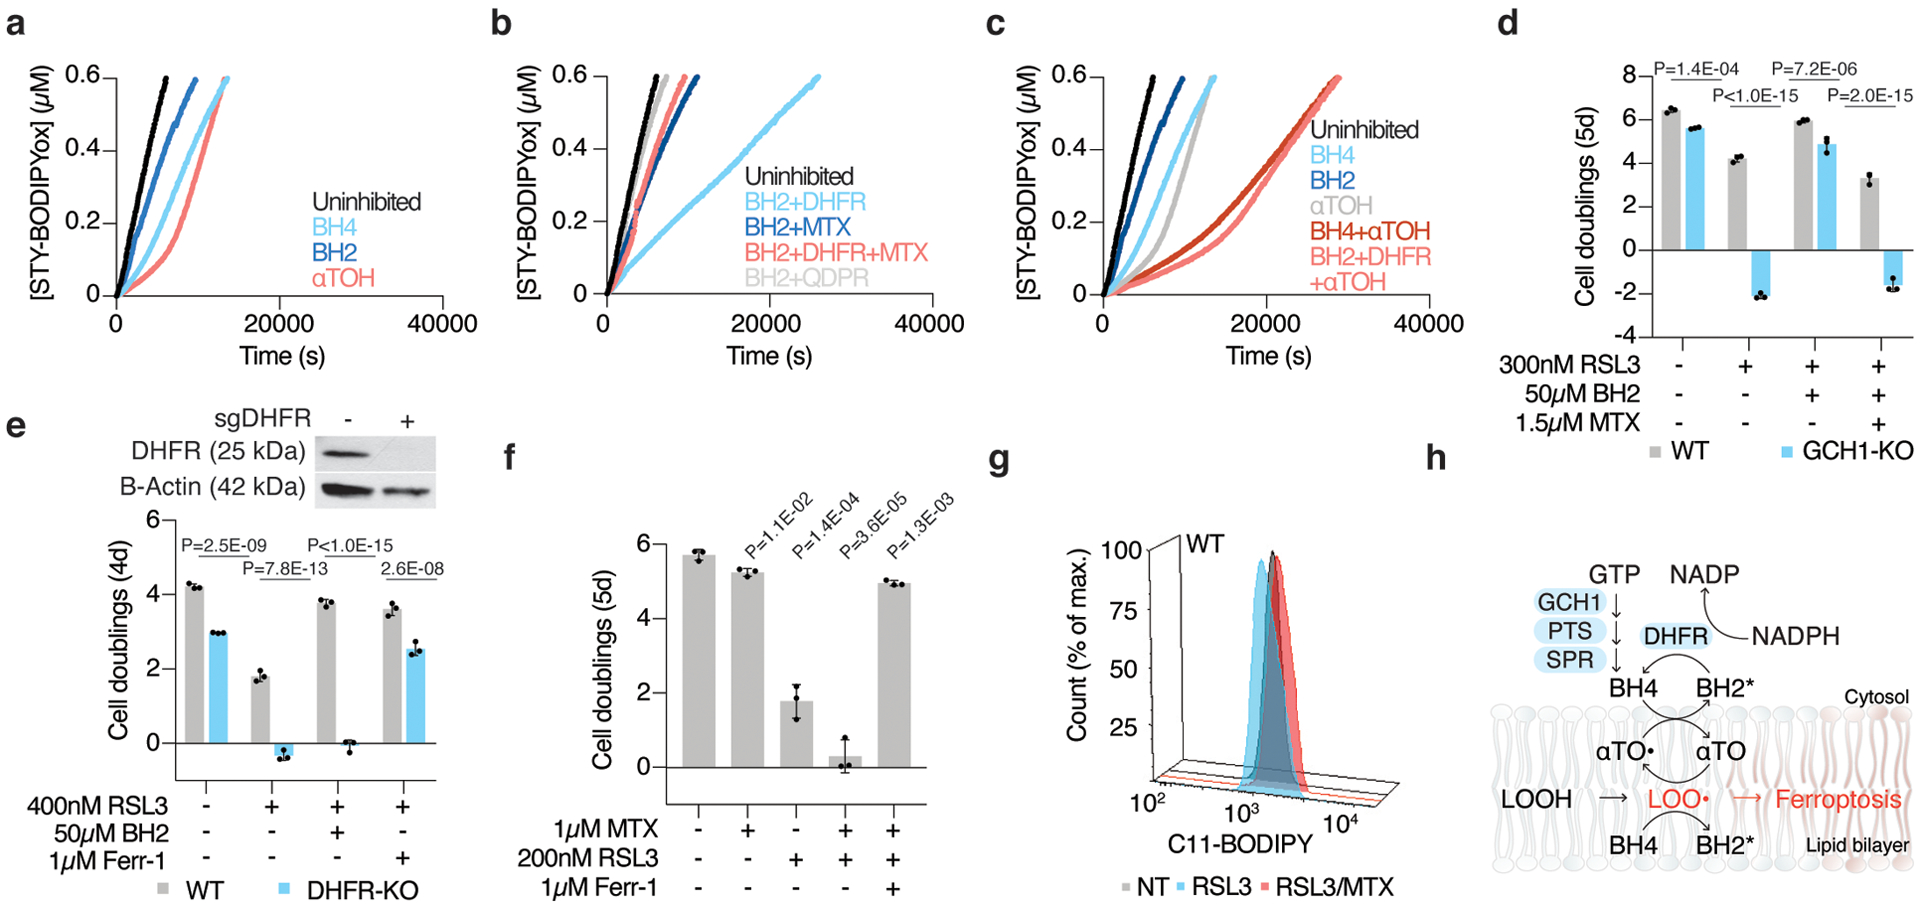
Cancer cells rewire their metabolism and rely on endogenous antioxidants to mitigate lethal oxidative damage to lipids. However, the metabolic processes that modulate the response to lipid peroxidation are poorly defined. Using genetic screens, we compared metabolic genes essential for proliferation upon inhibition of cystine uptake or glutathione peroxidase-4 (GPX4). Interestingly, very few genes were commonly required under both conditions, suggesting that cystine limitation and GPX4 inhibition may impair proliferation via distinct mechanisms. Our screens also identify tetrahydrobiopterin (BH4) biosynthesis as an essential metabolic pathway upon GPX4 inhibition. Mechanistically, BH4 is a potent radical-trapping antioxidant that protects lipid membranes from autoxidation, alone and in synergy with vitamin E. Dihydrofolate reductase catalyzes the regeneration of BH4, and its inhibition by methotrexate synergizes with GPX4 inhibition. Altogether, our work identifies the mechanism by which BH4 acts as an endogenous antioxidant and provides a compendium of metabolic modifiers of lipid peroxidation.


Figures

Extended Data Figure 1:
Extended Data Figure 1:. Cystine depletion and GPX4 inhibition may impact cell proliferation via distinct mechanisms
(A) Fold change in cell number (log2) of wild type Jurkat cells cultured with increasing concentrations of cystine (left, black) or ML162 (right, black) and cotreated with ferrostatin-1 (blue, Ferr-1, 1μM). Data shown as mean ± SD, n=3 biological replicates. (B) Fold change in cell number (log2) of wild type Jurkat cells treated with erastin (right, black) or RSL3 (left, black) and co-treated with necrostatin-1 (blue, Nec-1, 10μM). Data shown as mean ± SD, n=3 biological replicates. (C) Fold change in cell number (log2) of wild type Jurkat cells treated with erastin (right, black) or RSL3 (left, black) and co-treated with Q-VD-OPh (blue, 20μM). Data shown as mean ± SD, n=3 biological replicates. (D) Representative immunoblot analysis of procaspase-3 (top) and cleaved caspase-3 (middle) in wild type Jurkat cells left untreated or treated for 12 hours with erastin (50μM) alone or cotreated with ferrostatin-1 (Ferr-1, 1μM) or Q-VD-OPh (20μM). B-actin was used as a loading control (bottom). (E) Fold change in cell number (log2) of wild type MIA PaCa-2 cells treated with erastin (5μM) and co-treated with Q-VD-OPh (20μM) or ferrostatin-1 (Ferr-1, 1μM). Data shown as mean ± SD, n=3 biological replicates.
Extended Data Figure 2:
Extended Data Figure 2:. CRISPR-Cas9 genetic screens identify metabolic regulators of the cellular response to cystine depletion and GPX4 inhibition
(A) Gene scores of Jurkat cells left untreated (x-axis) or cultured in low cystine (10μM, y-axis). (B) Top-scoring genes under low cystine conditions. Negative scores represent genes whose loss potentiates low cystine toxicity while positive scores represent genes whose loss provides resistance to low cystine. (C) Gene scores of untreated (x-axis) and erastin treated (3μM, y-axis) Jurkat cells. (D) Significantly enriched pathways (REACTOME) represented within the top 50 most essential genes in the low dose erastin screen. (E) Significantly enriched pathways (REACTOME) represented within the top 50 most essential genes in the RSL3 screen.
Extended Data Figure 3:
Extended Data Figure 3:. SFXN1 loss enables cell proliferation under cystine depletion
(A) Representative immunoblot analysis of SFXN1 in wild type, SFXN1 knockout, and FLAG-SFXN1 cDNA expressing Jurkat cells (top). GAPDH was used as a loading control (bottom). (B) Fold change in cell number (log2) of wild type, SFXN1 knockout, and FLAG-SFXN1 cDNA expressing Jurkat cells left untreated (gray) or treated with erastin (left, blue, 3μM) or cultured in low cystine (right, blue, 4μM). Data shown as mean ± SD, n=3 biological replicates. (C) Relative fold change in SLC7A11 mRNA transcripts in HEK 293T cells left untreated (gray) or treated with erastin (top, blue, 3μM for 24 hours) or cultured in cystine-depleted media (bottom, blue, 5μM for 24 hours). Data shown as mean ± SD, n=3, (D) Representative immunoblot analysis of SLC7A11 in wild type or SFXN1-null HEK 293T cells left untreated or treated with erastin (top, 3μM for 24 hours) or cultured in cystine-depleted media (bottom, 5μM for 24 hours). CTH was used as a marker of cysteine depletion and GAPDH was used as a loading control. (E) Fractional labeling of glutathione from 13C3-labeled cysteine in whole cell and mitochondrial lysates obtained from HEK 293T cells. Data shown as mean ± SD, n=3 biological replicates.
Extended Data Figure 4:
Extended Data Figure 4:. Characterization of SFXN1 knockout cells
(A) Phylogenic tree of the five human sideroflexin paralogs generated from BIONJ clustering using uncorrected pairwise differences from uncorrected pairwise differences of Clustal Omega alignments. From these analyses, SFXN3 is the closest paralog to SFXN1. Mass spectrometric analyses on 3xFLAG-SFXN1 immunoprecipitants, revealed protein-protein interactions with SFXN1 and SFXN3. (B) Representative immunoblot analyses of various SFXN1 and SFXN3 constructs from input, FLAG, and HA immunoprecipitants of SFXN1 knockout HEK 293T cells. (C) Fold change in cell number (log2) of wild type, SFXN1 knockout, and HA-SFXN3 cDNA expressing Jurkat cells untreated (gray) or treated with erastin (blue, 3μM). Data shown as mean ± SD, n=3 biological replicates. (D) Representative immunoblot analysis of SHMT2 in wild type and SHMT2 knockout Jurkat cells (top). Fold change in cell number (log2) of wild type (gray), SFXN1 knockout (blue), and SHMT2 knockout (red) Jurkat cells untreated or treated with erastin (2μM). Data shown as mean ± SD, n=3 biological replicates. (E) Abundance of 85 polar metabolites in whole cell lysates of HEK 293T cells. Data shown as the ratio of metabolite abundance in SFXN1-null cells to wild type cells (log2, x-axis) versus significance of difference between the median abundances of each metabolite in both groups (−log10p-value, y-axis).
Extended Data Figure 5:
Extended Data Figure 5:. BH4 availability determines cancer cell sensitivity to ferroptosis
(A)Relative abundance of BH4 and its oxidation product, BH2, in wild type Jurkat cells left untreated (gray) or treated with RSL3 (blue, 175nM for 15 hours). Data shown as mean ± SD, n=3 biological replicates. (B) Fold change in cell number (log2) of wild type, PTS knockout, and PTS/ACSL4 double knockout Jurkat cells untreated (gray) or treated with 200nM RSL3 (blue). Data shown as mean ± SD, n=3 biological replicates. (C) Fold change in cell number (log2) of wild type, GCH1, SPR, and PTS knockout Karpas-299 cells untreated (gray) or treated with 50nM RSL3 (blue). Data shown as mean ± SD, n=3 biological replicates. (D) Fold change in cell number (log2) of wild type, GCH1 (left), SPR (middle), and PTS (right) knockout, and respective ACSL4 double knockout Jurkat cells left untreated (gray) or treated with 200nM ML162 (blue). Data shown as mean ± SD, n=3 biological replicates.
Extended Data Figure 6:
Extended Data Figure 6:. GCH1 expression predicts dependence on BH4 upon ferroptosis induction
(A) Fold change in cell number (log2) of wild type Jurkat cells left untreated (gray) or treated with RSL3 (300nM, blue), cotreated with or without QM385 (3μM) and supplemented with BH2 (50μM). Data shown as mean ± SD, n=3 biological replicates. (B) Fold change in cell number (log2) of wild type Karpas-299 cells treated with ML210 only (black trace) or supplemented with BH2 (blue trace, 50μM). Data shown as mean ± SD, n=3 biological replicates. (C) Fold change in cell number (log2) of wild type (gray) and GCH1-KO (blue) Jurkat cells treated with erastin (1.5μM) and supplemented with BH2 (50μM). Data shown as mean ± SD, n=3 biological replicates. (D) Z-scores of correlations between GCH1 mRNA levels and resistance to small molecule probes and drugs across cancer cell lines (CTRP v2, 2015). (E) Representative immunoblot analysis of GPX4 in wild type and GPX4 knockout Karpas-299 cells. B-actin was used as a loading control. (F) Fold change in cell number (log2) of wild type and GPX4 knockout Karpas-299 cells supplemented with BH2 (200μM) or ferrostatin-1 (Ferr-1, 1μM). Data shown as mean ± SD, n=3 biological replicates. (G) Fold change in cell number (log2) of a panel of cancer cell lines that are not sensitive to GPX4 inhibition upon BH4 depletion (blue traces, cotreated with 3μM QM385). Data shown as mean ± SD, n=3 biological replicates. (H) BH4 abundance in wild type and GCH1 over-expressing A375 cells. Data shown as mean ± SD, n=3 biological replicates.
Extended Data Figure 7:
Extended Data Figure 7:. BH4 protects cells from ferroptosis in an enzyme-independent manner
(A) RNAseq gene expression data for BH4-associated enzymes in Jurkat cells. Data shown as log2transcript per million (TPM, DepMap). (B) RNAseq gene expression data for BH4-associated enzymes in Karpas-299 cells. Data shown as log2transcript per million (TPM, DepMap). (C) Representative immunoblot analysis of AGMO in Jurkat and Karpas-299 (K-299) cells (top) and of NOS3 in Jurkat cells (bottom). B-actin was used as a loading control and K562 cells were used as a positive control for AGMO expression. (D) Fold change in cell number (log2) and GCH1 knockout Jurkat cells left untreated (gray) or treated with L-NIO (blue, 10μM) cotreated with or without RSL3 (300nM). Data shown as mean ± SD, n=3 biological replicates. (E) Fold change in cell number (log2) of wild type, SPR knockout, and SPR/NOS3 double knockout Jurkat cells left untreated (gray) or treated RSL3 (blue, 300nM). Data shown as mean ± SD, n=3 biological replicates. (F) Comparison of gene score ranks from BH2 and ferrostatin-1 (Ferr-1) rescue screens in Karpas-299 cells. Unique hits (p<0.01) in the BH2 screen are highlighted (blue) in quadrant II, shared hits are highlighted (purple) in quadrant III, and unique hits in the ferrostatin-1 screen are highlighted (red) in quadrant IV. (G) The initial rate and inhibited period of STY-BODIPY consumption is used to derive the rate constant and stoichiometry of added RTAs. (H) Representative autoxidations of STY-BODIPY (1μM)-embedded liposomes of egg phosphatidylcholine lipids (1mM, ~100nm particle size) suspended in phosphate-buffered saline pH 7.4 at 37°C initiated by 0.2mM DTUN in the presence of NADPH (60μM) with BH4 (4μM), BH2, α-tocopherol (5μM), DHFR (50nM), and 50 U/mL each of superoxide dismutase (SOD) and catalase (CAT).
Extended Data Figure 8:
Extended Data Figure 8:. Possible mechanisms for lipid peroxyl radical trapping by BH4
(A) Hydrogen atom transfer from BH4 to yield a BH3 (aminyl) radical that has various fates. (B) Sequential proton loss electron transfer to yield a BH3 (aminyl) radical that has various fates. (C) Competing initiation and propagation of BH4 autoxidation.
Extended Data Figure 9:
Extended Data Figure 9:. DHFR regenerates BH4 efficiently
(A) Representative autoxidations of STY-BODIPY (1μM)-embedded liposomes of egg phosphatidylcholine lipids (1mM, ~100nm particle size) suspended in phosphate-buffered saline pH 7.4 at 37°C initiated by 0.2mM DTUN containing 60μM NADPH, BH2 (10μM), CoQ10 (5μM), and DHFR (50nM) as indicated. (B) Representative immunoblot analysis (top) of DHFR in wild type and DHFR knockout Karpas-299 cells. B-actin was used as a loading control. Fold change in cell number (bottom, log2) of wild type (gray) and DHFR knockout (blue) Karpas-299 cells left untreated or treated with RSL3 (50nM), cotreated with or without methotrexate (MTX, 1.25μM), and supplemented with BH2 (50μM) or ferrostatin-1 (Ferr-1, 1μM). Data shown as mean ± SD, n=3 biological replicates. (C) Representative immunoblot analysis (top) of QDPR in wild type and QDPR knockout Jurkat cells. B-actin was used as a loading control. Fold change in cell number (bottom, log2) of wild type (gray) and QDPR knockout (blue) Jurkat cells left untreated or treated with RSL3 (800nM), cotreated with or without methotrexate (MTX, 1.5μM), and supplemented with BH2 (50μM). Data shown as mean ± SD, n=3 biological replicates.
Figure 1:
Figure 1:. Metabolism focused CRISPR-Cas9 screens identify metabolic modifiers of lipid peroxidation upon cystine deprivation and GPX4 inhibition
(A) Iron reacts with hydrogen peroxide via the Fenton reaction to produce hydroxyl radicals that damage poly-unsaturated fatty acids (PUFAs). To mitigate lipid peroxidation, cells utilize GPX4, which reduces lipid peroxides at the expense of glutathione (GSH). Alternatively, endogenous antioxidants can quench ROS and lipid peroxides. The accumulation of lipid peroxides either by inhibition of cystine uptake (erastin) or GPX4 (RSL3) induces ferroptosis. (B) Fold change in cell number (log2) of wild type Jurkat cells treated with erastin (left, black) or RSL3 (right, black) and co-treated with ferrostatin-1 (Ferr-1, blue, 1μM). Data shown as mean ± SD, n=3 biological replicates. (C) Jurkat cells were transduced with a metabolism-focused library of sgRNAs targeting ~3,000 genes. Transduced cells were cultured without treatment, with erastin (0.5μM), or with RSL3 (0.5μM) for ~14 population doublings. Cells were collected and their genomic DNA (gDNA) isolated. sgRNA abundance was determined by deep sequencing and final sgRNA counts were compared to initial counts to calculate the median differential score for each gene. (D) Gene scores of untreated (x-axis) and erastin treated (y-axis) Jurkat cells. (E) Top-scoring genes under erastin treatment. Negative scores represent genes whose loss potentiates erastin toxicity while positive scores represent genes whose loss provides resistance to erastin. (F) Gene scores of untreated (x-axis) and RSL3 treated (y-axis) Jurkat cells. (G) Top-scoring genes under RSL3 treatment. Negative scores represent genes whose loss potentiates RSL3 toxicity while positive scores represent genes whose loss provides resistance to RSL3. (H) Comparison of gene score ranks from erastin and RSL3 screens. Unique hits (p<0.01) in the erastin screen are highlighted (blue) in quadrant II, shared hits are highlighted (purple) in quadrant III, and unique hits in the RSL3 screen are highlighted (red) in quadrant IV. (I) Summary of positive and negative hits of the RSL3 screen. Red signifies genes essential for survival under GPX4 inhibition (negative hits) and purple signifies genes whose loss provided a proliferative advantage (positive hits).
Figure 2:
Figure 2:. Loss of SFXN1 enables cell proliferation under cystine depletion
(A) Representative immunoblot analysis of SFXN1 in HEK 293T wild type cells and SFXN1 knockout cells with or without FLAG-SFXN1 cDNA (top). GAPDH was used as a loading control (bottom). (B) Fold change in cell number (log2) of HEK 293T SFXN1 knockout cells with or without FLAG-SFXN1 cDNA left untreated (gray), treated with erastin (left, blue, 3μM), or cultured in low cystine (right, blue, 4μM). Data shown as mean ± SD, n=3 biological replicates. (C) Representative immunoblot analysis of cytosolic (PKM2 and GAPDH) and mitochondrial (SFXN1, VDAC, and CS) markers in input, purified mitochondria, or control immunoprecipitates. Lysates were prepared from HEK 293T cells expressing HA-tagged OMP25 or myc-tagged OMP25 (control cells). (D) Abundance of 83 polar metabolites in mitochondria of HEK 293T cells. Data shown as the ratio of metabolite abundance in SFXN1-null cells to wild type cells (log2, x-axis) versus significance of difference between the median abundances of each metabolite in both groups (−log10p-value, y-axis). (E) Abundance of hypotaurine (top) and taurine (bottom) in whole cell (left) and mitochondrial (right) lysates from SFXN1-null (blue) or wild type (gray) HEK 293T cells. Data shown as mean ± SD, n=3 biological replicates.
Figure 3:
Figure 3:. BH4 biosynthesis is necessary for cell proliferation upon GPX4 inhibition
(A) Representative immunoblot analysis of GCH1 in wild type, GCH1 knockout, and GCH1 cDNA expressing Jurkat cells with B-actin used as a loading control (top). Representative immunoblot analysis of SPR in wild type, SPR knockout, and SPR cDNA expressing Jurkat cells with B-actin used as a loading control (bottom). (B) BH4 abundance in WT, GCH1 knockout, SPR knockout, and QM385-treated Jurkat wild type cells. Data shown as mean ± SD, n=3 biological replicates. (C) Fold change in cell number (log2) of wild type, GCH1 knockout, and GCH1 cDNA expressing Jurkat cells untreated (gray) or treated with 200nM RSL3 (blue, left). Fold change in cell number (log2) of wild type, SPR knockout, and SPR cDNA expressing Jurkat cells untreated (gray) or treated (blue) with 200nM RSL3 (right). Data shown as mean ± SD, n=3 biological replicates. (D) Fold change in cell number (log2) of wild type Jurkat cells treated with RSL3 only (black) or cotreated with indicated concentrations of QM385 (blue traces). Data shown as mean ± SD, n=3 biological replicates, **p=2.5E-05, ***p<0.00001 (2.5E-09, 2.1E-11). (E) Fold change in cell number (log2) of wild type (gray) and GCH1 (blue) knockout Jurkat cells treated with 300nM RSL3 and cotreated with ferrostatin-1 (1μM, Ferr-1). Data shown as mean ± SD, n=3 biological replicates. (F) Fold change in cell number (log2) of wild type, GCH1 knockout, and GCH1/ACSL4 double knockout Jurkat cells (left) and SPR knockout and SPR/ACSL4 double knockout Jurkat cells (right) left untreated (gray) or treated with 200nM RSL3 (blue). Data shown as mean ± SD, n=3 biological replicates. (G) Fold change in cell number (log2) of wild type (black trace) and GCH1 knockout (blue trace) Jurkat cells treated with ML162. Data shown as mean ± SD, n=3 biological replicates. (H) Fold change in cell number (log2) of wild type (black trace) and GCH1 knockout (blue trace) Jurkat cells treated with erastin (left), paraquat (middle) or buthionine sulfoximine (BSO, right). Data shown as mean ± SD, n=3 biological replicates.
Figure 4:
Figure 4:. GCH1 expression predicts dependence on BH4 upon ferroptosis induction
(A) BH4 abundance of wild type (gray) and GCH1 knockout (blue) Jurkat cells at baseline and following BH2 (50μM) supplementation. Data shown as mean ± SD, n=3 biological replicates. (B) Fold change in cell number (log2) of wild type (gray) and GCH1 knockout (blue) Jurkat cells treated with RSL3 (300nM) and supplemented with BH2 (50μM). Data shown as mean ± SD, n=3 biological replicates. (C) Representative immunoblot analysis of GPX4 in wild type and GPX4 knockout Jurkat cells (left). Fold change in cell number (log2) of wild type and GPX4 knockout Jurkat cells (right) supplemented with BH2 (200μM) or ferrostatin-1(Ferr-1, 1μM). Data shown as mean ± SD, n=3 biological replicates. (D) Fold change in cell number (log2) of a panel of cancer cell lines that are sensitive (top) or not (bottom) to GPX4 inhibition upon BH4 depletion (blue traces, cotreated with 3–4μM QM385). Data shown as mean ± SD, n=3 biological replicates. (E) Representative immunoblot analysis of GCH1 (top) across a panel of cancer cell lines. B-actin was used as a loading control (bottom). (F) BH4 abundance across a panel of cancer cell lines. Data shown as mean ± SD, n=3 biological replicates. (G) Metabolomic analysis of 81 polar metabolites. Data shown as the ratio of metabolite abundance in GCH-1 expressing cell lines to GCH1-null cell lines (log2, x-axis) versus significance of difference between the median abundances of each metabolite in both groups (−log10p-value, y-axis). (H) Fold change in cell number (log2) of wild type A375 cells treated with RSL3 (500nM) and supplemented with BH2 (50μM). Data shown as mean ± SD, n=3 biological replicates. (I) Representative immunoblot analysis of GCH1 in wild type and GCH1 cDNA expressing A375 cells (GCH1-OE, top). Fold change in cell number (log2, bottom) of wild type and GCH1-OE A375 cells treated with RSL3 (500nM). Data shown as mean ± SD, n=3 biological replicates.
Figure 5:
Figure 5:. BH4 is a potent radical-trapping antioxidant in lipid membranes
(A) Lipid peroxidation assessed by flow cytometry measuring C11-BODIPY fluorescence in wild type and GCH1-KO Jurkat cells treated with RSL3 (175nM, red) with or without BH2 supplementation (50μM, blue) for 15 hours. (B) Heatmap showing changes in a subset of PUFA-containing phosphatidylcholines (PCs) in wild type and SPR-KO cells upon RSL3 treatment. Data shown as the relative change in abundance in RSL3-treated cells compared to untreated cells. (C) Metabolomic analysis of 82 polar metabolites in Jurkat cells. Data shown as the ratio of metabolite abundance in GCH1 knockout to wild type cells (log2, x-axis) versus significance of difference between the median abundances of each metabolite in both cell lines (−log10p-value, y-axis). (D) The lipophilic hyponitrite DTUN is used to initiate the RTA-inhibited co-autoxidation of the polyunsaturated lipids of egg phosphatidylcholine liposomes and STY-BODIPY. (E) The initial rate and inhibited period of STY-BODIPY consumption is used to derive the rate constant and stoichiometry of added RTAs. (F) Representative autoxidations of STY-BODIPY (1μM)-embedded liposomes of egg phosphatidylcholine lipids (1mM, ~100nm particle size) suspended in phosphate-buffered saline pH 7.4 at 37°C initiated by 0.2mM DTUN and inhibited by common water-soluble antioxidants (10μM) and BH4 (4μM). (G) Representative autoxidation of STY-BODIPY as in (F), but with varying concentrations of BH4. (H) RTA stoichiometry of BH4 (left) and inhibited rate of STY-BODIPY oxidation with varying concentration of BH4 (right) from the data in (G). Data shown as mean ± SD, n=3 biological replicates.
Figure 6:
Figure 6:. DHFR regenerates BH4, which synergizes with α-tocopherol to suppress ferroptosis
(A) Representative autoxidations of STY-BODIPY (1μM)-embedded liposomes of egg phosphatidylcholine lipids (1mM, ~100nm particle size) suspended in phosphate-buffered saline pH 7.4 at 37°C initiated by 0.2mM DTUN containing 60μM NADPH and either BH4 (4μM), α-tocopherol (5μM), and BH2 (10μM) as indicated. (B) Representative autoxidation of STY-BODIPY as in (A) but containing 60μM NADPH and BH2 (10μM) with DHFR (50nM), methotrexate (MTX, 100nM), and QDPR (150nM) as indicated. (C) Representative autoxidation of STY-BODIPY as in (A), but containing 60μM NADPH and BH4 (4μM), BH2 (10μM), α-tocopherol (5μM), and DHFR (50nM) as indicated. (D) Fold change in cell number (log2) of wild type (gray) and GCH1 knockout Jurkat cells treated with 300nM RSL3, supplemented with 50μM BH2, and cotreated with methotrexate (MTX, 1.5μM). Data shown as mean ± SD, n=3 biological replicates. (E) Representative immunoblot analysis of DHFR in wild type and DHFR knockout Jurkat cells (top). Fold change in cell number (log2) of wild type (gray) and DHFR knockout (blue) Jurkat cells cultured in nucleoside/ formate supplemented media and treated with 400nM RSL3 and supplemented with 50μM BH2 or cotreated with ferrostatin-1 (Ferr-1, 1μM). Data shown as mean ± SD, n=3 biological replicates. (F) Fold change in cell number (log2) of wild type Jurkat cells cultured in nucleoside supplemented media treated with methotrexate (1μM) and RSL3 (200nM) and ferrostatin-1 (Ferr-1, 1μM). Data shown as mean ± SD, n=3 biological replicates. (G) Lipid peroxidation assessed by flow cytometry measuring C11-BODIPY fluorescence in wild type Jurkat cells treated with RSL3 alone (200nM for 5 hours, blue) or with methotrexate (1.5μM for 18 hours, MTX, red) (H) BH4 synergizes with α-tocopherol to interrupt lipid peroxidation and suppress ferroptosis. BH4 reacts with peroxyl radicals to yield oxidation products (BH2*, which may include BH2, qBH2, BH3, and/or BH4-derived radicals) that may be reduced by DHFR back to BH4.

References

    1. Sies H, Berndt C & Jones DP Oxidative Stress. Annu. Rev. Biochem 86, 715–748 (2017). - PubMed
    1. Yin H, Xu L & Porter NA Free radical lipid peroxidation: mechanisms and analysis. Chem. Rev 111, 5944–5972 (2011). - PubMed
    1. Bersuker K et al. The CoQ oxidoreductase FSP1 acts parallel to GPX4 to inhibit ferroptosis. Nature 575, 688–692 (2019). - PMC - PubMed
    1. Doll S et al. FSP1 is a glutathione-independent ferroptosis suppressor. Nature 575, 693–698 (2019). - PubMed
    1. Ingold KU & Pratt DA Advances in Radical-Trapping Antioxidant Chemistry in the 21st Century: A Kinetics and Mechanisms Perspective. Chem. Rev 114, 9022–9046 (2014). - PubMed

Publication types

MeSH terms