. 2020 Dec;117(12):3628-3638.
doi: 10.1002/bit.27534. Epub 2020 Aug 24.

Genome-wide analysis of single nucleotide variants allows for robust and accurate assessment of clonal derivation in cell lines used to produce biologics

Affiliations

Genome-wide analysis of single nucleotide variants allows for robust and accurate assessment of clonal derivation in cell lines used to produce biologics

Alexandre Kuhn et al. Biotechnol Bioeng. 2020 Dec.

Abstract

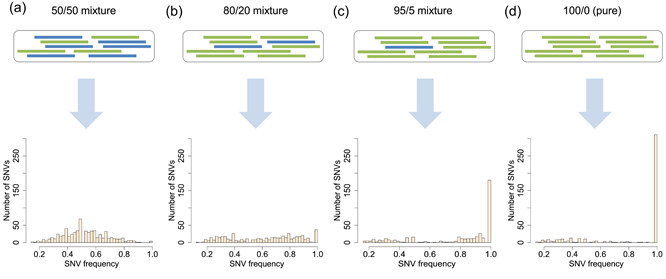
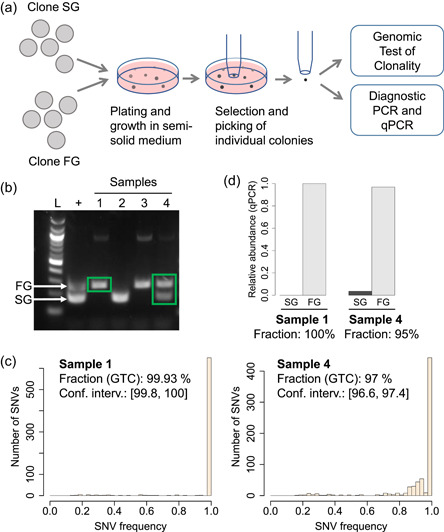
A clonally derived (or "monoclonal") cell line is a cell population derived from a single progenitor cell. Clonally derived cell lines are required for many biotechnological applications. For instance, recombinant mammalian cells used to produce therapeutic proteins are expected by regulatory authorities to be clonally derived. Assurance of clonal derivation (or "clonality") is usually obtained from the characterization of the procedure used for cell cloning, for instance by assessing the success rate of single-cell sorting but not by assessing the cell line itself. We have developed a method to assess clonal derivation directly from the genetic makeup of cells. The genomic test of clonality is based on whole-genome sequencing and statistical analysis of single nucleotide variants. This approach quantifies the clonal fractions present in nonclonal samples and it provides a measure of the probability that a cell line is derived from a single cell. Upon experimental validation of the test, we show that it is highly accurate and that it can robustly detect minor clonal fractions of as little as 1% of the cell population. Moreover, we find that it is applicable to various cell line development protocols. This approach can simplify development protocols and shorten timelines while ensuring clonal derivation with high confidence.

Keywords: biologic; cell line development; clonal derivation; genomics; high-throughput sequencing; monoclonality.


Figures

Figure 1
Figure 1
Schematic representation of genetic diversity in a host cell line and derived cell lines. (a) Cells in the host cell line contain a variety of rare mutations (specifically single nucleotide variants (SNVs), represented as color ticks on the chromosomes). The genome is depicted as a single pair of chromosomes for simplicity. Upon cell cloning SNVs harbored by the progenitor cell (and represented by the blue, green, and yellow ticks) are inherited by all daughter cells and thus become fixed in the clonally derived cell line. (b) Population frequency of SNVs in the clonally derived cell line (represented in panel a) showing that three SNVs are detected with a population frequency of 1 (i.e., present in all cells). (c) Non‐monoclonal cell line derived from two progenitor cells. Each progenitor cell contains specific SNVs and the derived cell line is composed of two subpopulations that are each derived from one of the progenitor cells. (d) Population frequency of SNVs in the derived non‐monoclonal cell line (represented in panel c) showing six SNVs each with a population frequency of 0.5 (i.e., present in half of the cells) [Color figure can be viewed at wileyonlinelibrary.com]
Figure 2
Figure 2
Simulation of mixed clonal populations and analysis of their single nucleotide variant (SNV) frequency spectra. Sequencing reads originating from whole‐genome sequencing of two clonally derived cell lines (represented by blue and green rectangles) were combined to simulate clonal mixtures presenting varying ratios of the two cell lines. Each mixture was subjected to SNV analysis and the corresponding SNV frequency spectrum is represented at the bottom. The ratio of the two cell lines in each artificial sample is as follows (percentage of green cell line/percentage of blue cell line): (a) 50/50, (b) 80/20, (c) 95/5, (d) 100/0 (monoclonal population) [Color figure can be viewed at wileyonlinelibrary.com]
Figure 3
Figure 3
Experimental validation of clonal fractions measured by the genomic test of clonality (GTC). (a) We experimentally mixed two clonally derived cell lines in varying cellular proportions and applied GTC to measure clonal fractions. Cells from one cell line were stained beforehand and the actual cellular composition in each mixture was measured by flow cytometry as well. (b) Single nucleotide variant (SNV) frequency spectra, clonal fractions, corresponding confidence intervals, and pvalue for clonal derivation provided by GTC analysis for three highly unbalanced samples and a pure sample. GTC deemed Samples 1–3 as clonally heterogeneous (non‐monoclonal) and Sample 4 as clonally pure and clonally derived (p < .05). (c) Comparison of clonal fractions measured by GTC and by flow cytometry. The bars represent confidence intervals [Color figure can be viewed at wileyonlinelibrary.com]
Figure 4
Figure 4
Validation of genomic test of clonality (GTC) in the context of cell line development using an automated cloning and imaging system. (a) A cell suspension composed of two clonally derived cell lines (named FG and SG) was plated in semi‐solid medium. Ten days later, individual colonies were picked according to standard imaging criteria. Colonies were screened by polymerase chain reaction (PCR) to identify clonal and non‐clonal colonies. Selected clonal and non‐clonal samples were subjected to GTC and quantitative PCR (qPCR). (b) Result of the PCR screen. Gel electrophoresis analysis of four samples showing FG‐specific amplicon only (Samples 1 and 3), SG‐specific amplicon only (Sample 2) or both amplicons simultaneously (Sample 4), hence revealing a colony composed of both clones. Green rectangles highlight samples displayed in panel c. (c) Single nucleotide variant (SNV) frequency spectra and results of GTC applied to Samples 1 and 4. Sample 1 was deemed clonally pure. It could not be called clonally derived because the sequencing depth of the parental cell line HCB‐1 was insufficient to reach a significance threshold of 0.05. Sample 4 was found to be clonally heterogeneous (and thus non‐monoclonal). (d) Fractions of the FG and SG clones measured by qPCR in Samples 1 and 4, in line with the clonal fractions measured by GTC [Color figure can be viewed at wileyonlinelibrary.com]
Figure 5
Figure 5
Schematic representation of a multistep process used for commercial cell line development (comprised of two transfections and three rounds of cell cloning) and the genetic evolution of successive subclones. (a) A host cell line is transfected and the transgene (dark blue triangle) randomly integrates into the genome. Upon cell cloning and expansion (SCC0), a second transfection is performed, resulting in additional transgene integration sites (light blue triangle) that increase transprotein production. Two final consecutive rounds of cell cloning are performed to obtain high assurance of clonal derivation for the final cell line (SCC2). (b) Schematic representation of the measured genetic diversity and evolution during successive rounds of single‐cell cloning and expansion. Single nucleotide variants (SNVs) harbored by the progenitor cell selected upon the first transfection (green tick) are fixed in the derived cell line (SCC0). However, new SNVs appear during expansion (orange and blue ticks). The new SNV contained in the next progenitor cell (orange tick) becomes fixed upon expansion of SCC1. Whole‐genome sequencing revealed 207 such SNVs in the SCC1 cell line. The final round of cell cloning selects a progenitor cell that contains an SNV (black tick) that appeared during SCC1 expansion and that becomes fixed in SCC2. Whole‐genome sequencing revealed 150 such SNVs in the SCC2 cell line [Color figure can be viewed at wileyonlinelibrary.com]

References

    1. Aebischer‐Gumy, C. , Moretti, P. , Little, T. A. , & Bertschinger, M. (2018). Analytical assessment of clonal derivation of eukaryotic/CHO cell populations. Journal of Biotechnology, 286, 17–26. 10.1016/j.jbiotec.2018.08.020 - DOI - PubMed
    1. Chen, C. , Le, K. , Le, H. , Daris, K. , Soice, N. , Stevens, J. , & Goudar, C. T. (2020). Methods for estimating the probability of clonality in cell line development. Biotechnology Journal, 15(2), e1900289 10.1002/biot.201900289 - DOI - PubMed
    1. Feichtinger, J. , Hernández, I. , Fischer, C. , Hanscho, M. , Auer, N. , Hackl, M. , … Borth, N. (2016). Comprehensive genome and epigenome characterization of CHO cells in response to evolutionary pressures and over time. Biotechnology and Bioengineering, 113(10), 2241–2253. 10.1002/bit.25990 - DOI - PMC - PubMed
    1. Grandjean, M. , Girod, P.‐A. , Calabrese, D. , Kostyrko, K. , Wicht, M. , Yerly, F. , … Mermod, N. (2011). High‐level transgene expression by homologous recombination‐mediated gene transfer. Nucleic Acids Research, 39(15), e104 10.1093/nar/gkr436 - DOI - PMC - PubMed
    1. Ko, P. , Misaghi, S. , Hu, Z. , Zhan, D. , Tsukuda, J. , Yim, M. , … Shen, A. (2018). Probing the importance of clonality: Single cell subcloning of clonally derived CHO cell lines yields widely diverse clones differing in growth, productivity, and product quality. Biotechnology Progress, 34(3), 624–634. 10.1002/btpr.2594 - DOI - PubMed

Publication types

Substances

LinkOut - more resources