. 2020 Sep;19(9):e13211.
doi: 10.1111/acel.13211. Epub 2020 Aug 11.

Dependence of PINK1 accumulation on mitochondrial redox system

Affiliations

Dependence of PINK1 accumulation on mitochondrial redox system

Feng Gao et al. Aging Cell. 2020 Sep.

Abstract

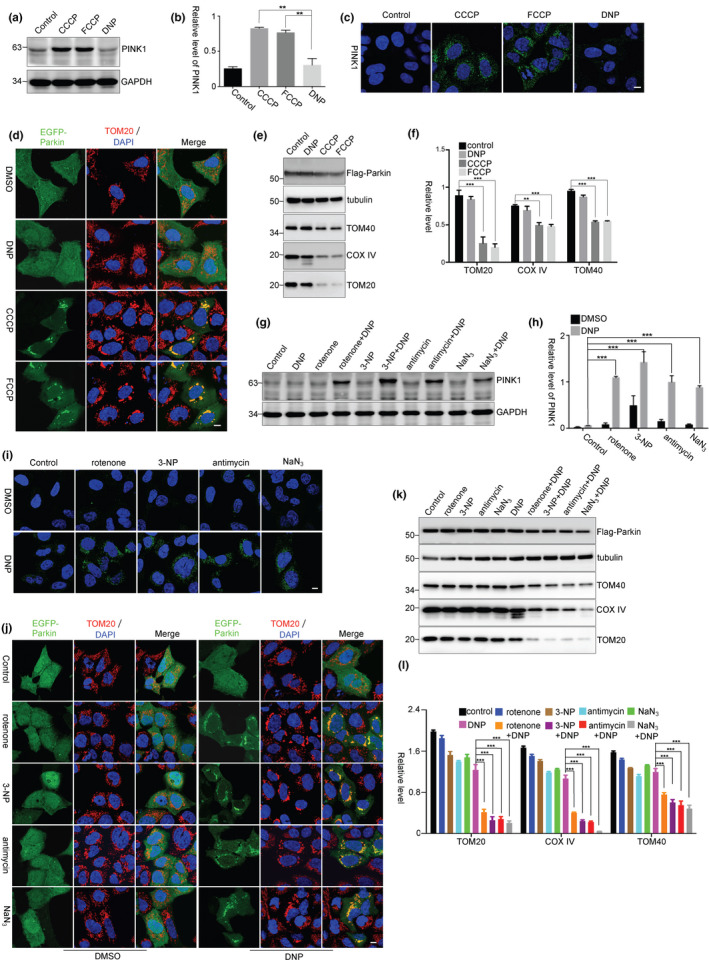
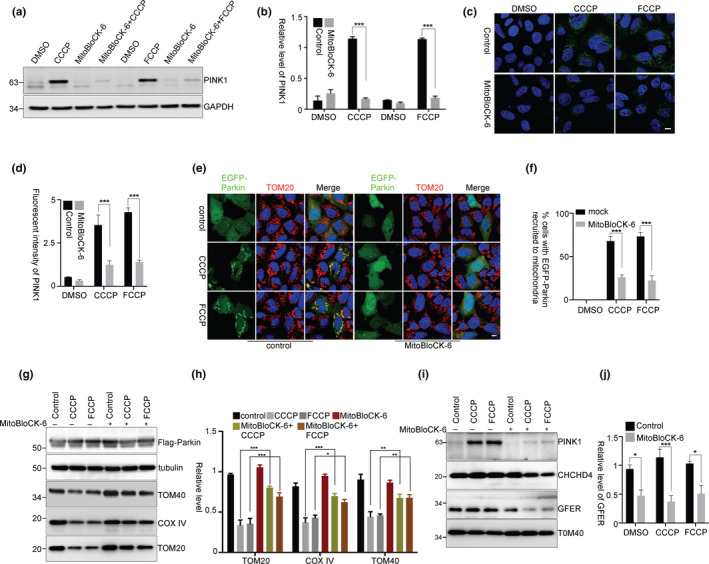
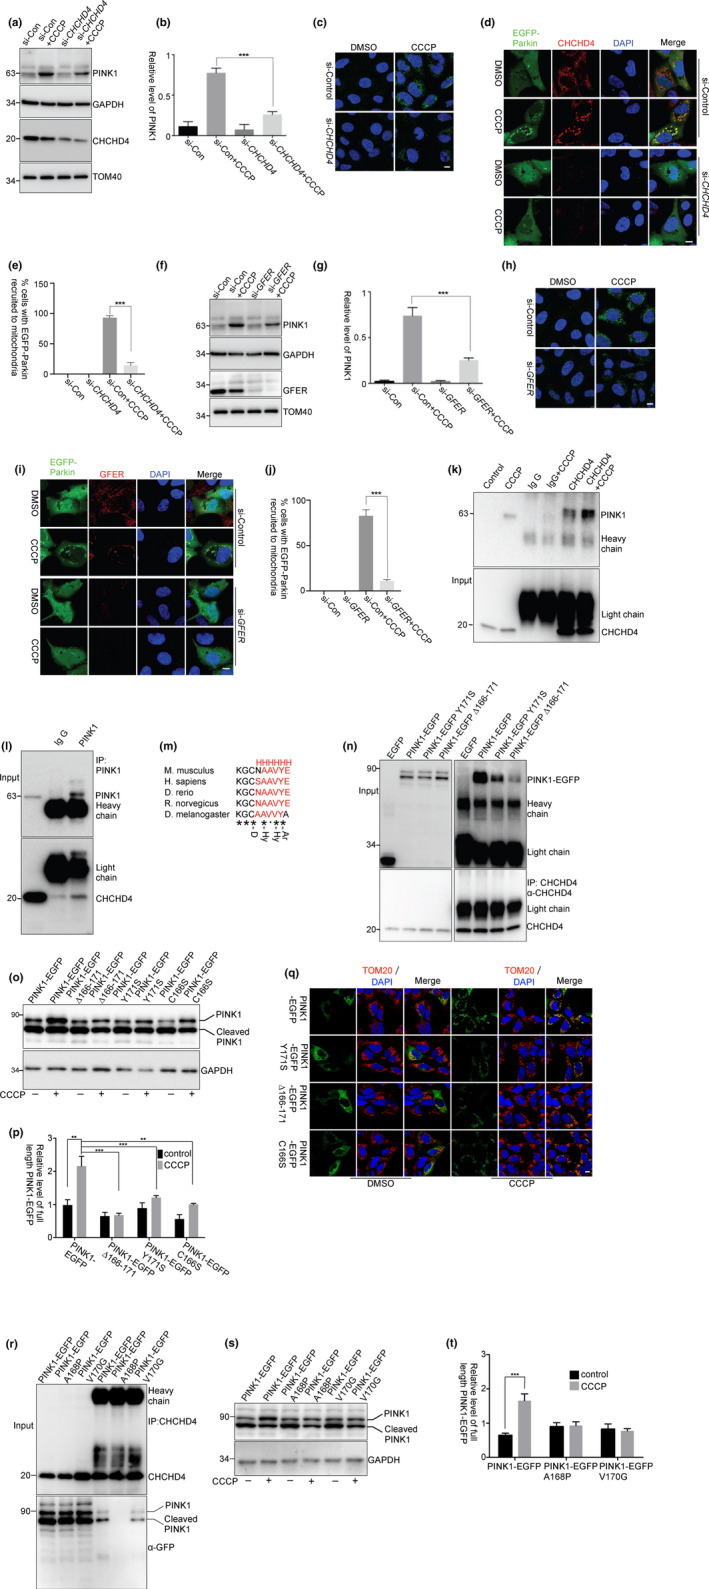
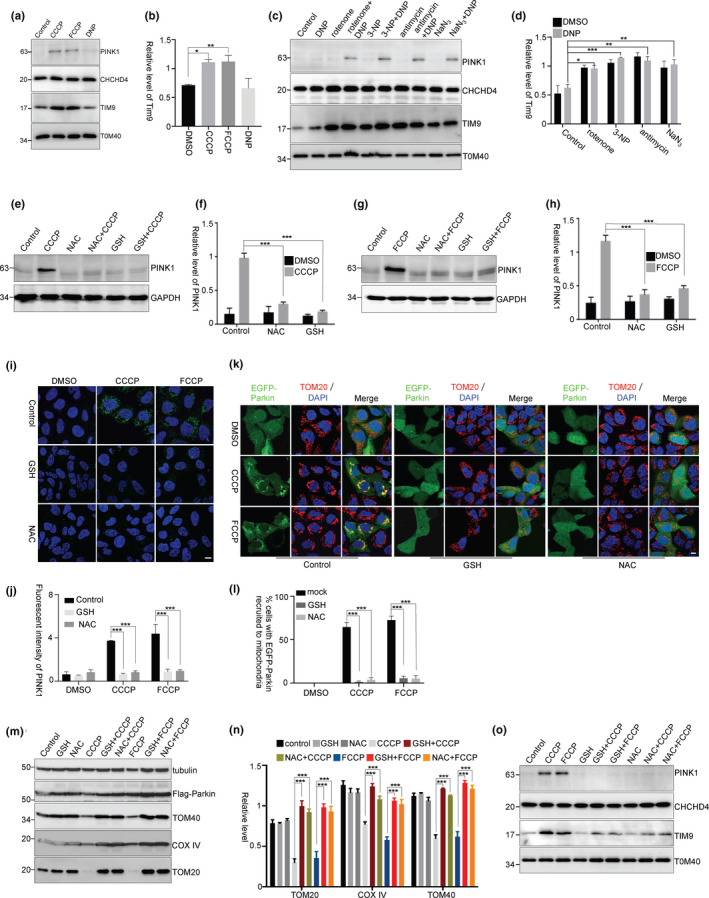
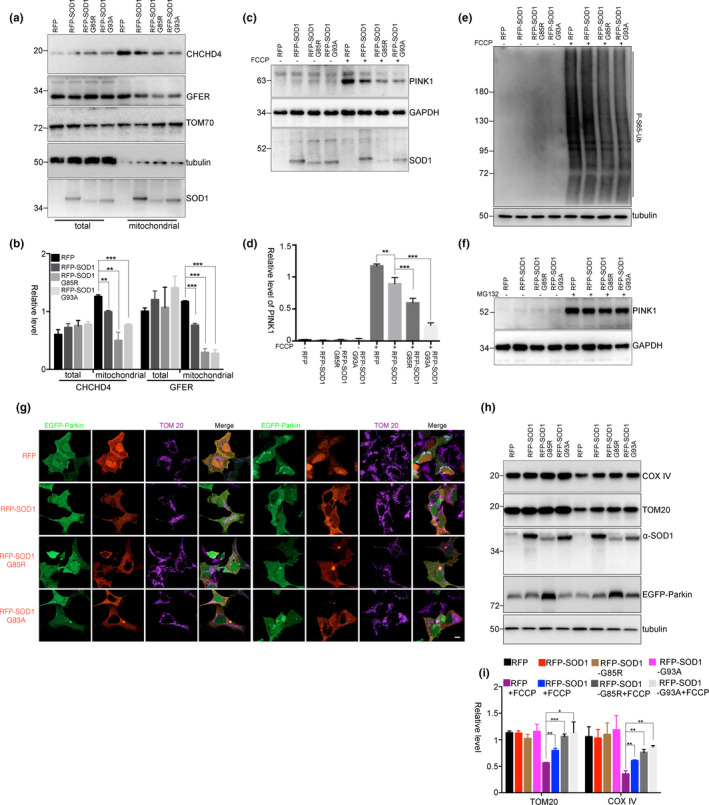
Accumulation of PINK1 on the outer mitochondrial membrane (OMM) is necessary for PINK-mediated mitophagy. The proton ionophores, like carbonyl cyanide m-chlorophenylhydrazone (CCCP) and carbonyl cyanide-4-(trifluoromethoxy)phenylhydrazone (FCCP), inhibit PINK1 import into mitochondrial matrix and induce PINK1 OMM accumulation. Here, we show that the CHCHD4/GFER disulfide relay system in the mitochondrial intermembrane space (IMS) is required for PINK1 stabilization when mitochondrial membrane potential is lost. Activation of CHCHD4/GFER system by mitochondrial oxidative stress or inhibition of CHCHD4/GFER system with antioxidants can promote or suppress PINK1 accumulation, respectively. Thus data suggest a pivotal role of CHCHD4/GFER system in PINK1 accumulation. The amyotrophic lateral sclerosis-related superoxide dismutase 1 mutants dysregulated redox state and CHCHD4/GFER system in the IMS, leading to inhibitions of PINK1 accumulation and mitophagy. Thus, the redox system in the IMS is involved in PINK1 accumulation and damaged mitochondrial clearance, which may play roles in mitochondrial dysfunction-related neurodegenerative diseases.

Keywords: PINK1; autophagy; mitochondrion; mitophagy; neurodegenerative diseases.


Conflict of interest statement

All authors declare that they have no competing financial interest.

Figures

Figure 1
Figure 1
PINK1 accumulation requires mitochondrial oxidative stress. (a ,b) HEK293 cells were treated with CCCP (5 μM), FCCP (5 μM), or DNP (0.5 mM) for 3 hr. The relative levels of PINK1 to GAPDH from three independent experiments were shown in (b). Values are represented as the mean ± SEM. **p < 0.01 by one‐way ANOVA. (c) HEK293 cells were treated as a. The cells were subject to immunocytochemical staining with PINK1 antibody (green). The nuclei were stained with DAPI (blue). Scale bar, 10 μm. (d) HEK293 cells were transfected with EGFP‐Parkin and treated with CCCP (5 μM), FCCP (5 μM), or DNP (0.5 mM) for 3 hr. The cells were then subjected to immunocytochemical staining with TOM20 antibody (red). Scale bar, 10 μm. (e, f) HEK293 cells were transfected with Flag‐Parkin and treated with CCCP (5 μM), FCCP (5 μM), or DNP (0.5 mM) for 24 hr. The relative levels of TOM20, TOM40, and COX IV to tubulin from three independent experiments were shown in (f). Mean ± SEM, **p < 0.01, ***p < 0.001 by one‐way ANOVA. (g, h) HEK293 cells were treated with rotenone (1 μM), 3‐NP (10 mM), antimycin (10 μM), or NaN3 (5 mM) for 2 hr, followed by DNP treatment for 3 hr. The relative levels of PINK1 to GAPDH from three independent experiments were quantified (h). Mean ±SEM, *** p < 0.001 by two‐way ANOVA. (i) HEK293 cells were treated as g. The cells were subjected to immunocytochemical staining with PINK1 antibody (green). Scale bar, 10 μm. (j) HEK293 cells were transfected with EGFP‐Parkin and treated with rotenone (1 μM), 3‐NP (10 mM), antimycin (10 μM), or NaN3 (5 mM) for 2 hr, followed by DNP treatment for 3 hr. The cells were then subjected to immunocytochemical staining with TOM20 antibody (red). Scale bar, 10 μm. (k, l) HEK293 cells were transfected with Flag‐Parkin and treated with rotenone (1 μM), 3‐NP (10 mM), antimycin (10 μM), or NaN3 (5 mM) for 2 hr, followed by DNP treatment for 24 hr. The relative levels of TOM20, TOM40, and COX IV to tubulin from three independent experiments were quantified (l). Mean ± SEM, ***p < 0.001 by one‐way ANOVA
Figure 2
Figure 2
PINK1 accumulation requires mitochondrial disulfide relay system. (a, b) HEK293 cells were treated with MitoBloCK‐6 (50 μM) for 2 hr and then together with CCCP or FCCP for 3 hr. The relative levels of PINK1 to GAPDH from three independent experiments were shown in (b). Mean ± SEM, ***p < 0.001 by two‐way ANOVA. (c, d) HEK293 cells were treated as (a) and then subjected to immunocytochemical staining with PINK1 antibody (green). Fluorescent intensity of PINK1 was quantified, three replicates for each group and >10 images for each replicate (d). Mean ± SEM, ***p < 0.001 by one‐way ANOVA. Scale bar, 10 μm. (e, f) HEK293 cells were transfected with EGFP‐Parkin and then treated with MitoBloCK‐6 for 2 hr followed by CCCP or FCCP treatment for 3 hr. The cells were then subjected to immunocytochemical staining with TOM20 antibody (red). The percentage of cells with EGFP‐Parkin recruited to mitochondria was quantified (f), three replicates for each group, with >80 cells counted for each replicate. Mean ± SEM, ***p < 0.001 by two‐way ANOVA. Scale bar, 10 μm. (g, h) HEK293 cells were transfected with Flag‐Parkin and then treated with MitoBloCK‐6 for 2 hr followed by CCCP or FCCP treatment for 24 hr. The relative levels of TOM20, TOM40, and COX IV to tubulin from three independent experiments were shown in (h). Mean ± SEM, *p < 0.05, **p < 0.01, ***p < 0.001 by two‐way ANOVA. (i, j) HEK293 cells were pretreated with MitoBloCK‐6 and then treated with CCCP or FCCP for 3 hr. Mitochondria were isolated for immunoblotting. The relative levels of GFER to TOM40 from three independent experiments were quantified (j). Mean ± SEM, *p < 0.05, ***p < 0.001 by two‐way ANOVA
Figure 3
Figure 3
The activated CHCHD4 interacted with PINK1. (a–j) HEK293 cells were transfected with siRNAs against CHCHD4 (a–e) or GFER (f–j) for 72 hr. (a–c and f–h) The cells were then treated with CCCP for 3 hr. After treatment, the cells were subjected to immunoblotting or immunocytochemical staining with PINK1 antibody. (b, g) The relative levels of PINK1 to GAPDH from (a) and (f) with three independent experiments were quantified, respectively. (d, i) The cells were subjected to the same treatment as in a but the cells were transfected with EGFP‐Parkin after siRNAs transfection. (e, j) The percentage of cells with EGFP‐Parkin recruited to mitochondria was quantified from (d) and (i), respectively, three replicates for each group, with >80 cells counted for each replicate. Mean ± SEM, ***p < 0.001 by one‐way ANOVA. Scale bar, 10 μm. (k, l) HEK293 cells were treated with CCCP for 2 hr. The cells lysed and precipitated with anti‐CHCHD4 antibodies (k) or anti‐PINK1 antibody (l). (m) α‐helix prediction of PINK1 using PSIPRED (http://bioinf.cs.ucl.ac.uk/psipred/) shows that the α‐helix structure is conserved in different species. Consensus symbols: H, α‐helix; D, docking residue; Hy, hydrophobic residue; Ar, aromatic residue; “*”, identical residues; “:”, conserved substitution; and “,”, semi‐conserved substitution. (n) HEK293 cells were transfected with EGFP, PINK1‐EGFP, PINK1‐EGFP Y171S, or PINK1‐EGFP ∆166‐171 (AA166‐171 deletion) for 24 hr. The cells were lysed for immunoprecipitation with anti‐CHCHD4 antibody. The relative levels of PINK1‐EGFP, PINK1‐EGFP Y171S, and PINK1‐EGFP ∆166‐171 in the precipitants as compared to their inputs are 5.42, 3.31, and 1.01, respectively. (o–q) HEK293 cells were transfected with PINK1‐EGFP, PINK1‐EGFP Y171S, PINK1‐EGFP C166S, or PINK1‐EGFP ∆166‐171 for 24 hr, followed by treatments with CCCP for 3 hr. The relative levels of full‐length PINK1‐EGFP to GAPDH from three independent experiments were quantified (p). Mean ± SEM, **p < 0.01, ***p < 0.001 by two‐way ANOVA. Scale bar, 10 μm. (r) HEK293 cells were transfected with PINK1‐EGFP, PINK1‐EGFP A168P, and PINK1‐EGFP V170G for 24 hr. The cells were lysed for immunoprecipitation with anti‐CHCHD4 antibody. The relative levels of PINK1‐EGFP, PINK1‐EGFP A168P, and PINK1‐EGFP V170G in the precipitants as compared to their inputs are 0.73, 0.20, and 0.39, respectively. (s, t) HEK293 cells were transfected with PINK1‐EGFP, PINK1‐EGFP A168P, and PINK1‐EGFP V170G for 24 hr, followed by treatments with CCCP for 3 hr. The relative levels of full‐length PINK1‐EGFP to GAPDH from three independent experiments were quantified (t). Mean ± SEM, ***p < 0.001 by one‐way ANOVA
Figure 4
Figure 4
Mitochondrial oxidative stress is required for PINK1 accumulation. (a, b) HEK293 cells were pretreated with CCCP, FCCP, or DNP for 3 hr. Mitochondria were isolated for immunoblotting. The relative levels of TIM9 to TOM40 from three independent experiments were shown in (b). Mean ± SEM, *p < 0.05, **p < 0.01 by one‐way ANOVA. (c, d) HEK293 cells were pretreated with rotenone, 3‐NP, antimycin, or NaN3 and then treated with DNP for 3 hr. Mitochondria were isolated for immunoblotting. (d) The relative levels of TIM9 to TOM40 from three independent experiments were quantified. Mean ± SEM, *p < 0.05, **p < 0.01, ***p < 0.001 by two‐way ANOVA. (e–j) HEK293 cells were treated with GSH (10 mM) or NAC (10 mM) for 2 hr followed by CCCP (5 μM) (e,f) or FCCP (5 μM) (g, h) treatment for 3 hr. (f, h) The relative levels of PINK1 to GAPDH from (e) and (g) with three independent experiments were quantified, respectively. (j) Fluorescent intensity of PINK1 from (i) was quantified, three replicates for each group and >10 images for each replicate. Mean ± SEM, *** p < 0.001 by two‐way ANOVA. Scale bar, 10 μm. (k–n) HEK293 cells were transfected with EGFP‐Parkin (k and l) or Flag‐Parkin (m and n) and then treated with GSH or NAC for 2 hr followed by CCCP or FCCP treatment for 3 hr (k and l) or 24 hr (m and n). (l) The percentage of cells with EGFP‐Parkin recruited to mitochondria from k was quantified, three replicates for each group, with >80 cells counted for each replicate. (n) The relative levels of TOM20, TOM40, and COX IV to tubulin from m with three independent experiments were quantified. Mean ± SEM, *** p < 0.001 by two‐way ANOVA. Scale bar, 10 μm. (o) HEK293 cells were pretreated with GSH or NAC for 2 hr and then treated with CCCP or FCCP for 3 hr. Mitochondria were isolated for immunoblotting
Figure 5
Figure 5
SOD1 mutants inhibit PINK1 accumulation and mitophagy. (a) and (b) HEK293 cells were transfected with RFP, RFP‐SOD1, RFP‐SOD1 G85R, or RFP‐SOD1 G93A for 48 hr. Then, the mitochondria were isolated for immunoblot analysis. The relative levels of CHCHD4 and GFER to TOM70 from three independent experiments were shown in (b). Mean ± SEM, **p < 0.01, ***p < 0.001 by one‐way ANOVA. (c–f) HEK293 cells were transfected with RFP, RFP‐SOD1, RFP‐SOD1 G85R, or RFP‐SOD1 G93A for 48 hr and treated with FCCP (5 mM) for 3 hr (c–e) or MG132 (10 mM) for 3 hr (f). The endogenous PINK1 (c and f) and phospho‐Ub (Ser65) (e) were detected using immunoblot analyses. The relative levels of PINK1 to GAPDH from three independent experiments were quantified (d). Mean ± SEM, **p < 0.01, ***p < 0.001 by one‐way ANOVA. (g–i) HEK293 cells were co‐transfected with RFP, RFP‐SOD1, RFP‐SOD1 G85R or RFP‐SOD1 G93A and EGFP‐Parkin, followed by treatments with FCCP (5 mM) for 3 hr (g) or FCCP (5 mM) for 24 hr (h) and (i). The relative levels of TOM20 and COX IV to tubulin from three independent experiments were shown in (i). Mean ± SEM, *p < 0.05, **p < 0.01, ***p < 0.001 by one‐way ANOVA. Scale bar, 10 μm

References

    1. Berezhnov, A. V. , Soutar, M. P. , Fedotova, E. I. , Frolova, M. S. , Plun‐Favreau, H. , Zinchenko, V. P. , & Abramov, A. Y. (2016). Intracellular pH modulates autophagy and mitophagy. Journal of Biological Chemistry, 291(16), 8701–8708. 10.1074/jbc.M115.691774 - DOI - PMC - PubMed
    1. Chacinska, A. , Koehler, C. M. , Milenkovic, D. , Lithgow, T. , & Pfanner, N. (2009). Importing mitochondrial proteins: Machineries and mechanisms. Cell, 138(4), 628–644. 10.1016/j.cell.2009.08.005 - DOI - PMC - PubMed
    1. Chacinska, A. , Pfannschmidt, S. , Wiedemann, N. , Kozjak, V. , Sanjuán Szklarz, L. K. , Schulze‐Specking, A. , … Pfanner, N. (2004). Essential role of Mia40 in import and assembly of mitochondrial intermembrane space proteins. EMBO Journal, 23(19), 3735–3746. 10.1038/sj.emboj.7600389 - DOI - PMC - PubMed
    1. Chen, Y. , Dorn, G. W. 2nd (2013). PINK1‐phosphorylated mitofusin 2 is a Parkin receptor for culling damaged mitochondria. Science, 340(6131), 471–475. 10.1126/science.1231031 - DOI - PMC - PubMed
    1. Dagda, R. K. , Cherra, S. J. 3rd , Kulich, S. M. , Tandon, A. , Park, D. , & Chu, C. T. (2009). Loss of PINK1 function promotes mitophagy through effects on oxidative stress and mitochondrial fission. Journal of Biological Chemistry, 284(20), 13843–13855. 10.1074/jbc.M808515200 - DOI - PMC - PubMed

Publication types

Substances

LinkOut - more resources