

Myelin Imaging in Human Brain Using a Short Repetition Time Adiabatic Inversion Recovery Prepared Ultrashort Echo Time (STAIR-UTE) MRI Sequence in Multiple Sclerosis
- PMID: 32779970
- PMCID: PMC7643815
- DOI: 10.1148/radiol.2020200425
Myelin Imaging in Human Brain Using a Short Repetition Time Adiabatic Inversion Recovery Prepared Ultrashort Echo Time (STAIR-UTE) MRI Sequence in Multiple Sclerosis
Abstract
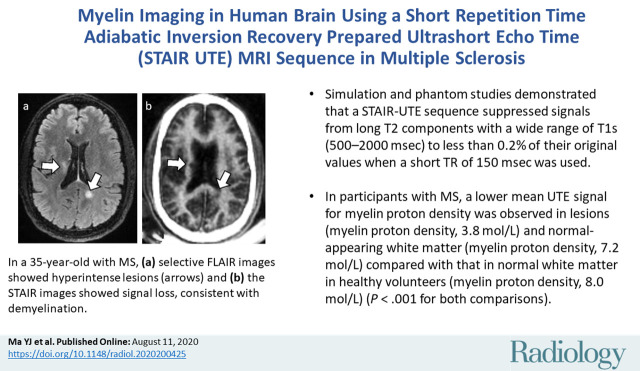
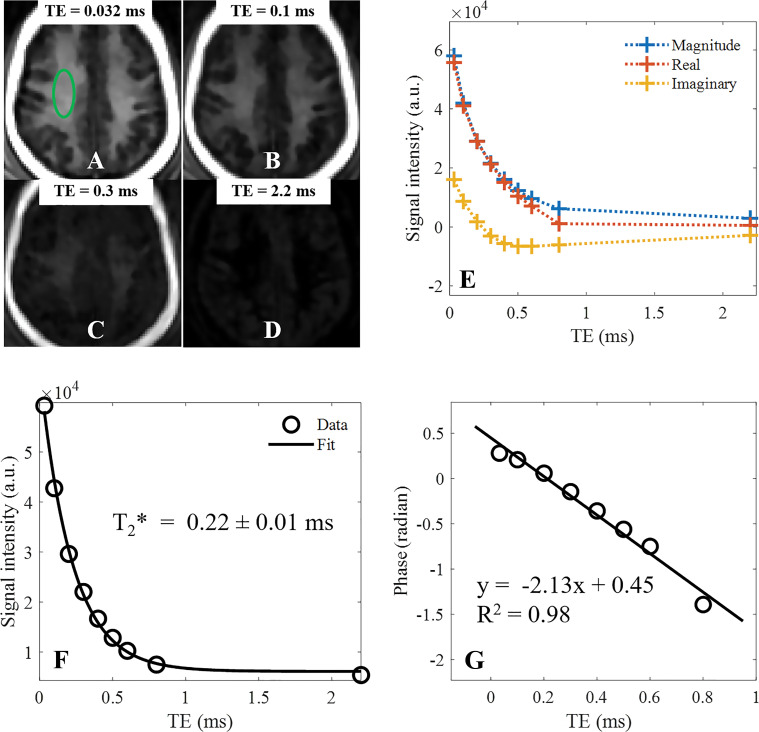
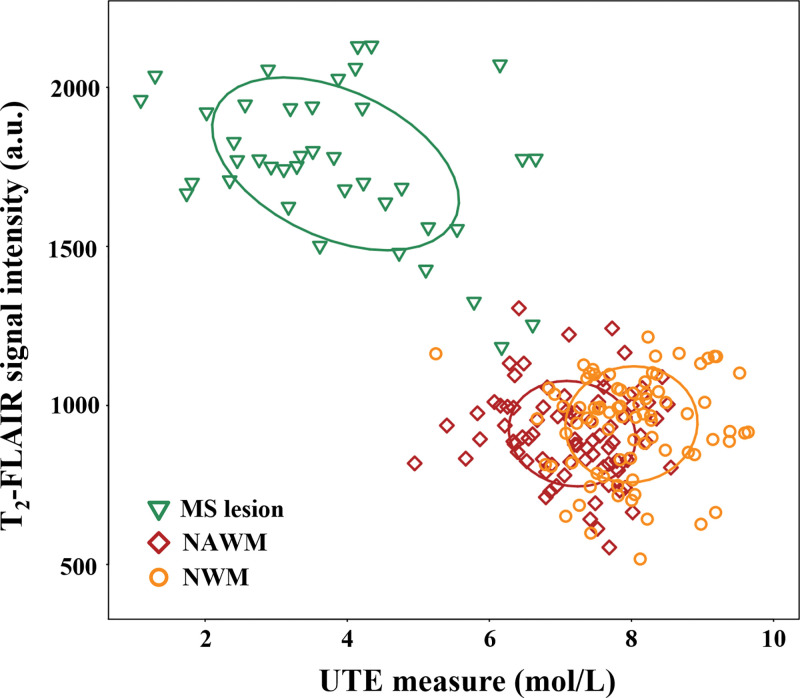
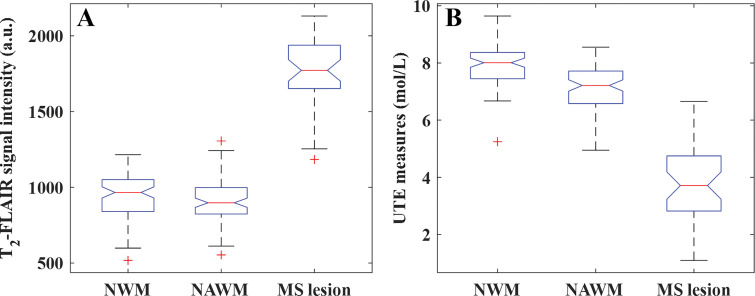
Background Water signal contamination is a major challenge for direct ultrashort echo time (UTE) imaging of myelin in vivo because water contributes most of the signals detected in white matter. Purpose To validate a new short repetition time (TR) adiabatic inversion recovery (STAIR) prepared UTE (STAIR-UTE) sequence designed to suppress water signals and to allow imaging of ultrashort T2 protons of myelin in white matter using a clinical 3-T scanner. Materials and Methods In this prospective study, an optimization framework was used to obtain the optimal inversion time for nulling water signals using STAIR-UTE imaging at different TRs. Numeric simulation and phantom studies were performed. Healthy volunteers and participants with multiple sclerosis (MS) underwent MRI between November 2018 and October 2019 to compare STAIR-UTE and a clinical T2-weighted fluid-attenuated inversion recovery sequence for assessment of MS lesions. UTE measures of myelin were also performed to allow comparison of signals in lesions and with those in normal-appearing white matter (NAWM) in patients with MS and in normal white matter (NWM) in healthy volunteers. Results Simulation and phantom studies both suggest that the proposed STAIR-UTE technique can effectively suppress long T2 tissues with a broad range of T1s. Ten healthy volunteers (mean age, 33 years ± 8 [standard deviation]; six women) and 10 patients with MS (mean age, 51 years ± 16; seven women) were evaluated. The three-dimensional STAIR-UTE sequence effectively suppressed water components in white matter and selectively imaged myelin, which had a measured T2* value of 0.21 msec ± 0.04 in the volunteer study. A much lower mean UTE measure of myelin proton density was found in MS lesions (3.8 mol/L ± 1.5), and a slightly lower mean UTE measure was found in NAWM (7.2 mol/L ± 0.8) compared with that in NWM (8.0 mol/L ± 0.8) in the healthy volunteers (P < .001 for both comparisons). Conclusion The short repetition time adiabatic inversion recovery-prepared ultrashort echo time sequence provided efficient water signal suppression for volumetric imaging of myelin in the brain and showed excellent myelin signal contrast as well as marked ultrashort echo time signal reduction in multiple sclerosis lesions and a smaller reduction in normal-appearing white matter compared with normal white matter in volunteers. © RSNA, 2020 Online supplemental material is available for this article. See also the editorial by Messina and Port in this issue.
Figures
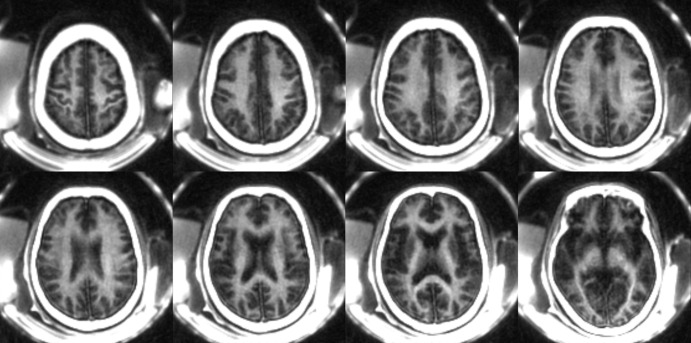
![A–E, Selective T2-weighted fluid-attenuated inversion recovery (FLAIR) (repetition time [TR] msec/echo time msec, 7600/117), and, F–J, short TR adiabatic inversion recovery (STAIR) prepared ultrashort echo time (UTE) (TR = 140 msec) images in three representative participants with multiple sclerosis (MS). A, B, F, and G were obtained in a 35-year-old man; C, D, H, and I were obtained in a 69-year-old woman; E and J were obtained in a 48-year-old man. Arrows indicate MS lesions. Hyperintense lesions detected on T2-FLAIR images show signal loss on corresponding STAIR-UTE images, consistent with demyelination.](https://cdn.ncbi.nlm.nih.gov/pmc/blobs/ee04/7643815/8c6dc17e8770/radiol.2020200425.fig6.jpg)
Comment in
-
On the STAIR-Way to Imaging Myelin with Clinical MRI.Radiology. 2020 Nov;297(2):405-406. doi: 10.1148/radiol.2020202860. Epub 2020 Aug 11. Radiology. 2020. PMID: 32779977 No abstract available.
References
-
- Noseworthy JH, Lucchinetti C, Rodriguez M, Weinshenker BG. Multiple sclerosis. N Engl J Med 2000;343(13):938–952. - PubMed
-
- Filippi M, Rocca MA. MR imaging of multiple sclerosis. Radiology 2011;259(3):659–681. - PubMed
-
- Brück W, Bitsch A, Kolenda H, Brück Y, Stiefel M, Lassmann H. Inflammatory central nervous system demyelination: correlation of magnetic resonance imaging findings with lesion pathology. Ann Neurol 1997;42(5):783–793. - PubMed
-
- Alonso-Ortiz E, Levesque IR, Pike GB. MRI-based myelin water imaging: A technical review. Magn Reson Med 2015;73(1):70–81. - PubMed
-
- Deoni SCL, Rutt BK, Arun T, Pierpaoli C, Jones DK. Gleaning multicomponent T1 and T2 information from steady-state imaging data. Magn Reson Med 2008;60(6):1372–1387. - PubMed
Publication types
MeSH terms
Grants and funding
LinkOut - more resources
Full Text Sources
Medical
