Comparative Study
. 2020 Oct;297(1):201-210.
doi: 10.1148/radiol.2020192804. Epub 2020 Aug 11.

Emphysema Index Based on Hyperpolarized 3He or 129Xe Diffusion MRI: Performance and Comparison with Quantitative CT and Pulmonary Function Tests

Affiliations
Comparative Study

Emphysema Index Based on Hyperpolarized 3He or 129Xe Diffusion MRI: Performance and Comparison with Quantitative CT and Pulmonary Function Tests

Sina Tafti et al. Radiology. 2020 Oct.

Abstract

Background Apparent diffusion coefficient (ADC) maps of inhaled hyperpolarized gases have shown promise in the characterization of emphysema in patients with chronic obstructive pulmonary disease (COPD), yet an easily interpreted quantitative metric beyond mean and standard deviation has not been established. Purpose To introduce a quantitative framework with which to characterize emphysema burden based on hyperpolarized helium 3 (3He) and xenon 129 (129Xe) ADC maps and compare its diagnostic performance with CT-based emphysema metrics and pulmonary function tests (PFTs). Materials and Methods Twenty-seven patients with mild, moderate, or severe COPD and 13 age-matched healthy control subjects participated in this retrospective study. Participants underwent CT and multiple b value diffusion-weighted 3He and 129Xe MRI examinations and standard PFTs between August 2014 and November 2017. ADC-based emphysema index was computed separately for each gas and b value as the fraction of lung voxels with ADC values greater than in the healthy group 99th percentile. The resulting values were compared with quantitative CT results (relative lung area <-950 HU) as the reference standard. Diagnostic performance metrics included area under the receiver operating characteristic curve (AUC). Spearman rank correlations and Wilcoxon rank sum tests were performed between ADC-, CT-, and PFT-based metrics, and intraclass correlation was performed between repeated measurements. Results Thirty-six participants were evaluated (mean age, 60 years ± 6 [standard deviation]; 20 women). ADC-based emphysema index was highly repeatable (intraclass correlation coefficient > 0.99) and strongly correlated with quantitative CT (r = 0.86, P < .001 for 3He; r = 0.85, P < .001 for 129Xe) with high AUC (≥0.93; 95% confidence interval [CI]: 0.85, 1.00). ADC emphysema indices were also correlated with percentage of predicted diffusing capacity of lung for carbon monoxide (r = -0.81, P < .001 for 3He; r = -0.80, P < .001 for 129Xe) and percentage of predicted residual lung volume divided by total lung capacity (r = 0.65, P < .001 for 3He; r = 0.61, P < .001 for 129Xe). Conclusion Emphysema index based on hyperpolarized helium 3 or xenon 129 diffusion MRI provides a repeatable measure of emphysema burden, independent of gas or b value, with similar diagnostic performance as quantitative CT or pulmonary function metrics. © RSNA, 2020 Online supplemental material is available for this article. See also the editorial by Schiebler and Fain in this issue.


Figures

None
Graphical abstract
Study flowchart details exclusion criteria. Among 40 participants who underwent initial imaging, data were excluded from analysis owing to substantial smoking history (healthy participants only) or absence of diffusion-weighted MRI scans with either gas. COPD = chronic obstructive pulmonary disease, 3He = helium 3, PFT = pulmonary function test, 129Xe = xenon 129.
Figure 1:
Study flowchart details exclusion criteria. Among 40 participants who underwent initial imaging, data were excluded from analysis owing to substantial smoking history (healthy participants only) or absence of diffusion-weighted MRI scans with either gas. COPD = chronic obstructive pulmonary disease, 3He = helium 3, PFT = pulmonary function test, 129Xe = xenon 129.
Histograms of all lung voxel apparent diffusion coefficient (ADC) values from all healthy volunteers and patients with chronic obstructive pulmonary disease (COPD) for, A, hyperpolarized helium 3 (3He) and, B, hyperpolarized xenon 129 (129Xe) ADC computed from first (smallest) b value. All distributions are self-normalized to have equal areas to facilitate visual comparison. Vertical lines mark 99th percentile of healthy distribution. 3He and 129Xe ADC values at 99th percentile of healthy distributions were 0.40 and 0.065 cm2/sec for first b value, 0.32 and 0.055 cm2/sec for second b value, 0.29 and 0.049 cm2/sec for third b value, and 0.25 and 0.047 cm2/sec for fourth b value, respectively.
Figure 2:
Histograms of all lung voxel apparent diffusion coefficient (ADC) values from all healthy volunteers and patients with chronic obstructive pulmonary disease (COPD) for, A, hyperpolarized helium 3 (3He) and, B, hyperpolarized xenon 129 (129Xe) ADC computed from first (smallest) b value. All distributions are self-normalized to have equal areas to facilitate visual comparison. Vertical lines mark 99th percentile of healthy distribution. 3He and 129Xe ADC values at 99th percentile of healthy distributions were 0.40 and 0.065 cm2/sec for first b value, 0.32 and 0.055 cm2/sec for second b value, 0.29 and 0.049 cm2/sec for third b value, and 0.25 and 0.047 cm2/sec for fourth b value, respectively.
Representative axial CT lung images, segmented CT images with voxels having attenuation coefficient levels less than −950 HU and −910 HU displayed in yellow and red, respectively, and corresponding helium 3 (3He) and xenon 129 (129Xe) apparent diffusion coefficient (ADC) maps. In top row, CT image in healthy 60-year-old man shows uniformly dense parenchyma throughout lung and uniformly low ADC values in both 3He and 129Xe ADC maps. In middle row, CT in 75-year-old man with stage III chronic obstructive pulmonary disease (COPD) depicts large areas of lung parenchyma with low attenuation coefficients. Clear visual concordance is present between these areas in CT image and elevated ADC values in corresponding 3 He and 129Xe ADC maps. CT RA950 and ADC emphysema indices are well outside healthy range (>0.04), indicating that with all techniques participant is identified as emphysematous. In bottom row, clear difference in performance is seen in 68-year-old woman with stage III COPD. Very few pixels in CT image cross −950 HU threshold, whereas both ADC maps show extensive lung regions with elevated values. Accordingly, both ADC-based emphysema indices for this participant lie well outside healthy range, but CT RA950 does not (RA950 = 0.01; ADC emphysema index = 0.25 and 0.21 based on 3He and 129Xe, respectively). RA950 = fraction of CT lung voxels with attenuation coefficients less than −950 HU.
Figure 3:
Representative axial CT lung images, segmented CT images with voxels having attenuation coefficient levels less than −950 HU and −910 HU displayed in yellow and red, respectively, and corresponding helium 3 (3He) and xenon 129 (129Xe) apparent diffusion coefficient (ADC) maps. In top row, CT image in healthy 60-year-old man shows uniformly dense parenchyma throughout lung and uniformly low ADC values in both 3He and 129Xe ADC maps. In middle row, CT in 75-year-old man with stage III chronic obstructive pulmonary disease (COPD) depicts large areas of lung parenchyma with low attenuation coefficients. Clear visual concordance is present between these areas in CT image and elevated ADC values in corresponding 3He and 129Xe ADC maps. CT RA950 and ADC emphysema indices are well outside healthy range (>0.04), indicating that with all techniques participant is identified as emphysematous. In bottom row, clear difference in performance is seen in 68-year-old woman with stage III COPD. Very few pixels in CT image cross −950 HU threshold, whereas both ADC maps show extensive lung regions with elevated values. Accordingly, both ADC-based emphysema indices for this participant lie well outside healthy range, but CT RA950 does not (RA950 = 0.01; ADC emphysema index = 0.25 and 0.21 based on 3He and 129Xe, respectively). RA950 = fraction of CT lung voxels with attenuation coefficients less than −950 HU.
A, Scatterplot of apparent diffusion coefficient (ADC) emphysema indices based on xenon 129 (129Xe) versus helium 3 (3He) in all participants using smallest b values. B, Scatterplot of repeatability measurements of 3He-based ADC emphysema indices (y = 1.01× + 0.00, >r2 > 0.99). C, Scatterplot of repeatability measurements of 129Xe-based ADC emphysema indices (y = 1.03× − 0.01, r2 = 0.99). D, Bland-Altman plot depicts bias between 3He-based and 129 Xe-based ADC emphysema indices. Percentage mean ± standard deviation (SD) is 9.8% ± 8.6. Significant correlation is observed between percentage emphysema index difference and mean emphysema index (r = 0.87, P < .001). E, Bland-Altman plot depicts no bias between 3He-based ADC emphysema index repeatability measurements. Percentage mean ± SD is −0.2% ± 1.4. F, Bland-Altman plot depicts no bias between 129Xe-based ADC emphysema index repeatability measurements. Percentage mean ± SD is 0.4 ± 3.0. Dashed horizontal lines represent 95% limits of agreement in all Bland-Altman plots. All plots share same legend presented in A.
Figure 4:
A, Scatterplot of apparent diffusion coefficient (ADC) emphysema indices based on xenon 129 (129Xe) versus helium 3 (3He) in all participants using smallest b values. B, Scatterplot of repeatability measurements of 3He-based ADC emphysema indices (y = 1.01× + 0.00, r2 > 0.99). C, Scatterplot of repeatability measurements of 129Xe-based ADC emphysema indices (y = 1.03× − 0.01, r2 = 0.99). D, Bland-Altman plot depicts bias between 3He-based and 129Xe-based ADC emphysema indices. Percentage mean ± standard deviation (SD) is 9.8% ± 8.6. Significant correlation is observed between percentage emphysema index difference and mean emphysema index (r = 0.87, P < .001). E, Bland-Altman plot depicts no bias between 3He-based ADC emphysema index repeatability measurements. Percentage mean ± SD is −0.2% ± 1.4. F, Bland-Altman plot depicts no bias between 129Xe-based ADC emphysema index repeatability measurements. Percentage mean ± SD is 0.4 ± 3.0. Dashed horizontal lines represent 95% limits of agreement in all Bland-Altman plots. All plots share same legend presented in A.
Superimposed scatterplots of CT RA950 versus lowest b-value pair emphysema index based on both helium 3 (3He) apparent diffusion coefficient (ADC) and xenon 129 (129Xe) ADC (circles and squares represent 3He-based and 129Xe-based ADC emphysema indices, respectively). Solid lines are drawn at upper limit of 99% confidence interval of healthy population to create “apparently healthy” quadrant (lower left) and “apparently emphysematous” quadrant (upper right). Lower right quadrant contains participants whose emphysema indices lie in healthy range based on CT but lie in emphysematous range based on ADC (five 3He-based and five 129Xe-based ADC emphysema index data points appear in lower right quadrant). No data points appear in upper left quadrant. RA950 = fraction of CT lung voxels with attenuation coefficients less than −950 HU.
Figure 5:
Superimposed scatterplots of CT RA950 versus lowest b-value pair emphysema index based on both helium 3 (3He) apparent diffusion coefficient (ADC) and xenon 129 (129Xe) ADC (circles and squares represent 3He-based and 129Xe-based ADC emphysema indices, respectively). Solid lines are drawn at upper limit of 99% confidence interval of healthy population to create “apparently healthy” quadrant (lower left) and “apparently emphysematous” quadrant (upper right). Lower right quadrant contains participants whose emphysema indices lie in healthy range based on CT but lie in emphysematous range based on ADC (five 3He-based and five 129Xe-based ADC emphysema index data points appear in lower right quadrant). No data points appear in upper left quadrant. RA950 = fraction of CT lung voxels with attenuation coefficients less than −950 HU.
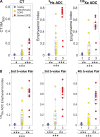
A, Box plots of CT RA950 and emphysema index based on hyperpolarized helium 3 (3He) and xenon 129 (129Xe) ADCs (first b value pair). B, Box plot of emphysema indices based on different b value pair 129Xe ADC. * P < .05, ** P < .01. *** P < .001. Horizontal lines inside boxes are medians; box edges indicate 25th and 75th percentiles of distributions. ADC = apparent diffusion coefficient. RA 950 = fraction of CT lung voxels with attenuation coefficients less than −950 HU.
Figure 6:
A, Box plots of CT RA950 and emphysema index based on hyperpolarized helium 3 (3He) and xenon 129 (129Xe) ADCs (first b value pair). B, Box plot of emphysema indices based on different b value pair 129Xe ADC. * P < .05, ** P < .01. *** P < .001. Horizontal lines inside boxes are medians; box edges indicate 25th and 75th percentiles of distributions. ADC = apparent diffusion coefficient. RA950 = fraction of CT lung voxels with attenuation coefficients less than −950 HU.

Comment in

Similar articles

Cited by

References

    1. Global Initiative for Chronic Obstructive Lung Disease (GOLD) . Global Strategy for the Diagnosis, Management and Prevention of COPD. https://goldcopd.org/. Published 2019. Accessed December 12, 2019. - PubMed
    1. Müller NL, Staples CA, Miller RR, Abboud RT. “Density mask”. An objective method to quantitate emphysema using computed tomography. Chest 1988;94(4):782–787. - PubMed
    1. Lynch DA, Al-Qaisi MA. Quantitative computed tomography in chronic obstructive pulmonary disease. J Thorac Imaging 2013;28(5):284–290. - PMC - PubMed
    1. Gierada DS, Yusen RD, Pilgram TK, et al. . Repeatability of quantitative CT indexes of emphysema in patients evaluated for lung volume reduction surgery. Radiology 2001;220(2):448–454. - PubMed
    1. Madani A, Van Muylem A, Gevenois PA. Pulmonary emphysema: effect of lung volume on objective quantification at thin-section CT. Radiology 2010;257(1):260–268. - PubMed

Publication types