. 2020 Oct;297(1):64-72.
doi: 10.1148/radiol.2020200466. Epub 2020 Aug 11.

Automated Abdominal CT Imaging Biomarkers for Opportunistic Prediction of Future Major Osteoporotic Fractures in Asymptomatic Adults

Affiliations

Automated Abdominal CT Imaging Biomarkers for Opportunistic Prediction of Future Major Osteoporotic Fractures in Asymptomatic Adults

Perry J Pickhardt et al. Radiology. 2020 Oct.

Abstract

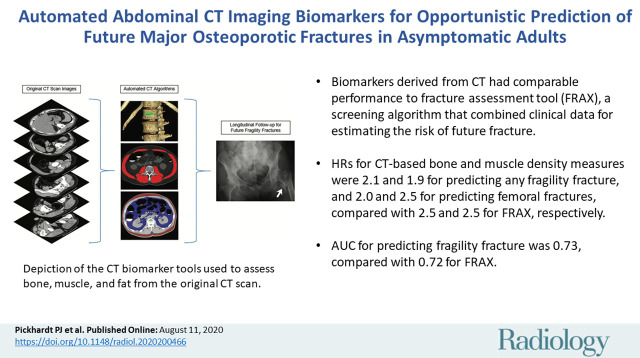
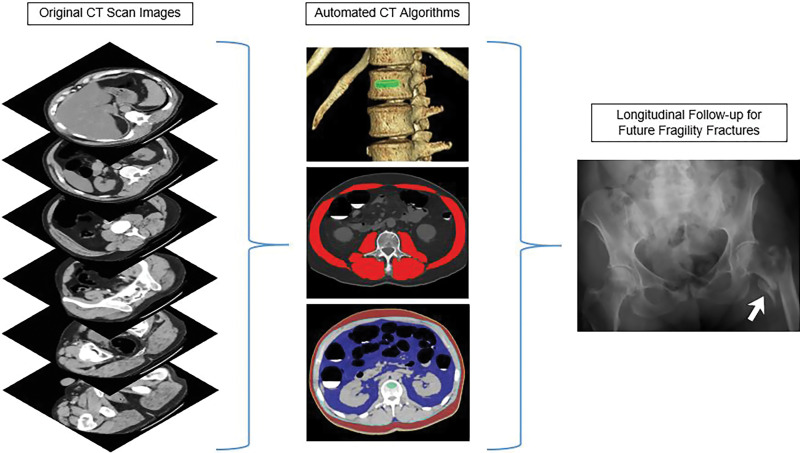
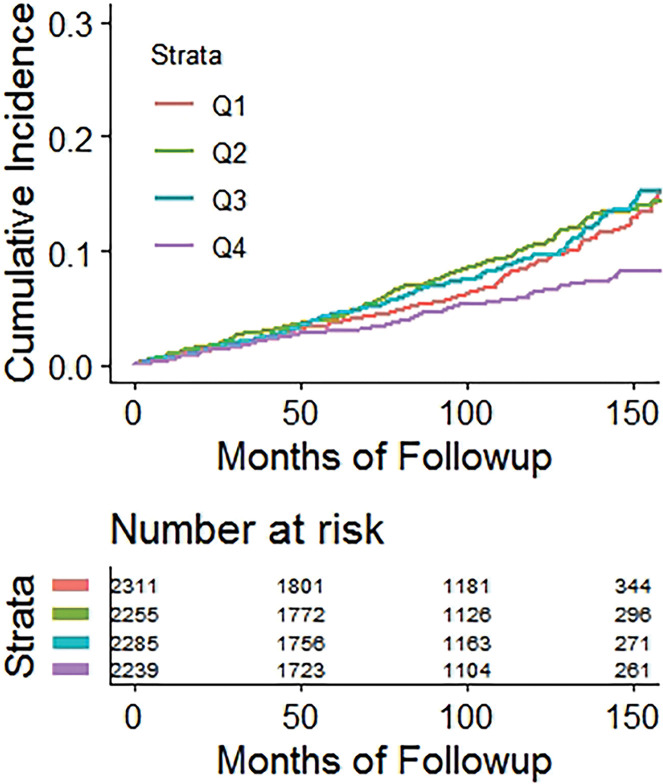
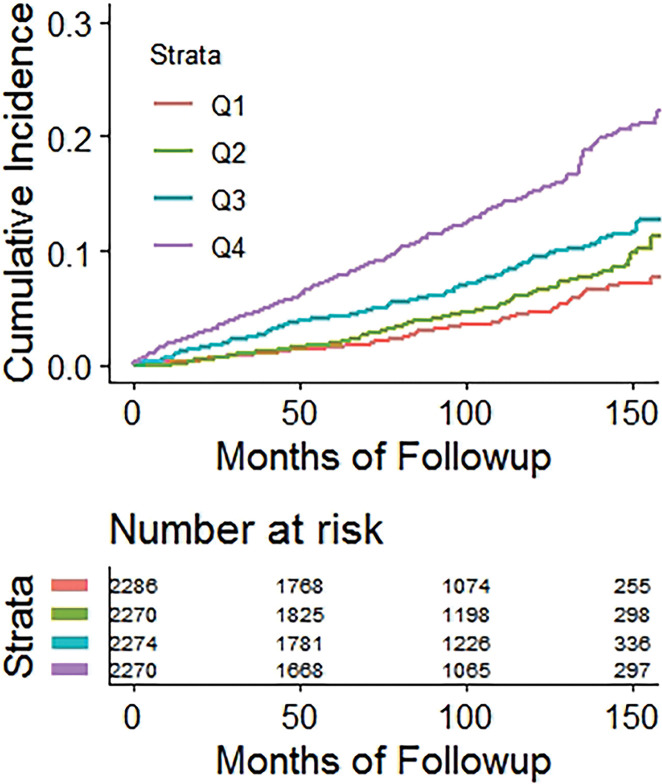
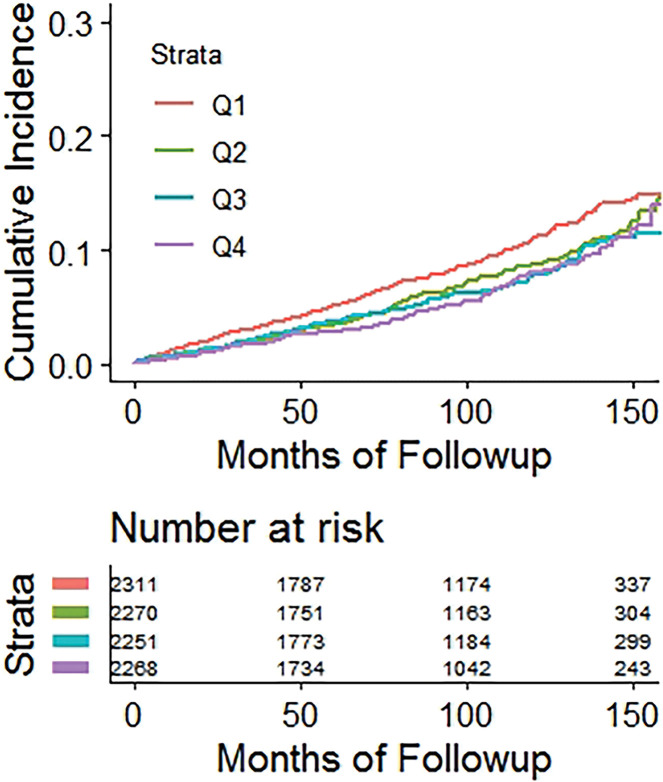
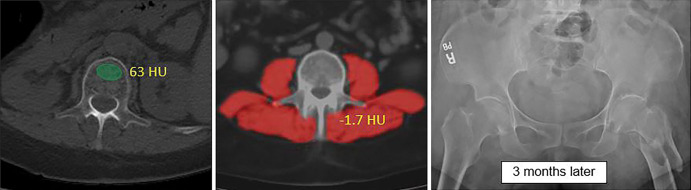
Background Body composition data from abdominal CT scans have the potential to opportunistically identify those at risk for future fracture. Purpose To apply automated bone, muscle, and fat tools to noncontrast CT to assess performance for predicting major osteoporotic fractures and to compare with the Fracture Risk Assessment Tool (FRAX) reference standard. Materials and Methods Fully automated bone attenuation (L1-level attenuation), muscle attenuation (L3-level attenuation), and fat (L1-level visceral-to-subcutaneous [V/S] ratio) measures were derived from noncontrast low-dose abdominal CT scans in a generally healthy asymptomatic adult outpatient cohort from 2004 to 2016. The FRAX score was calculated from data derived from an algorithmic electronic health record search. The cohort was assessed for subsequent future fragility fractures. Subset analysis was performed for patients evaluated with dual x-ray absorptiometry (n = 2106). Hazard ratios (HRs) and receiver operating characteristic curve analyses were performed. Results A total of 9223 adults were evaluated (mean age, 57 years ± 8 [standard deviation]; 5152 women) at CT and were followed over a median time of 8.8 years (interquartile range, 5.1-11.6 years), with documented subsequent major osteoporotic fractures in 7.4% (n = 686), including hip fractures in 2.4% (n = 219). Comparing the highest-risk quartile with the other three quartiles, HRs for bone attenuation, muscle attenuation, V/S fat ratio, and FRAX were 2.1, 1.9, 0.98, and 2.5 for any fragility fracture and 2.0, 2.5, 1.1, and 2.5 for femoral fractures, respectively (P < .001 for all except V/S ratio, which was P ≥ .51). Area under the receiver operating characteristic curve (AUC) values for fragility fracture were 0.71, 0.65, 0.51, and 0.72 at 2 years and 0.63, 0.62, 0.52, and 0.65 at 10 years, respectively. For hip fractures, 2-year AUC for muscle attenuation alone was 0.75 compared with 0.73 for FRAX (P = .43). Multivariable 2-year AUC combining bone and muscle attenuation was 0.73 for any fragility fracture and 0.76 for hip fractures, respectively (P ≥ .73 compared with FRAX). For the subset with dual x-ray absorptiometry T-scores, 2-year AUC was 0.74 for bone attenuation and 0.65 for FRAX (P = .11). Conclusion Automated bone and muscle imaging biomarkers derived from CT scans provided comparable performance to Fracture Risk Assessment Tool score for presymptomatic prediction of future osteoporotic fractures. Muscle attenuation alone provided effective hip fracture prediction. © RSNA, 2020 See also the editorial by Smith in this issue.


Figures

None
Graphical abstract
Depiction of the fully automated CT imaging biomarker tools used to assess bone, muscle, and fat from the original abdominal CT scan data. In practice, one can review the visual tool outputs to allow for quality assurance of the automated segmentation results in individual patients. CT biomarkers results were then correlated with subsequent fragility fractures.
Figure 1:
Depiction of the fully automated CT imaging biomarker tools used to assess bone, muscle, and fat from the original abdominal CT scan data. In practice, one can review the visual tool outputs to allow for quality assurance of the automated segmentation results in individual patients. CT biomarkers results were then correlated with subsequent fragility fractures.
Kaplan-Meier time-to-fracture plots by quartile for the clinical and automated CT parameters. Separation between quartiles over time for future fragility fractures (n = 686) was observed for the automated CT parameters of (a) bone attenuation, (b) muscle attenuation, (c) visceral-to-subcutaneous (V/S) fat ratio, (d) Fracture Risk Assessment Tool (FRAX), and (e) body mass index (BMI). Quartile separation was much less pronounced for the fat-based measures (V/S ratio and BMI). However, the highest V/S quartile showed lower fracture incidence over time.
Figure 2a:
Kaplan-Meier time-to-fracture plots by quartile for the clinical and automated CT parameters. Separation between quartiles over time for future fragility fractures (n = 686) was observed for the automated CT parameters of (a) bone attenuation, (b) muscle attenuation, (c) visceral-to-subcutaneous (V/S) fat ratio, (d) Fracture Risk Assessment Tool (FRAX), and (e) body mass index (BMI). Quartile separation was much less pronounced for the fat-based measures (V/S ratio and BMI). However, the highest V/S quartile showed lower fracture incidence over time.
Figure 2b:
Kaplan-Meier time-to-fracture plots by quartile for the clinical and automated CT parameters. Separation between quartiles over time for future fragility fractures (n = 686) was observed for the automated CT parameters of (a) bone attenuation, (b) muscle attenuation, (c) visceral-to-subcutaneous (V/S) fat ratio, (d) Fracture Risk Assessment Tool (FRAX), and (e) body mass index (BMI). Quartile separation was much less pronounced for the fat-based measures (V/S ratio and BMI). However, the highest V/S quartile showed lower fracture incidence over time.
Figure 2c:
Kaplan-Meier time-to-fracture plots by quartile for the clinical and automated CT parameters. Separation between quartiles over time for future fragility fractures (n = 686) was observed for the automated CT parameters of (a) bone attenuation, (b) muscle attenuation, (c) visceral-to-subcutaneous (V/S) fat ratio, (d) Fracture Risk Assessment Tool (FRAX), and (e) body mass index (BMI). Quartile separation was much less pronounced for the fat-based measures (V/S ratio and BMI). However, the highest V/S quartile showed lower fracture incidence over time.
Figure 2d:
Kaplan-Meier time-to-fracture plots by quartile for the clinical and automated CT parameters. Separation between quartiles over time for future fragility fractures (n = 686) was observed for the automated CT parameters of (a) bone attenuation, (b) muscle attenuation, (c) visceral-to-subcutaneous (V/S) fat ratio, (d) Fracture Risk Assessment Tool (FRAX), and (e) body mass index (BMI). Quartile separation was much less pronounced for the fat-based measures (V/S ratio and BMI). However, the highest V/S quartile showed lower fracture incidence over time.
Figure 2e:
Kaplan-Meier time-to-fracture plots by quartile for the clinical and automated CT parameters. Separation between quartiles over time for future fragility fractures (n = 686) was observed for the automated CT parameters of (a) bone attenuation, (b) muscle attenuation, (c) visceral-to-subcutaneous (V/S) fat ratio, (d) Fracture Risk Assessment Tool (FRAX), and (e) body mass index (BMI). Quartile separation was much less pronounced for the fat-based measures (V/S ratio and BMI). However, the highest V/S quartile showed lower fracture incidence over time.
Receiver operating characteristic (ROC) curves for predicting future fragility fractures. (a) ROC curves for predicting any fragility fracture over a 2-year time horizon shows comparable performance between the univariable L1-bone attenuation (area under the ROC curve [AUC] = 0.71) and the multivariable Fracture Risk Assessment Tool (FRAX) (AUC = 0.72), whereas visceral-to-subcutaneous (V/S) fat ratio was a poor predictor (AUC = 0.51). When bone attenuation and muscle attenuation are combined, the performance improves slightly (AUC = 0.73). (b) ROC curves for predicting hip fractures over a 2-year time horizon show that the univariable muscle attenuation alone (AUC = 0.75) compares favorably with the multivariable FRAX (AUC = 0.73). When bone attenuation and muscle attenuation are combined (not shown), the performance is further improved, albeit only slightly (AUC = 0.76).
Figure 3a:
Receiver operating characteristic (ROC) curves for predicting future fragility fractures. (a) ROC curves for predicting any fragility fracture over a 2-year time horizon shows comparable performance between the univariable L1-bone attenuation (area under the ROC curve [AUC] = 0.71) and the multivariable Fracture Risk Assessment Tool (FRAX) (AUC = 0.72), whereas visceral-to-subcutaneous (V/S) fat ratio was a poor predictor (AUC = 0.51). When bone attenuation and muscle attenuation are combined, the performance improves slightly (AUC = 0.73). (b) ROC curves for predicting hip fractures over a 2-year time horizon show that the univariable muscle attenuation alone (AUC = 0.75) compares favorably with the multivariable FRAX (AUC = 0.73). When bone attenuation and muscle attenuation are combined (not shown), the performance is further improved, albeit only slightly (AUC = 0.76).
Figure 3b:
Receiver operating characteristic (ROC) curves for predicting future fragility fractures. (a) ROC curves for predicting any fragility fracture over a 2-year time horizon shows comparable performance between the univariable L1-bone attenuation (area under the ROC curve [AUC] = 0.71) and the multivariable Fracture Risk Assessment Tool (FRAX) (AUC = 0.72), whereas visceral-to-subcutaneous (V/S) fat ratio was a poor predictor (AUC = 0.51). When bone attenuation and muscle attenuation are combined, the performance improves slightly (AUC = 0.73). (b) ROC curves for predicting hip fractures over a 2-year time horizon show that the univariable muscle attenuation alone (AUC = 0.75) compares favorably with the multivariable FRAX (AUC = 0.73). When bone attenuation and muscle attenuation are combined (not shown), the performance is further improved, albeit only slightly (AUC = 0.76).
Individual example demonstrates the potential for CT-based fracture prediction. (a) Transverse nonenhanced CT images from a 59-year-old asymptomatic woman undergoing colonography for colorectal cancer screening. Automated bone (63 HU) and muscle (−1.7 HU) attenuation were at the 99th and 98th percentiles, respectively, relative to the screening study cohort, but Fracture Risk Assessment Tool scores of 6.7% (any fracture) and 0.5% (for hip fracture) were well below the recommended treatment threshold. However, she suffered a left femoral neck fracture only 3 months later. (b) The patient had multiple prior nonenhanced CT examinations for urolithiasis over the years, which in retrospect demonstrated progressive decrease in L1 bone attenuation (as shown). Unfortunately, this information is typically not yet considered in routine clinical practice for CT examinations performed for other indications.
Figure 4a:
Individual example demonstrates the potential for CT-based fracture prediction. (a) Transverse nonenhanced CT images from a 59-year-old asymptomatic woman undergoing colonography for colorectal cancer screening. Automated bone (63 HU) and muscle (−1.7 HU) attenuation were at the 99th and 98th percentiles, respectively, relative to the screening study cohort, but Fracture Risk Assessment Tool scores of 6.7% (any fracture) and 0.5% (for hip fracture) were well below the recommended treatment threshold. However, she suffered a left femoral neck fracture only 3 months later. (b) The patient had multiple prior nonenhanced CT examinations for urolithiasis over the years, which in retrospect demonstrated progressive decrease in L1 bone attenuation (as shown). Unfortunately, this information is typically not yet considered in routine clinical practice for CT examinations performed for other indications.
Figure 4b:
Individual example demonstrates the potential for CT-based fracture prediction. (a) Transverse nonenhanced CT images from a 59-year-old asymptomatic woman undergoing colonography for colorectal cancer screening. Automated bone (63 HU) and muscle (−1.7 HU) attenuation were at the 99th and 98th percentiles, respectively, relative to the screening study cohort, but Fracture Risk Assessment Tool scores of 6.7% (any fracture) and 0.5% (for hip fracture) were well below the recommended treatment threshold. However, she suffered a left femoral neck fracture only 3 months later. (b) The patient had multiple prior nonenhanced CT examinations for urolithiasis over the years, which in retrospect demonstrated progressive decrease in L1 bone attenuation (as shown). Unfortunately, this information is typically not yet considered in routine clinical practice for CT examinations performed for other indications.

Comment in

References

    1. Khosla S, Hofbauer LC. Osteoporosis treatment: recent developments and ongoing challenges. Lancet Diabetes Endocrinol 2017;5(11):898–907. - PMC - PubMed
    1. Burge R, Dawson-Hughes B, Solomon DH, Wong JB, King A, Tosteson A. Incidence and economic burden of osteoporosis-related fractures in the United States, 2005-2025. J Bone Miner Res 2007;22(3):465–475. - PubMed
    1. Roux C, Briot K. The crisis of inadequate treatment in osteoporosis. Lancet Rheumatol 2020;2(2):e110–e119. - PubMed
    1. Haentjens P, Magaziner J, Colón-Emeric CS, et al. Meta-analysis: excess mortality after hip fracture among older women and men. Ann Intern Med 2010;152(6):380–390. - PMC - PubMed
    1. Kanis JA, Johnell O, Oden A, Johansson H, McCloskey E. FRAX and the assessment of fracture probability in men and women from the UK. Osteoporos Int 2008;19(4):385–397. - PMC - PubMed

Publication types