. 2020 Oct;11(10):740-770.
doi: 10.1007/s13238-020-00762-2. Epub 2020 Aug 11.

A human circulating immune cell landscape in aging and COVID-19

Affiliations

A human circulating immune cell landscape in aging and COVID-19

Yingfeng Zheng et al. Protein Cell. 2020 Oct.

Abstract

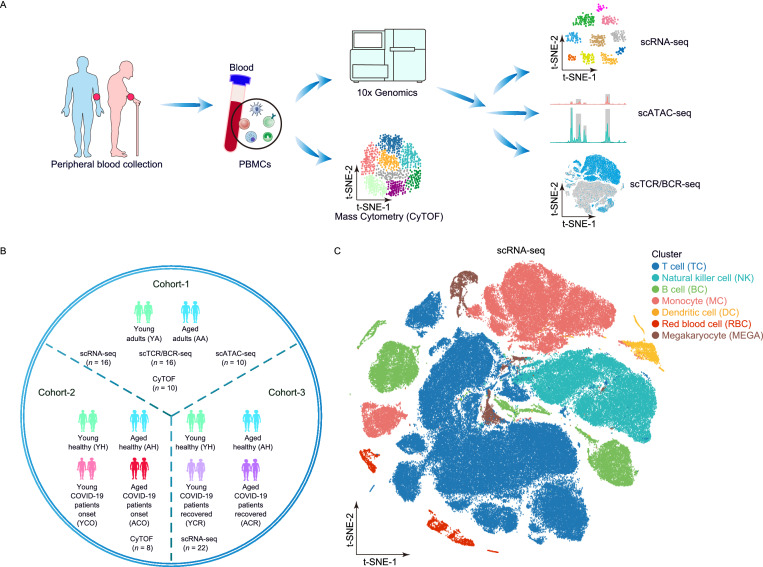
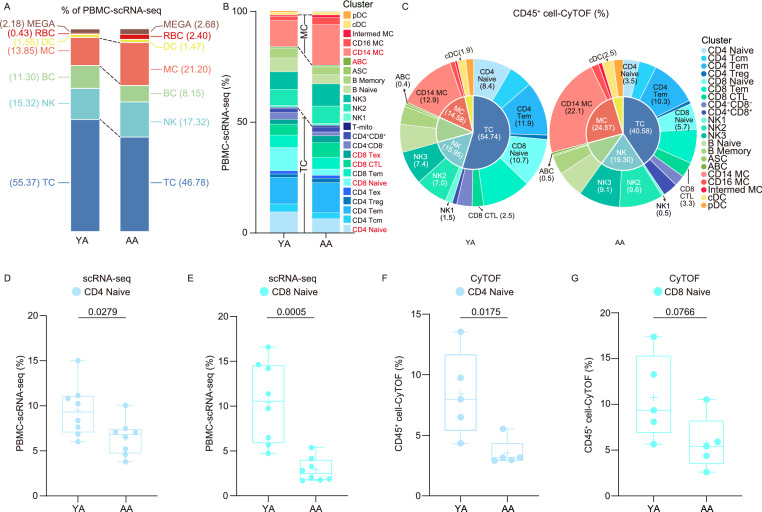
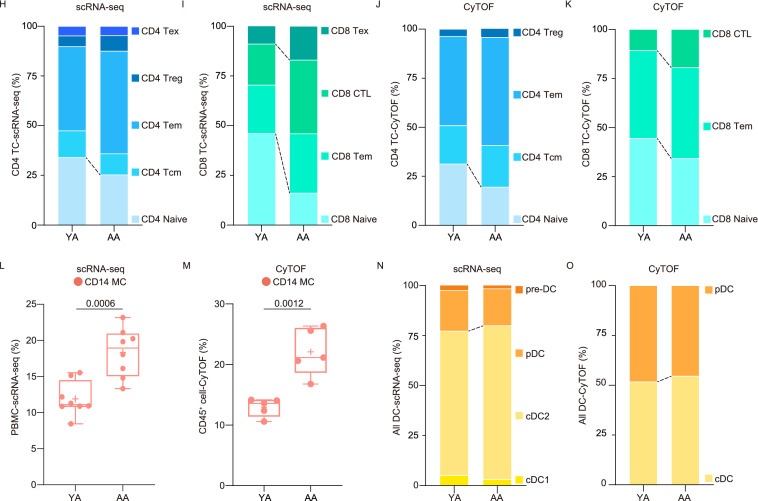
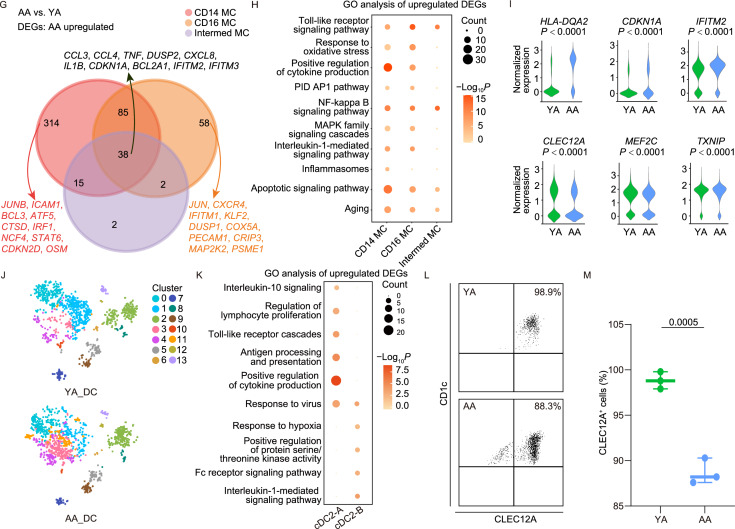
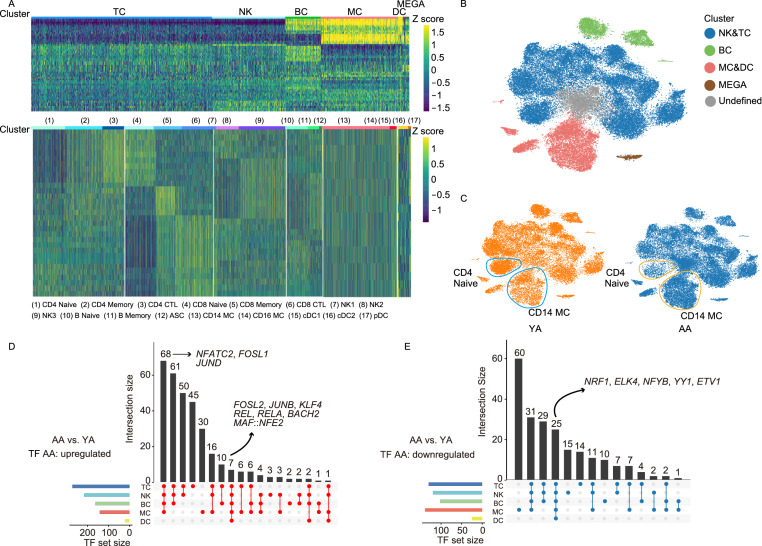
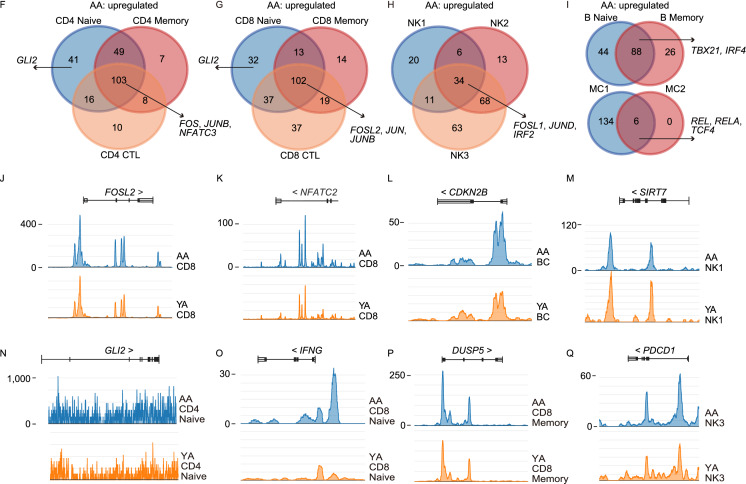
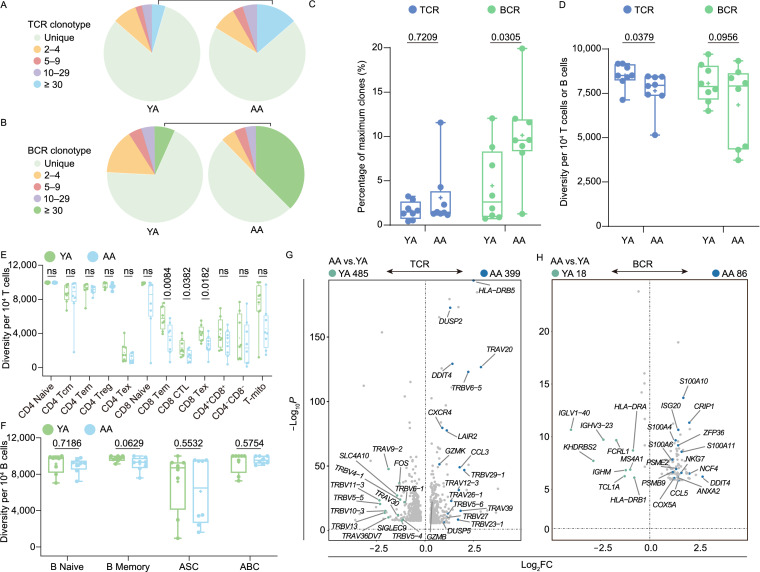
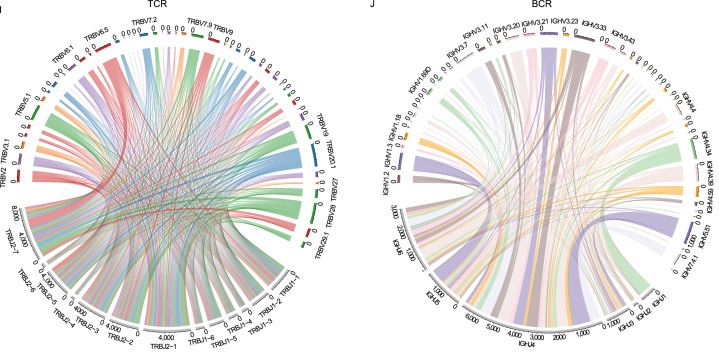
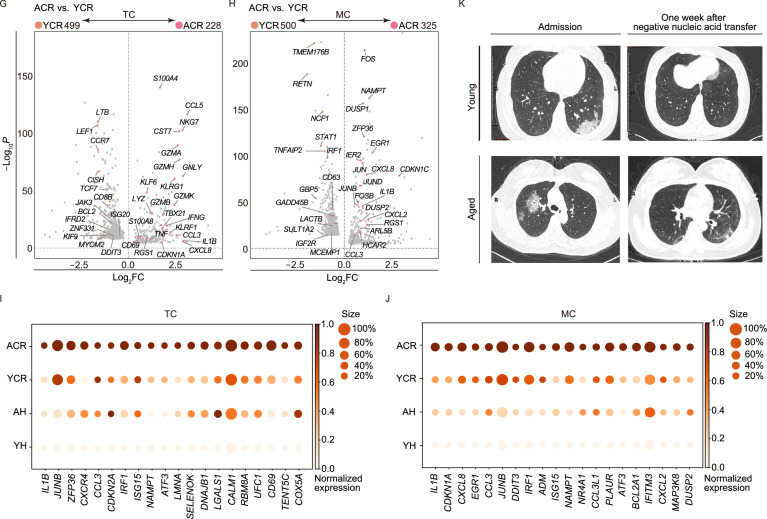
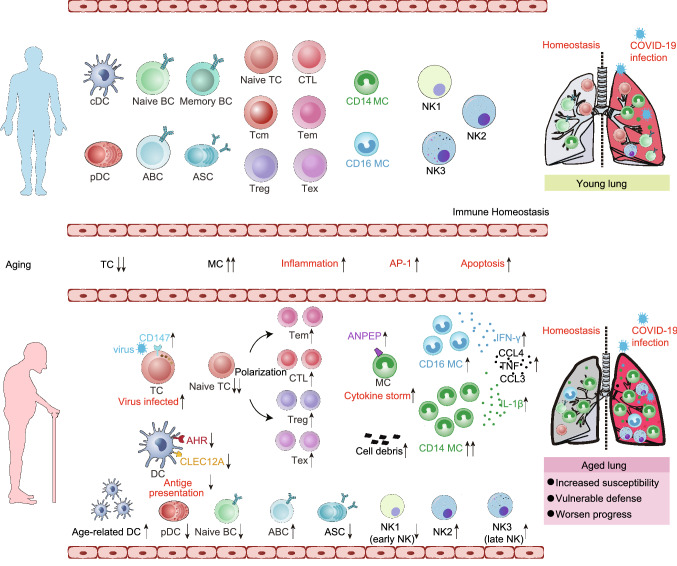
Age-associated changes in immune cells have been linked to an increased risk for infection. However, a global and detailed characterization of the changes that human circulating immune cells undergo with age is lacking. Here, we combined scRNA-seq, mass cytometry and scATAC-seq to compare immune cell types in peripheral blood collected from young and old subjects and patients with COVID-19. We found that the immune cell landscape was reprogrammed with age and was characterized by T cell polarization from naive and memory cells to effector, cytotoxic, exhausted and regulatory cells, along with increased late natural killer cells, age-associated B cells, inflammatory monocytes and age-associated dendritic cells. In addition, the expression of genes, which were implicated in coronavirus susceptibility, was upregulated in a cell subtype-specific manner with age. Notably, COVID-19 promoted age-induced immune cell polarization and gene expression related to inflammation and cellular senescence. Therefore, these findings suggest that a dysregulated immune system and increased gene expression associated with SARS-CoV-2 susceptibility may at least partially account for COVID-19 vulnerability in the elderly.

Keywords: COVID-19; aging; blood; immune cells; single-cell sequencing.


Figures

Figure 1
Figure 1
Schematic illustration of the collection and data processing of PBMC from young and aged group. (A) Flowchart overview of PBMC collection in young and aged adults followed by scRNA-seq, mass cytometry, scATAC-seq and scTCR/BCR-seq experiments. (B) Schematic illustration of experimental cohorts; cohort-1: young and aged adults, cohort-2: young and aged healthy individuals, young and aged adults with COVID-19 onset, cohort-3: young and aged healthy individuals, young and aged adults recovered from COVID-19, matched with analysis as indicated: single-cell proteomic data from CyTOF studies, gene expression data from scRNA-seq studies, chromosomal accessibility data from scATAC-seq, and TCR and BCR repertoire data from scTCR/BCR-seq. (C) t-SNE projections of PBMCs derived from scRNA-seq data in cohort-1. (D) Heatmaps showing scaled expression of discriminative gene sets for each cell type and cell subset. Color scheme is based on z-score distribution from −3 (purple) to 3 (yellow)
Figure 1
Figure 1
Schematic illustration of the collection and data processing of PBMC from young and aged group. (A) Flowchart overview of PBMC collection in young and aged adults followed by scRNA-seq, mass cytometry, scATAC-seq and scTCR/BCR-seq experiments. (B) Schematic illustration of experimental cohorts; cohort-1: young and aged adults, cohort-2: young and aged healthy individuals, young and aged adults with COVID-19 onset, cohort-3: young and aged healthy individuals, young and aged adults recovered from COVID-19, matched with analysis as indicated: single-cell proteomic data from CyTOF studies, gene expression data from scRNA-seq studies, chromosomal accessibility data from scATAC-seq, and TCR and BCR repertoire data from scTCR/BCR-seq. (C) t-SNE projections of PBMCs derived from scRNA-seq data in cohort-1. (D) Heatmaps showing scaled expression of discriminative gene sets for each cell type and cell subset. Color scheme is based on z-score distribution from −3 (purple) to 3 (yellow)
Figure 2
Figure 2
Changes in cell proportions during aging. (A) Bar chart of the relative percentage of immune cell types derived from scRNA-seq data in PBMCs. (B) Bar chart of the relative percentage of immune cell subsets derived from scRNA-seq data in PBMCs. The focused cell-subsets have been marked red. (C) Pie charts showing relative cluster abundances derived from mass cytometry data in the YA and AA groups. (D) Percentage of CD4 Naive cells in PBMCs from YA (n = 8) and AA (n = 8) groups. (E) Percentage of CD8 Naive cells in PBMCs from YA (n = 8) and AA (n = 8) groups. (F) Percentage of CD4 Naive cells in CD45+ cells from YA (n = 5) and AA (n = 5) groups. (G) Percentage of CD8 Naive cells in CD45+ cells from YA (n = 5) and AA (n = 5) groups. (H) Bar chart of the relative percentage of CD4+ T cell subsets derived from scRNA-seq data in PBMCs. (I) Bar chart of the relative percentage of CD8+ T cell subsets derived from scRNA-seq data in PBMCs. (J) Bar chart of the relative percentage of CD4+ T cell subsets derived from mass cytometry data in CD45+ cells. (K) Bar chart of the relative percentage of CD8+ T cell subsets derived from mass cytometry data in CD45+ cells. (L) Percentage of CD14 monocytes in PBMCs from YA (n = 8) and AA (n = 8) groups. (M) Percentage of CD14 monocytes in CD45+ cells from YA (n = 5) and AA (n = 5) groups. (N) Bar chart of the relative percentage of DC subsets derived from scRNA-seq data in PBMCs. (O) Bar chart of the relative percentage of DC subsets derived from mass cytometry data in CD45+ cells. P values are based on two-tailed Mann-Whitney-Wilcoxon tests between groups
Figure 2
Figure 2
Changes in cell proportions during aging. (A) Bar chart of the relative percentage of immune cell types derived from scRNA-seq data in PBMCs. (B) Bar chart of the relative percentage of immune cell subsets derived from scRNA-seq data in PBMCs. The focused cell-subsets have been marked red. (C) Pie charts showing relative cluster abundances derived from mass cytometry data in the YA and AA groups. (D) Percentage of CD4 Naive cells in PBMCs from YA (n = 8) and AA (n = 8) groups. (E) Percentage of CD8 Naive cells in PBMCs from YA (n = 8) and AA (n = 8) groups. (F) Percentage of CD4 Naive cells in CD45+ cells from YA (n = 5) and AA (n = 5) groups. (G) Percentage of CD8 Naive cells in CD45+ cells from YA (n = 5) and AA (n = 5) groups. (H) Bar chart of the relative percentage of CD4+ T cell subsets derived from scRNA-seq data in PBMCs. (I) Bar chart of the relative percentage of CD8+ T cell subsets derived from scRNA-seq data in PBMCs. (J) Bar chart of the relative percentage of CD4+ T cell subsets derived from mass cytometry data in CD45+ cells. (K) Bar chart of the relative percentage of CD8+ T cell subsets derived from mass cytometry data in CD45+ cells. (L) Percentage of CD14 monocytes in PBMCs from YA (n = 8) and AA (n = 8) groups. (M) Percentage of CD14 monocytes in CD45+ cells from YA (n = 5) and AA (n = 5) groups. (N) Bar chart of the relative percentage of DC subsets derived from scRNA-seq data in PBMCs. (O) Bar chart of the relative percentage of DC subsets derived from mass cytometry data in CD45+ cells. P values are based on two-tailed Mann-Whitney-Wilcoxon tests between groups
Figure 3
Figure 3
Changes in transcriptional profiles during aging. (A) UpSet Plot showing the integrated comparative analysis of upregulated DEGs in major immune cell lineages between YA and AA groups. Upregulated DEGs: upregulated in AA, downregulated in YA group. (B) Representative GO terms and pathways enriched in upregulated DEGs based on functional enrichment analysis in major immune cell populations. P value was derived by a hypergeometric test. (C) Distribution and comparison of the aging score in immune cell populations. (D) Distribution and comparison of the aging score in all cells of each sample. (E) UpSet plot showing the integrated comparative analysis of upregulated DEGs in CD4+ T cells between YA and AA groups. Upregulated DEGs: upregulated in AA, downregulated in YA. The count showing the number of DEGs. (F) Representative GO terms and pathways enriched in upregulated DEGs based on functional enrichment analysis in CD4+ T cells. P value was derived by a hypergeometric test. (G) Venn diagram showing integrated comparative analysis of upregulated DEGs in monocytes between YA and AA groups. Upregulated DEGs: upregulated in AA, downregulated in YA. The count showing the number of DEGs. (H) Representative GO terms and pathways enriched in upregulated DEGs based on functional enrichment analysis in monocytes. P value was derived by a hypergeometric test. (I) Violin plots showing the distribution of normalized expression levels of selected aging-associated genes in all DC cluster between YA and AA groups. (J) t-SNE plots segregated on the basis of DC subsets. (K) Representative GO terms and pathways enriched in biased DEGs of cDC2-A and cDC2-B clusters. P value was derived by a hypergeometric test. (L) CLEC12A expression in cDC2 is shown as flow cytometry histogram. (M) Percentage of CLEC12A+ cells in cDC2. P value are based on two-tailed Mann-Whitney-Wilcoxon tests between YA and AA groups (n = 3/group)
Figure 3
Figure 3
Changes in transcriptional profiles during aging. (A) UpSet Plot showing the integrated comparative analysis of upregulated DEGs in major immune cell lineages between YA and AA groups. Upregulated DEGs: upregulated in AA, downregulated in YA group. (B) Representative GO terms and pathways enriched in upregulated DEGs based on functional enrichment analysis in major immune cell populations. P value was derived by a hypergeometric test. (C) Distribution and comparison of the aging score in immune cell populations. (D) Distribution and comparison of the aging score in all cells of each sample. (E) UpSet plot showing the integrated comparative analysis of upregulated DEGs in CD4+ T cells between YA and AA groups. Upregulated DEGs: upregulated in AA, downregulated in YA. The count showing the number of DEGs. (F) Representative GO terms and pathways enriched in upregulated DEGs based on functional enrichment analysis in CD4+ T cells. P value was derived by a hypergeometric test. (G) Venn diagram showing integrated comparative analysis of upregulated DEGs in monocytes between YA and AA groups. Upregulated DEGs: upregulated in AA, downregulated in YA. The count showing the number of DEGs. (H) Representative GO terms and pathways enriched in upregulated DEGs based on functional enrichment analysis in monocytes. P value was derived by a hypergeometric test. (I) Violin plots showing the distribution of normalized expression levels of selected aging-associated genes in all DC cluster between YA and AA groups. (J) t-SNE plots segregated on the basis of DC subsets. (K) Representative GO terms and pathways enriched in biased DEGs of cDC2-A and cDC2-B clusters. P value was derived by a hypergeometric test. (L) CLEC12A expression in cDC2 is shown as flow cytometry histogram. (M) Percentage of CLEC12A+ cells in cDC2. P value are based on two-tailed Mann-Whitney-Wilcoxon tests between YA and AA groups (n = 3/group)
Figure 4
Figure 4
Changes in chromosomal accessibility during aging. (A) Heatmaps showing scaled expression of discriminative gene sets for each cell type and cell subset. Color scheme is based on z-score distribution from −1.5 (purple) to 1.5 (yellow). (B) t-SNE projections of PBMCs derived from scATAC-seq data. (C) t-SNE plots segregated by YA and AA groups. (D) UpSet plot showing the integrated comparative analysis of upregulated differentially expressed transcription factors (DETs) in major immune cell populations between YA and AA groups. Upregulated DETs: upregulated in AA, downregulated in YA. The count showing the number of DETs. (E) UpSet plot showing the integrative comparative analysis of downregulated DETs in major immune cell populations between YA and AA groups. Downregulated DETs: upregulated in YA, downregulated in AA. The count showing the number of DETs. (F) Venn diagram showing integrated comparative analysis of upregulated DETs in CD4+ T cells between YA and AA groups. Upregulated DETs: upregulated in AA, downregulated in YA. The count showing the number of DETs. (G) Venn diagram showing integrated comparative analysis of upregulated DETs in CD8+ T cells between YA and AA groups. Upregulated DETs: upregulated in AA, downregulated in YA. The count showing the number of DETs. (H) Venn diagram showing integrated comparative analysis of upregulated DETs in NK cells between YA and AA groups. Upregulated DETs: upregulated in AA, downregulated in YA. The count showing the number of DETs. (I) Venn diagram showing integrated comparative analysis of upregulated DETs in B cells (top) and monocytes (bottom) between YA and AA groups. Upregulated DETs: upregulated in AA, downregulated in YA. The count showing the number of DETs. (J) Mean scATAC-seq coverage at FOSL2 loci in CD8+ T cells. (K) Mean scATAC-seq coverage at NFATC2 loci in CD8+ T cells. (L) Mean scATAC-seq coverage at CDKN2B loci in B cells. (M) Mean scATAC-seq coverage at SIRT7 loci in NK1 cells. (N) Mean scATAC-seq coverage at GLI2 loci in CD4 Naive cells. (O) Mean scATAC-seq coverage at IFNG loci in CD8 Naive cells. (P) Mean scATAC-seq coverage at DUSP5 loci in CD8 Memory cells. (Q) Mean scATAC-seq coverage at PDCD1 loci in NK3 cells
Figure 4
Figure 4
Changes in chromosomal accessibility during aging. (A) Heatmaps showing scaled expression of discriminative gene sets for each cell type and cell subset. Color scheme is based on z-score distribution from −1.5 (purple) to 1.5 (yellow). (B) t-SNE projections of PBMCs derived from scATAC-seq data. (C) t-SNE plots segregated by YA and AA groups. (D) UpSet plot showing the integrated comparative analysis of upregulated differentially expressed transcription factors (DETs) in major immune cell populations between YA and AA groups. Upregulated DETs: upregulated in AA, downregulated in YA. The count showing the number of DETs. (E) UpSet plot showing the integrative comparative analysis of downregulated DETs in major immune cell populations between YA and AA groups. Downregulated DETs: upregulated in YA, downregulated in AA. The count showing the number of DETs. (F) Venn diagram showing integrated comparative analysis of upregulated DETs in CD4+ T cells between YA and AA groups. Upregulated DETs: upregulated in AA, downregulated in YA. The count showing the number of DETs. (G) Venn diagram showing integrated comparative analysis of upregulated DETs in CD8+ T cells between YA and AA groups. Upregulated DETs: upregulated in AA, downregulated in YA. The count showing the number of DETs. (H) Venn diagram showing integrated comparative analysis of upregulated DETs in NK cells between YA and AA groups. Upregulated DETs: upregulated in AA, downregulated in YA. The count showing the number of DETs. (I) Venn diagram showing integrated comparative analysis of upregulated DETs in B cells (top) and monocytes (bottom) between YA and AA groups. Upregulated DETs: upregulated in AA, downregulated in YA. The count showing the number of DETs. (J) Mean scATAC-seq coverage at FOSL2 loci in CD8+ T cells. (K) Mean scATAC-seq coverage at NFATC2 loci in CD8+ T cells. (L) Mean scATAC-seq coverage at CDKN2B loci in B cells. (M) Mean scATAC-seq coverage at SIRT7 loci in NK1 cells. (N) Mean scATAC-seq coverage at GLI2 loci in CD4 Naive cells. (O) Mean scATAC-seq coverage at IFNG loci in CD8 Naive cells. (P) Mean scATAC-seq coverage at DUSP5 loci in CD8 Memory cells. (Q) Mean scATAC-seq coverage at PDCD1 loci in NK3 cells
Figure 5
Figure 5
Abnormal TCR and BCR repertoire during aging. (A) Pie plots showing TCR clone differences across YA and AA groups. (B) Pie plots showing BCR clone differences across YA and AA groups. (C) Percentage of maximum clones between YA (n = 8) and AA groups (n = 8). (D) Diversity of TCR and BCR between YA (n = 8) and AA groups (n = 8). (E) Diversity of TCR in T cell subsets between YA (n = 8) and AA groups (n = 8). (F) Diversity of BCR in B cell subsets between YA (n = 8) and AA groups (n = 8). (G) Volcano plot showing DEGs of clonal T cells between the YA and AA groups. P values were calculated using a paired, two-sided Wilcoxon test and FDR was corrected using the Benjamini-Hochberg procedure. (H) Volcano plot showing DEGs of clonal B cells between the YA and AA groups. P values were calculated using a paired, two-sided Wilcoxon test and FDR was corrected using the Benjamini-Hochberg procedure. (I) Chord diagram showing pairing of V and J segments within the TRB subset from the AA group. Chord widths represent the proportion of sequences with a given V (colored) and J (gray) segment pairing. (J) Chord diagram showing pairing of V and J segments within the IGH subset from the AA group. Chord widths represent the proportion of sequences with a given V (colored) and J (gray) segment pairing
Figure 5
Figure 5
Abnormal TCR and BCR repertoire during aging. (A) Pie plots showing TCR clone differences across YA and AA groups. (B) Pie plots showing BCR clone differences across YA and AA groups. (C) Percentage of maximum clones between YA (n = 8) and AA groups (n = 8). (D) Diversity of TCR and BCR between YA (n = 8) and AA groups (n = 8). (E) Diversity of TCR in T cell subsets between YA (n = 8) and AA groups (n = 8). (F) Diversity of BCR in B cell subsets between YA (n = 8) and AA groups (n = 8). (G) Volcano plot showing DEGs of clonal T cells between the YA and AA groups. P values were calculated using a paired, two-sided Wilcoxon test and FDR was corrected using the Benjamini-Hochberg procedure. (H) Volcano plot showing DEGs of clonal B cells between the YA and AA groups. P values were calculated using a paired, two-sided Wilcoxon test and FDR was corrected using the Benjamini-Hochberg procedure. (I) Chord diagram showing pairing of V and J segments within the TRB subset from the AA group. Chord widths represent the proportion of sequences with a given V (colored) and J (gray) segment pairing. (J) Chord diagram showing pairing of V and J segments within the IGH subset from the AA group. Chord widths represent the proportion of sequences with a given V (colored) and J (gray) segment pairing
Figure 6
Figure 6
Poor outcomes upon COVID-19 infection is associated with imbalanced cellular aging. (A) t-SNE projections of PBMCs derived from mass cytometry data in cohort-2. (B) Heatmap showing mean population expression levels of all markers. (C) t-SNE plots segregated by HC and CO groups. HC includes YH (n = 2) and AH (n = 2); CO includes YCO (n = 2) and ACO (n = 2). (D) Percentage of immune cell populations in PBMC between HC (n = 4) and CO (n = 4) groups. (E) Bar chart of the relative percentage of major immune cell populations derived from mass cytometry data between HC and CO groups. (F) Percentage of CD4 Naive cells in CD45+ cells between HC (n = 4) and CO (n = 4) groups. (G) Percentage of NK2 cells in CD45+ cells between HC (n = 4) and CO (n = 4) groups. (H) Percentage of CD16 monocytes in CD45+ cells between HC (n = 4) and CO (n = 4) groups. (I) Bar chart of the relative percentage of major immune cells derived from mass cytometry data from YH, AH and ACO groups. (J) Bar chart of the relative percentage of T cell subsets derived from mass cytometry data from YH, AH and ACO groups. (K) Bar chart of the relative percentage of NK cell subsets derived from mass cytometry data from YH, AH and ACO groups. (L) Bar chart of the relative percentage of B cell subsets derived from mass cytometry data from YH, AH and ACO groups. (M) Bar chart of the relative percentage of DC subsets derived from mass cytometry data from YH, AH and ACO groups. (N) Bar chart of the relative percentage of monocyte subsets derived from mass cytometry data from YH, AH and ACO groups. (O) Bar chart of the relative percentage of major immune cell populations derived from mass cytometry data between YCO and ACO groups. (P) CT photography showing the different evolution of Lung Ground-Glass Opacity in young and aged patients with COVID-19. CT, computed tomography. P values are based on two-tailed Mann-Whitney-Wilcoxon tests between groups
Figure 6
Figure 6
Poor outcomes upon COVID-19 infection is associated with imbalanced cellular aging. (A) t-SNE projections of PBMCs derived from mass cytometry data in cohort-2. (B) Heatmap showing mean population expression levels of all markers. (C) t-SNE plots segregated by HC and CO groups. HC includes YH (n = 2) and AH (n = 2); CO includes YCO (n = 2) and ACO (n = 2). (D) Percentage of immune cell populations in PBMC between HC (n = 4) and CO (n = 4) groups. (E) Bar chart of the relative percentage of major immune cell populations derived from mass cytometry data between HC and CO groups. (F) Percentage of CD4 Naive cells in CD45+ cells between HC (n = 4) and CO (n = 4) groups. (G) Percentage of NK2 cells in CD45+ cells between HC (n = 4) and CO (n = 4) groups. (H) Percentage of CD16 monocytes in CD45+ cells between HC (n = 4) and CO (n = 4) groups. (I) Bar chart of the relative percentage of major immune cells derived from mass cytometry data from YH, AH and ACO groups. (J) Bar chart of the relative percentage of T cell subsets derived from mass cytometry data from YH, AH and ACO groups. (K) Bar chart of the relative percentage of NK cell subsets derived from mass cytometry data from YH, AH and ACO groups. (L) Bar chart of the relative percentage of B cell subsets derived from mass cytometry data from YH, AH and ACO groups. (M) Bar chart of the relative percentage of DC subsets derived from mass cytometry data from YH, AH and ACO groups. (N) Bar chart of the relative percentage of monocyte subsets derived from mass cytometry data from YH, AH and ACO groups. (O) Bar chart of the relative percentage of major immune cell populations derived from mass cytometry data between YCO and ACO groups. (P) CT photography showing the different evolution of Lung Ground-Glass Opacity in young and aged patients with COVID-19. CT, computed tomography. P values are based on two-tailed Mann-Whitney-Wilcoxon tests between groups
Figure 7
Figure 7
Aging and SARS-CoV-2 infection are characterized by similar hyper-inflammatory states. (A) Dot plot showing increased BSG and ANPEP expression in major immune cell populations in the AH group compared to YH group. P values are based on two-tailed Mann-Whitney-Wilcoxon tests between groups. (B) Expression levels of BSG and ANPEP in specific cell types in YH and AH groups. (C) Recapitulative graph of the MFI of CD147 expression in CD3+ T cells. MFI, mean fluorescence intensity. (D) Bar charts of the relative percentage of major immune cell populations derived from scRNA-seq data in YH, AH and ACR group (left), YCR and ACR group (right). (E) Venn diagram showing the integrated comparative analysis of upregulated DEGs in T cells between YH and AH group, YCR and YH group, ACR and AH group. The count shows the number of DEGs. (F) Venn diagram showing the integrated comparative analysis of upregulated DEGs in monocytes between AH and YH groups, YCR and YH groups, ACR and AH groups. The count shows the number of DEGs. (G) Volcano plot showing DEGs in T cells between YCR and ACR groups. P values were calculated using a paired, two-sided Wilcoxon test and FDR was corrected using the Benjamini-Hochberg procedure. (H) Volcano plot showing DEGs in monocytes between YCR and ACR groups. P values were calculated using a paired, two-sided Wilcoxon test and FDR was corrected using the Benjamini-Hochberg procedure. (I) Dot plot showing expression levels of the top 20 aging-induced and disease-associated genes in T cells per group in cohort-3. (J) Dot plot showing expression levels of the top 20 aging-induced and disease-associated genes in monocytes per group in cohort-3. (K) CT photography showing the different manifestation of evolution of Lung Ground-Glass Opacity in young and aged patients with COVID-19
Figure 7
Figure 7
Aging and SARS-CoV-2 infection are characterized by similar hyper-inflammatory states. (A) Dot plot showing increased BSG and ANPEP expression in major immune cell populations in the AH group compared to YH group. P values are based on two-tailed Mann-Whitney-Wilcoxon tests between groups. (B) Expression levels of BSG and ANPEP in specific cell types in YH and AH groups. (C) Recapitulative graph of the MFI of CD147 expression in CD3+ T cells. MFI, mean fluorescence intensity. (D) Bar charts of the relative percentage of major immune cell populations derived from scRNA-seq data in YH, AH and ACR group (left), YCR and ACR group (right). (E) Venn diagram showing the integrated comparative analysis of upregulated DEGs in T cells between YH and AH group, YCR and YH group, ACR and AH group. The count shows the number of DEGs. (F) Venn diagram showing the integrated comparative analysis of upregulated DEGs in monocytes between AH and YH groups, YCR and YH groups, ACR and AH groups. The count shows the number of DEGs. (G) Volcano plot showing DEGs in T cells between YCR and ACR groups. P values were calculated using a paired, two-sided Wilcoxon test and FDR was corrected using the Benjamini-Hochberg procedure. (H) Volcano plot showing DEGs in monocytes between YCR and ACR groups. P values were calculated using a paired, two-sided Wilcoxon test and FDR was corrected using the Benjamini-Hochberg procedure. (I) Dot plot showing expression levels of the top 20 aging-induced and disease-associated genes in T cells per group in cohort-3. (J) Dot plot showing expression levels of the top 20 aging-induced and disease-associated genes in monocytes per group in cohort-3. (K) CT photography showing the different manifestation of evolution of Lung Ground-Glass Opacity in young and aged patients with COVID-19
Figure 8
Figure 8
Aging reprograms human immune cell landscape, and increases the susceptibility and vulnerability of COVID-19. Schematic illustrating the key innate and adaptive immune functional alterations identified in PBMCs influenced by aging and COVID-19. Young healthy individuals maintain homeostasis in immune system which could timely eliminate pathogen. Aging leads to the increase of monocytes (MCs) and the decrease of T cells (TCs) in the immune system. Aging promotes the polarization of TCs from naive and memory to effector, exhausted and regulatory subtypes and increases the numbers of late natural killer (NK) cells, age-associated B cells, inflammatory MCs, and dysfunctional dendritic cells (DCs). Moreover, aging induces increased expression of genes related to SARS-CoV-2 susceptibility, suggesting increased susceptibility in the elderly. Importantly, aging induces DCs to lose the antigen-presenting ability, and turn to an inflammatory state. Together, a dysregulated immune system and increased expression of genes associated with SARS-CoV-2 susceptibility may at least partially account for COVID-19 vulnerability in the elderly

Comment in

References

    1. Alpert A, Pickman Y, Leipold M, Rosenberg-Hasson Y, Ji X, Gaujoux R, Rabani H, Starosvetsky E, Kveler K, Schaffert S, et al. A clinically meaningful metric of immune age derived from high-dimensional longitudinal monitoring. Nat Med. 2019;25(3):487–495. - PMC - PubMed
    1. Angelidis I, Simon LM, Fernandez IE, Strunz M, Mayr CH, Greiffo FR, Tsitsiridis G, Ansari M, Graf E, Strom TM, et al. An atlas of the aging lung mapped by single cell transcriptomics and deep tissue proteomics. Nat Commun. 2019;10(1):963. - PMC - PubMed
    1. Bahar R, Hartmann CH, Rodriguez KA, Denny AD, Busuttil RA, Dollé ME, Calder RB, Chisholm GB, Pollock BH, Klein CA, et al. Increased cell-to-cell variation in gene expression in ageing mouse heart. Nature. 2006;441(7096):1011–1014. - PubMed
    1. Bi S, Liu Z, Wu Z, Wang Z, Liu X, Wang S, Ren J, Yao Y, Zhang W, Song M, et al. SIRT7 antagonizes human stem cell aging as a heterochromatin stabilizer. Protein Cell. 2020;11:483. - PMC - PubMed
    1. Bian H, Zheng Z, Wei D, et al (2020) Meplazumab treats COVID-19 pneumonia: an open-labelled, concurrent controlled add-on clinical trial. medRxiv: 2020.03.21.20040691.

MeSH terms