. 2020 Jul:3:1-22.
doi: 10.1146/annurev-biodatasci-111419-091750. Epub 2020 Mar 2.

Deciphering Cell Fate Decision by Integrated Single-Cell Sequencing Analysis

Affiliations

Deciphering Cell Fate Decision by Integrated Single-Cell Sequencing Analysis

Sagar et al. Annu Rev Biomed Data Sci. 2020 Jul.

Abstract

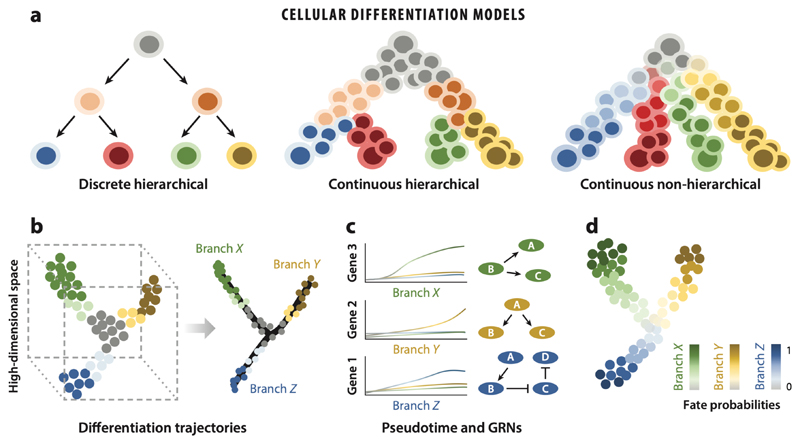
Cellular differentiation is a common underlying feature of all multicellular organisms through which naïve cells progressively become fate restricted and develop into mature cells with specialized functions. A comprehensive understanding of the regulatory mechanisms of cell fate choices during de- velopment, regeneration, homeostasis, and disease is a central goal of mod- ern biology. Ongoing rapid advances in single-cell biology are enabling the exploration of cell fate specification at unprecedented resolution. Here, we review single-cell RNA sequencing and sequencing of other modalities as methods to elucidate the molecular underpinnings of lineage specification. We specifically discuss how the computational tools available to reconstruct lineage trajectories, quantify cell fate bias, and perform dimensionality re- duction for data visualization are providing new mechanistic insights into the process of cell fate decision. Studying cellular differentiation using single- cell genomic tools is paving the way for a detailed understanding of cellular behavior in health and disease.


Conflict of interest statement

Disclosure Statement

The authors are not aware of any affiliations, memberships, funding, or financial holdings that might be perceived as affecting the objectivity of this review.

Figures

Figure 1
Figure 1. Understanding cell fate choices using scRNA-seq.
(a) The prevalent models of cellular differentiation. Traditionally, cellular differentiation is considered as a discrete hierarchical process where progenitors become lineage restricted in a series of stepwise bifurcation events. Advances in single-cell technologies are challenging this classical view, suggesting that differentiation is rather a continuous process where progenitors progressively become fate restricted. These continuous processes can be strictly hierarchical or nonhierarchical (i.e., the progenitor compartment is heterogeneous and consists of lineage-primed subpopulations giving rise to differentiated cell types), or a combination of both. (b) To elucidate the mechanisms of cell fate decisions, one can reconstruct differentiation trajectories from snapshot single-cell transcriptome data to characterize the differentiation of progenitors (gray) into terminal cell states (branches X, Y, and Z). (c) Mechanistic insights can be gained by performing pseudotemporal ordering and identifying the accompanying gene expression changes. Gene regulatory networks (GRNs) can also be reconstructed from these data to characterize the interactions among the different regulators. (d) Single-cell transcriptomic and epigenomic studies support a probabilistic view of differentiation. Consequently, cell fate commitment can be modeled as a probabilistic process where fate probabilities of progenitor cells differentiating into different terminal states can be predicted, providing insights into lineage commitment.
Figure 2
Figure 2. Dimensionality reduction to visualize and interpret scRNA-seq data.
(a) Since scRNA-seq profiles thousands of genes in single cells, the data are high dimensional and dimensionality reduction is necessary for visualization and meaningful interpretation. Dimensionality reduction methods can be broadly divided into two major categories: matrix factorization and neighbor graphs. A commonly used matrix factorization method for dimensionality reduction of scRNA-seq data is principal component analysis (PCA), a linear transformation identifying the major axes of variability. In contrast, a neighbor graph–based approach is more suitable for preserving the local structure of the data. Such methods include t-distributed stochastic neighbor embedding (t-SNE), unique manifold approximation (UMAP), and force-directed layout. t-SNE transforms local Gaussian distributions measuring the density of data points in high-dimensional space into local Student’s t-distributions. The optimization of the low-dimensional space is performed by minimizing the Kullback–Leibler divergence between these distributions. UMAP constructs a topological representation of the high-dimensional space by patching together local topological elements called simplices into simplicial complexes. A similar process is used to construct an equivalent low-dimensional topological representation of the data. The cross-entropy between the two representations is minimized to optimize the layout in low-dimensional space. Force-directed layouts visualize k-nearest neighbor graphs by assigning attractive forces (depicted as springs) to the edges and repulsive forces (e.g., positive charges) to the nodes. The net forces are minimized until equilibrium is achieved. (b) Application of different dimensionality reduction techniques on the scRNA-seq data of hematopoietic progenitors from Reference . Dimensionality reduction using PCA only resolves neutrophil and erythroblast differentiation trajectories. t-SNE, UMAP, and force-directed Fruchterman–Reingold layout representations allow the visualization of all cell types including the underrepresented cell populations such as megakaryocytes, basophils, dendritic cells, and B cells. However, UMAP provides a smoother manifold and better resolves the global and continuous structure of the differentiation manifold in low-dimensional space.
Figure 3
Figure 3. Multimodal single-cell analysis to comprehensively understand the mechanisms of cell fate decisions.
(a) Lineage tree inferences from scRNA-seq data are based on the assumption that cells with similar transcriptomes are developmentally closer to each other, but the real progenitor–progeny relationship between the cells cannot be known. Advances in single-cell lineage tracing allow for sequencing of the genetic labels and profiling of the whole transcriptome simultaneously, making it feasible to reconstruct refined cell lineage trees with the information of genome-wide transcriptomes. (b) The currently available methods to study cell fate choices and lineage commitment can be broadly divided into three different categories: single-cell genetic lineage tracing to reconstruct lineage trees, methods to profile mRNA in situ to characterize cell types in their original spatial location and their microenvironment, and methods profiling different molecular features of a cell (e.g., mRNA, histone modifications, DNA methylation, chromatin accessibilities and architecture, cell surface proteins). Future advances will enable simultaneous application of these methods or their computational integration for an unprecedented resolution of cellular differentiation.

References

    1. Kopp JL, Grompe M, Sander M. Stem cells versus plasticity in liver and pancreas regeneration. Nat Cell Biol. 2016;18:238–45. - PubMed
    1. Brockes JP, Kumar A. Appendage regeneration in adult vertebrates and implications for regenerative medicine. Science. 2005;310:1919–23. - PubMed
    1. Raj A, van Oudenaarden A. Nature, nurture, or chance: stochastic gene expression and its consequences. Cell. 2008;135:216–26. - PMC - PubMed
    1. Hashimshony T, Senderovich N, Avital G, Klochendler A, de Leeuw Y, et al. CEL-Seq2: sensitive highly-multiplexed single-cell RNA-Seq. Genome Biol. 2016;17:77. - PMC - PubMed
    1. Picelli S, Bjorklund AK, Faridani OR, Sagasser S, Winberg G, Sandberg R. Smart-seq2 for sensitive full-length transcriptome profiling in single cells. Nat Methods. 2013;10:1096–98. - PubMed

LinkOut - more resources