Clinical Trial
. 2020 Nov 2;130(11):6021-6033.
doi: 10.1172/JCI138473.

Sleeping Beauty-engineered CAR T cells achieve antileukemic activity without severe toxicities

Affiliations
Clinical Trial

Sleeping Beauty-engineered CAR T cells achieve antileukemic activity without severe toxicities

Chiara F Magnani et al. J Clin Invest. .

Abstract

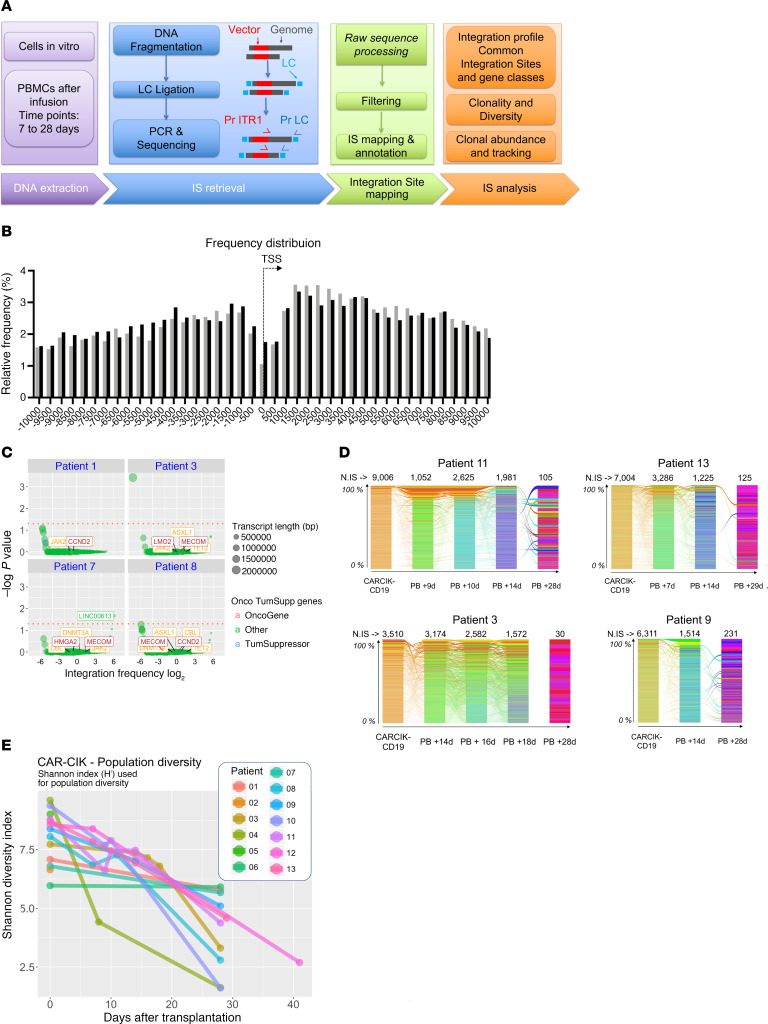
BACKGROUNDChimeric antigen receptor (CAR) T cell immunotherapy has resulted in complete remission (CR) and durable response in highly refractory patients. However, logistical complexity and high costs of manufacturing autologous viral products limit CAR T cell availability.METHODSWe report the early results of a phase I/II trial in B cell acute lymphoblastic leukemia (B-ALL) patients relapsed after allogeneic hematopoietic stem cell transplantation (HSCT) using donor-derived CD19 CAR T cells generated with the Sleeping Beauty (SB) transposon and differentiated into cytokine-induced killer (CIK) cells.RESULTSThe cellular product was produced successfully for all patients from the donor peripheral blood (PB) and consisted mostly of CD3+ lymphocytes with 43% CAR expression. Four pediatric and 9 adult patients were infused with a single dose of CAR T cells. Toxicities reported were 2 grade I and 1 grade II cytokine-release syndrome (CRS) cases at the highest dose in the absence of graft-versus-host disease (GVHD), neurotoxicity, or dose-limiting toxicities. Six out of 7 patients receiving the highest doses achieved CR and CR with incomplete blood count recovery (CRi) at day 28. Five out of 6 patients in CR were also minimal residual disease negative (MRD-). Robust expansion was achieved in the majority of the patients. CAR T cells were measurable by transgene copy PCR up to 10 months. Integration site analysis showed a positive safety profile and highly polyclonal repertoire in vitro and at early time points after infusion.CONCLUSIONSB-engineered CAR T cells expand and persist in pediatric and adult B-ALL patients relapsed after HSCT. Antileukemic activity was achieved without severe toxicities.TRIAL REGISTRATIONClinicalTrials.gov NCT03389035.FUNDINGThis study was supported by grants from the Fondazione AIRC per la Ricerca sul Cancro (AIRC); Cancer Research UK (CRUK); the Fundación Científica de la Asociación Española Contra el Cáncer (FC AECC); Ministero Della Salute; Fondazione Regionale per la Ricerca Biomedica (FRRB).

Keywords: Cancer gene therapy; Clinical Trials; Hematology; Immunotherapy; Leukemias.


Conflict of interest statement

Conflict of interest: The Tettamanti Foundation has filed a patent application for the technology used in this report (European patent application 15801344.1; PCT/EPO2015/075980), and CFM, ST, EB, and A Biondi are inventors. The technology was licensed to Formula Pharmaceuticals for further development. Formula Pharmaceuticals provided a research grant to support the current academic study.

Figures

Figure 1
Figure 1. Cell expansion and composition of manufactured medicinal products.
(A) Expansion kinetics of 19 different batches are represented as total number of nucleated cells (TNC) over time. Each line represents a single batch. (B) Viability of TNC over time (n = 19). Arrow indicates time point at which electroporation was performed. (C) Flow cytometric immunophenotyping by dual-density plots in 1 representative batch (n = 9). CD3+ cells were selected by CD3/side scatter (SSC) gating (left). CD3+CAR+ cells were gated, and CD4/CD8, CD45RO/CD62L, and CD3/CD56 expression were measured. (D) Expression of CD3+, CAR+, CD56+, CD4+, and CD8+ cells as percentages of TNCs. Each symbol represents a single batch. (E) Expression of CD56+, CD4+, and CD8+ cells as percentages of CD3+CAR+ T cells. Each symbol represents a single batch. (F) Expression of naive, central memory (CM), effector memory (EM), and terminal effector (EMRA) cells as percentages of CD3+CAR+ T cells. Means are shown as horizontal lines.
Figure 2
Figure 2. Study flow.
Study participant flow chart from the time of screening to treatment.
Figure 3
Figure 3. Postinfusion expansion and persistence of CAR T cells in PB according to dose level.
Transgene copy number per μg in blood (A), percentage of CAR+ T cells within the total CD3+ T cells in blood (B), absolute counts of CAR+CD3+ cells in blood (C) measured at different intervals of time after CARCIK-CD19 infusion in patients treated at different dose levels. Each symbol and color codifes an individual patient sample (n = 13). Measures under LOQ (<50 copies/μg) were inserted in the graphs with a fixed reference value. (D) Flow cytometric dual-density plots showing leukemic blast clearance assessed as MRD detection and CAR T cell engraftment in BM (upper panels) and PB (bottom panels) at different time points in patient 13. Numbers within the diagrams represent the percentages of cells. (E) AUC-28d according to dose level. (F) Tmax-28d according to dose level. (G) Cmax-28d according to dose level. Each symbol represents a single patient (n = 13). AUC (transgene copies/μg DNA).
Figure 4
Figure 4. Postinfusion immunophenotype and kinetic of CAR T cells.
(A) Percentages of CD3+CD8+, CD3+CD4+, and CD3+CD56+ cell subsets within the CAR+CD3+ T cells in PB at different intervals of time after CARCIK-CD19 infusion (n = 11). (B) Expression of naive, central memory, effector memory, and terminal effector cells as percentages of CAR+CD3+ T cells in PB at different intervals of time after CARCIK-CD19 infusion (n = 11). (C) Flow cytometric dot plots showing the phenotype of circulating CAR T cells in a representative B-ALL patient at 21 days after CARCIK-CD19 infusion (n = 13).
Figure 5
Figure 5. Clinical outcome and antileukemic response duration.
(A) Waterfall plot of individual patient BCA duration. (B) Waterfall plot of individual patient remission duration (n = 13), remission duration in presence of transgene copy number, and timing of relapse, allo-HSCT, and eventually death. (C) CT scan at baseline and 44 days after CARCIK-CD19 infusion in patient 12 with a diffuse B-ALL presenting with massive liver infiltration. VCN, vector copy number; PD, progressive disease.
Figure 6
Figure 6. Transposon IS analyses in patient PB and cellular products.
(A) Experimental and analytical workflow adopted for IS retrieval and analysis in vitro and in vivo samples. (B) Frequency distribution of SB IS around genes’ TSS (interval ± 10 Kb divided in 500 bp bins) in vitro (black bars) and in vivo (gray bars), expressed as percentages relative to the total IS for each data set (n = 40 samples). (C) CIS analysis was performed on the IS identified for each patient using the Grubbs test for outliers and volcano plot representation. All genes targeted by IS were tested and plotted with dots of size proportional to the gene length; gene integration frequency normalized by gene length was placed on the x axis, while the y axis shows the P value of the CIS Grubbs test for outliers (–log base 10 of P value). Tumor suppressor genes are annotated in blue, protooncogene in red, and a generic “other” in green for the remaining genes. Dots with significant P values (α threshold of 0.05) are above the dashed horizontal line and labeled with the closest gene name (RefSeq). Gene ID labels of genes in involved in clonal expansion of genetically modified cells were annotated using red labels, tumor suppressor genes using orange labels, and genes with other functions in blue. (D) For each patient, the clonal abundance of IS represented by at least 2 sequencing reads are represented with a stacked bar plot in which each clone is represented by a different color and the height is proportional to the relative percentage of genomes of the specific IS over the total genomes; each bar represents a specific time point after infusion; ribbons connect tracked clones between 2 consecutive time points. Four out of 11 patients are represented. (E) Shannon diversity (H) index was calculated for the IS data sets obtained from each patient over time (n = 13).

References

    1. Majzner RG, Mackall CL. Clinical lessons learned from the first leg of the CAR T cell journey. Nat Med. 2019;25(9):1341–1355. doi: 10.1038/s41591-019-0564-6. - DOI - PubMed
    1. Borowitz MJ, et al. Prognostic significance of minimal residual disease in high risk B-ALL: a report from Children’s Oncology Group study AALL0232. Blood. 2015;126(8):964–971. doi: 10.1182/blood-2015-03-633685. - DOI - PMC - PubMed
    1. Bassan R, et al. Improved risk classification for risk-specific therapy based on the molecular study of minimal residual disease (MRD) in adult acute lymphoblastic leukemia (ALL) Blood. 2009;113(18):4153–4162. doi: 10.1182/blood-2008-11-185132. - DOI - PubMed
    1. Gökbuget N, et al. Outcome of relapsed adult lymphoblastic leukemia depends on response to salvage chemotherapy, prognostic factors, and performance of stem cell transplantation. Blood. 2012;120(10):2032–2041. doi: 10.1182/blood-2011-12-399287. - DOI - PubMed
    1. Maude SL, et al. Tisagenlecleucel in children and young adults with B-cell lymphoblastic leukemia. N Engl J Med. 2018;378(5):439–448. doi: 10.1056/NEJMoa1709866. - DOI - PMC - PubMed

Publication types

Associated data