

Development and validation of a model for individualized prediction of hospitalization risk in 4,536 patients with COVID-19
- PMID: 32780765
- PMCID: PMC7418996
- DOI: 10.1371/journal.pone.0237419
Development and validation of a model for individualized prediction of hospitalization risk in 4,536 patients with COVID-19
Abstract
Background: Coronavirus Disease 2019 is a pandemic that is straining healthcare resources, mainly hospital beds. Multiple risk factors of disease progression requiring hospitalization have been identified, but medical decision-making remains complex.
Objective: To characterize a large cohort of patients hospitalized with COVID-19, their outcomes, develop and validate a statistical model that allows individualized prediction of future hospitalization risk for a patient newly diagnosed with COVID-19.
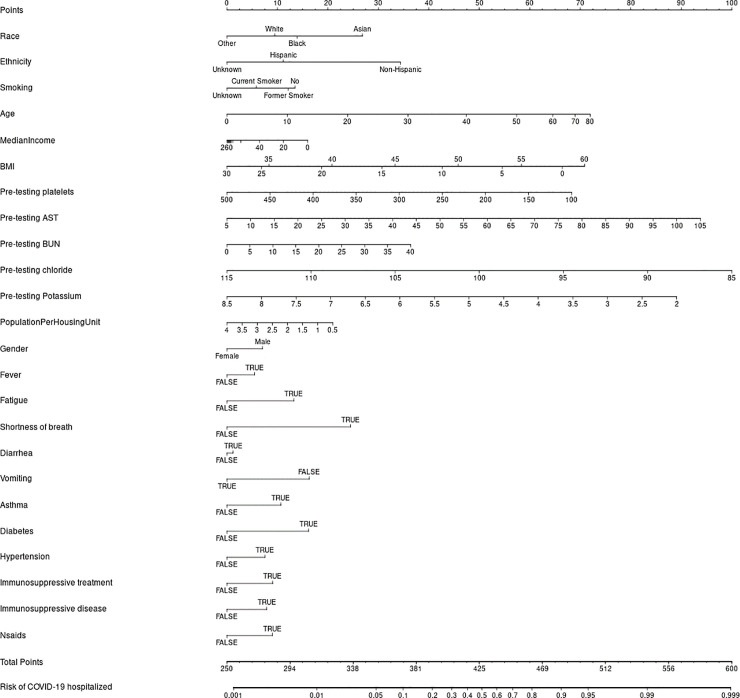
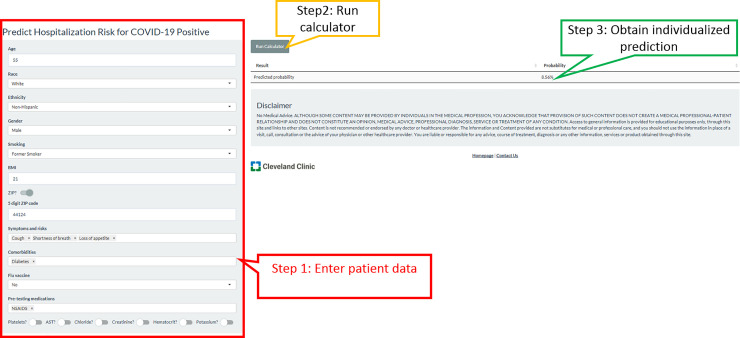
Design: Retrospective cohort study of patients with COVID-19 applying a least absolute shrinkage and selection operator (LASSO) logistic regression algorithm to retain the most predictive features for hospitalization risk, followed by validation in a temporally distinct patient cohort. The final model was displayed as a nomogram and programmed into an online risk calculator.
Setting: One healthcare system in Ohio and Florida.
Participants: All patients infected with SARS-CoV-2 between March 8, 2020 and June 5, 2020. Those tested before May 1 were included in the development cohort, while those tested May 1 and later comprised the validation cohort.
Measurements: Demographic, clinical, social influencers of health, exposure risk, medical co-morbidities, vaccination history, presenting symptoms, medications, and laboratory values were collected on all patients, and considered in our model development.
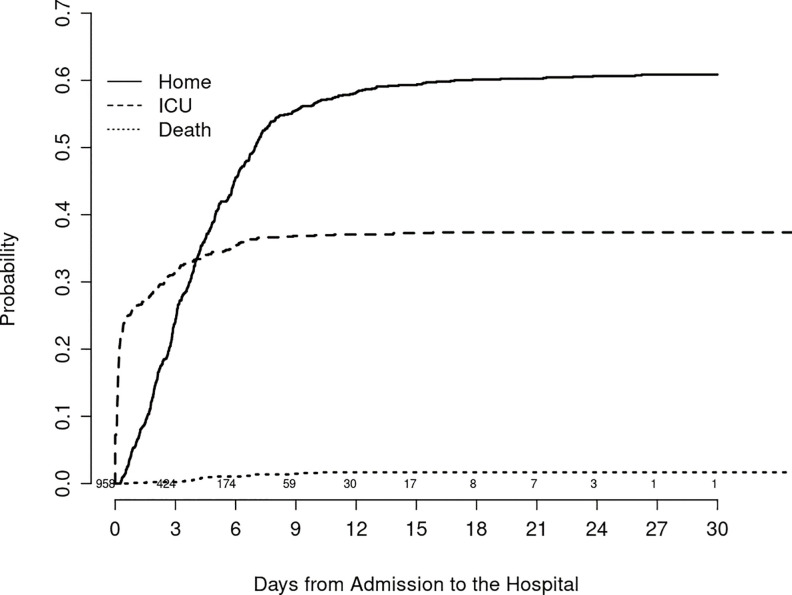
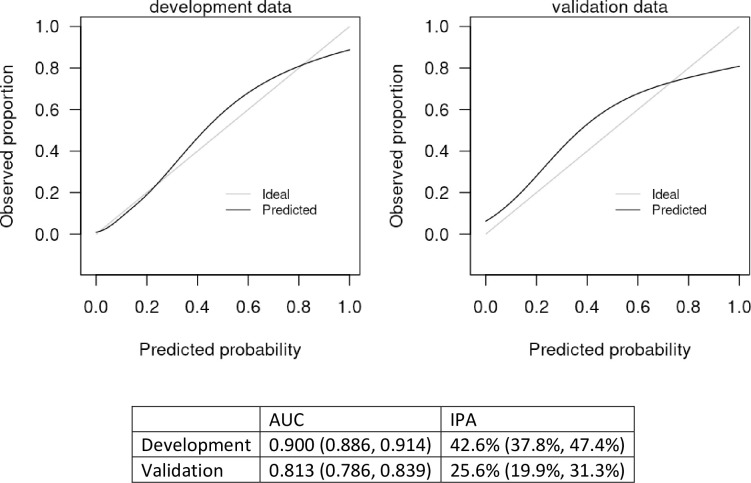
Results: 4,536 patients tested positive for SARS-CoV-2 during the study period. Of those, 958 (21.1%) required hospitalization. By day 3 of hospitalization, 24% of patients were transferred to the intensive care unit, and around half of the remaining patients were discharged home. Ten patients died. Hospitalization risk was increased with older age, black race, male sex, former smoking history, diabetes, hypertension, chronic lung disease, poor socioeconomic status, shortness of breath, diarrhea, and certain medications (NSAIDs, immunosuppressive treatment). Hospitalization risk was reduced with prior flu vaccination. Model discrimination was excellent with an area under the curve of 0.900 (95% confidence interval of 0.886-0.914) in the development cohort, and 0.813 (0.786, 0.839) in the validation cohort. The scaled Brier score was 42.6% (95% CI 37.8%, 47.4%) in the development cohort and 25.6% (19.9%, 31.3%) in the validation cohort. Calibration was very good. The online risk calculator is freely available and found at https://riskcalc.org/COVID19Hospitalization/.
Limitation: Retrospective cohort design.
Conclusion: Our study crystallizes published risk factors of COVID-19 progression, but also provides new data on the role of social influencers of health, race, and influenza vaccination. In a context of a pandemic and limited healthcare resources, individualized outcome prediction through this nomogram or online risk calculator can facilitate complex medical decision-making.
Conflict of interest statement
The authors have declared that no competing interests exist.
Figures
References
-
- Tsai T, Jacobson B, Jha A. American Hospital Capacity And Projected Need for COVID-19 Patient Care. Health Affairs. https://www.healthaffairs.org/do/10.1377/hblog20200317.457910/full/ accessed April 10, 2020. - DOI
-
- Wu Z, McGoogan JM. Characteristics of and Important Lessons From the Coronavirus Disease 2019 (COVID-19) Outbreak in China: Summary of a Report of 72314 Cases From the Chinese Center for Disease Control and Prevention. JAMA. 2020. - PubMed
Publication types
MeSH terms
Grants and funding
LinkOut - more resources
Full Text Sources
Miscellaneous
