. 2020 Nov 2;217(11):e20191820.
doi: 10.1084/jem.20191820.

Monocyte-derived macrophages promote breast cancer bone metastasis outgrowth

Affiliations

Monocyte-derived macrophages promote breast cancer bone metastasis outgrowth

Ruo-Yu Ma et al. J Exp Med. .

Abstract

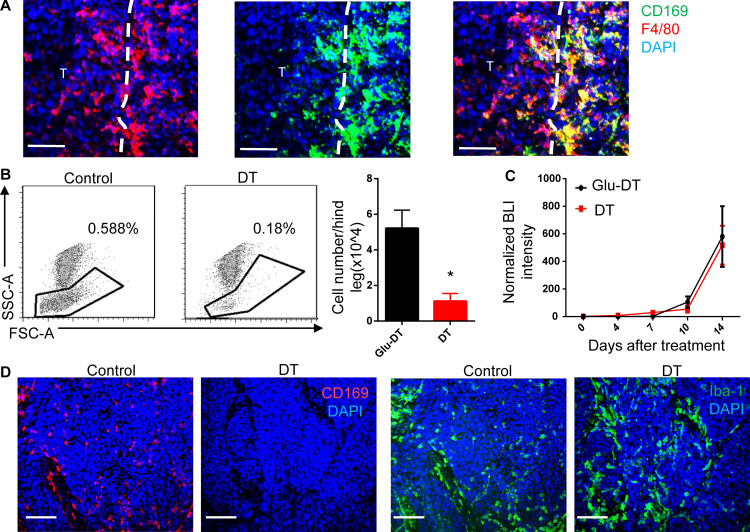
Bone metastasis is the major cause of death in breast cancer. The lack of effective treatment suggests that disease mechanisms are still largely unknown. As a key component of the tumor microenvironment, macrophages promote tumor progression and metastasis. In this study, we found that macrophages are abundant in human and mouse breast cancer bone metastases. Macrophage ablation significantly inhibited bone metastasis growth. Lineage tracking experiments indicated that these macrophages largely derive from Ly6C+CCR2+ inflammatory monocytes. Ablation of the chemokine receptor, CCR2, significantly inhibited bone metastasis outgrowth and prolonged survival. Immunophenotyping identified that bone metastasis-associated macrophages express high levels of CD204 and IL4R. Furthermore, monocyte/macrophage-restricted IL4R ablation significantly inhibited bone metastasis growth, and IL4R null mutant monocytes failed to promote bone metastasis outgrowth. Together, this study identified a subset of monocyte-derived macrophages that promote breast cancer bone metastasis in an IL4R-dependent manner. This suggests that IL4R and macrophage inhibition can have potential therapeutic benefit against breast cancer bone disease.


Conflict of interest statement

Disclosures: J.W. Pollard is the co-founder of Macomics, a start-up immunooncology company. The company is not yet trading, and there are no conflicts between this company and the data in the current paper. No other disclosures were reported.

Figures

None
Graphical abstract
Figure 1.
Figure 1.
MAMs depletion inhibits bone metastasis outgrowth. (A) Representative immunofluorescent staining of CD68+ macrophages (red) infiltrated in PanCK+ tumor area (green) of human breast cancer bone metastasis sample. Nuclei were stained with Qred. Scale bar = 20 µm. n = 9 from two independent experiments. (B) Representative immunofluorescent staining of Iba1+ macrophages (red) in bone metastasis of 1833 human breast cancer cells (left) and MetBo2 murine breast cancer cells (right). Bar = 20 µm. Nuclei were stained with DAPI (blue). Experiments performed two times independently. (C) Diagram of macrophage depletion in established bone metastasis detected by bioluminescent (BLI) imaging with the L-clodronate treatment indicated until the humane end point. (D) Representative images and quantification of bioluminescent signal of MetBo2 bone metastasis treated with L-Clod or corresponding vehicle (L-PBS). Signals were quantified by PhotonIMAGER and normalized to day 0. Bar represents SEM; n = 6–8 mice for each group. **, P < 0.01 with Student’s t test. Experiments performed three times independently. (E) Representative figures and quantification of bioluminescent signal of MetBo2 bone metastasis treated with BLZ945 (BLZ) or corresponding vehicle (Veh). Signals were quantified by PhotonIMAGER and normalized to day 0. Bar represents SEM; n = 6–8 mice for each group. ***, P < 0.001 with Student’s t test. Experiments performed three times independently. (F) Representative figures and quantification of bioluminescent signal of 1833 bone metastasis treated with BLZ945 (BLZ) or corresponding vehicle (Veh). Signals were quantified by PhotonIMAGER and normalized to day 0. Bar represents SEM; n = 6–8 mice for each group. ***, P < 0.001 with Student’s t test. Experiments performed two times independently.
Figure S1.
Figure S1.
Macrophage ablation does not affect other immune cells in bone or abdominal metastasis. (A) FACS quantification of bone marrow immune cell populations from MetBo2 bone metastases treated with L-Clod, or control liposome (L-PBS). Bar represents SEM; n = 3 mice for each group. *, P < 0.05 with Student’s t test. Experiments performed two times independently. NK, natural killer. (B) FACS quantification of bone marrow immune cell populations from MetBo2 bone metastases treated with CSF1R inhibitor, BLZ, and vehicle treatment. Bar represents SEM; n = 3 mice for each group. *, P < 0.05 with Student’s t test. Experiments performed two times independently. (C) Quantification of bioluminescent signal of the abdominal lesion of MetBo2 cells in rare cases treated with L-Clod or corresponding vehicle (L-PBS). Signals were quantified by PhotonIMAGER and normalized to day 0. Bars represent SEM. N equals the number of mice included in quantification. Experiments performed three times independently. (D) Representative figures and quantification of bioluminescent signal of the abdominal lesion of MetBo2 cells in rare cases treated with BLZ945 (BLZ) or corresponding vehicle (Veh). Signals were quantified by PhotonIMAGER and normalized to day 0. Bars represent SEM. N equals the number of mice included in quantification. In mice with chest metastasis, only one mouse in vehicle group survived after 10 d. Experiments performed three times independently.
Figure S2.
Figure S2.
Macrophages promote bone metastasis. (A) Representative TRAP staining and quantification of MetBo2 bone metastasis. Sample treated with free clodronate (F-clod), L-Clod, or corresponding vehicles (Veh) until end point. Experiments performed two times independently. Bar = 20 µm. Red arrows indicate osteoclasts. (B) Quantification of osteoclasts in bone metastasis. ***, P < 0.001; ns, not significant. n = 5 for each group. (C) Quantification of macrophages in MetBo2 bone metastasis. Sample treated with free clodronate, L-Clod, or corresponding vehicles until the clinical end point. n = 3 for each group. *, P < 0.05; **, P < 0.01. Experiments performed two times independently. (D) Representative figures and quantification of bioluminescent signal of bone metastasis treated with free clodronate (F-clod), L-Clod, or corresponding vehicle (Veh) in MetBo2 murine breast cancer model. Signals were quantified by PhotonIMAGER and normalized to day 0. ***, P < 0.001. n = 6–8 mice for each group. Experiments performed two times independently.
Figure S3.
Figure S3.
CD169+ macrophages are dispensable for metastasis outgrowth. (A) Representative immunofluorescent staining showing that most of the CD169+ macrophages do not infiltrate into bone metastasis. Bar = 50 µm. T, tumor area; green, CD169; red, F4/80; blue, DAPI. Experiments performed three times independently. (B) Representative FACS plot and quantification showing ablation of bone marrow macrophage (CD11b+F4/80+SSClow, % of all immune cells) in mice treated with DT or control Glu-DT. Bars represent SEM; n = 3 mice for each group. *, P < 0.05 with Student’s t test. (C) Quantification of bioluminescent (BLI) signal of MetBo2 bone metastasis in CD169-DTR mice treated with DT or Glu-DT. Signals were quantified by PhotonIMAGER and normalized to day 0. Bar represents SEM; n = 4–8 tumors for each group. (D) Representative immunofluorescent staining of MetBo2 bone metastasis in CD169-DTR mice showing depletion of CD169+ macrophages but not the majority of Iba1+ macrophages in DT-treated mice compared with control Glu-DT treatment. Bar = 50 µm. Red, CD169; blue, DAPI. In B–D, experiments were performed two times independently.
Figure 2.
Figure 2.
CCL2-recruited IMs promote bone metastasis growth. (A) Diagram of adoptive transfer of monocytes in healthy mice and mice with bone metastasis. (B) Relative number of recruited IMs and PMs in bone of recipient mice bearing bone metastasis or healthy controls. n = 6; *, P < 0.05 with Student’s t test. Experiments performed two times independently. (C) Survival curve (defined as time taken to reach the humane end point) of mice with MetBo2 bone metastasis. WT, n = 4; knockout, n = 9; P = 0.0133. (D) Representative images and quantification of bioluminescent (BLI) signal for MetBo2 bone metastasis in Ccr2−/− mice and WT mice. Signals were quantified by PhotonIMAGER and normalized to day 0. Ccr2−/− group, n = 8 mice; WT group, n = 7 mice. Bar represents SEM. **, P < 0.01 with Student’s t test. Experiments performed four times independently. (E) Survival curve of mice with bone metastasis. Death is defined as time the mice take to reach the humane end point. P = 0.0332. (F) Representative images and quantification of bioluminescent signal for 1833 human bone metastasis model in Ccr2−/− mice and WT mice. Signals were measured by IVIS and normalized to day 0. Ccr2−/− group, n = 8 mice; control group, n = 7 mice. Bar represents SEM. ***, P < 0.001 with Student’s t test. (G) Quantification of bioluminescent signal for 1833 human bone metastasis model treated with anti-CCL2 inhibitory antibody (Ab) or corresponding isotype control (IgG). Signals were measured by IVIS and normalized to day 0. CCL2 antibody–treated group, n = 8 mice; control group, n = 7 mice. Bar represents SEM. ***, P < 0.001 with Student’s t test. (H) Diagram and quantification of bioluminescent signal of monoycte add-back. Recipient mice are Ccr2-deficient mice with 1833 bone metastasis. Monocytes from WT mice and Ccr2-deficient mice were injected i.v. after tumor signal was detected. Bioluminescent signals on the legs were quantified by PhotonIMAGER and normalized to day 0. Each group contain data from four legs. Bar represents SEM. ***, P < 0.001 with Student’s t test. n = 4–5. Experiments performed three times independently.
Figure S4.
Figure S4.
Ccr2/ mice are deficient in circulating but not bone marrow monocytes. (A) Absolute number of IMs and PMs in blood of CCR2 knockout mice and WT mice. Bar represents SEM. n = 3 mice for each group. *, P < 0.05 with Student’s t test. (B) Absolute number of IMs and PMs per leg in bone marrow of CCR2 knockout mice and WT mice. Bar represents SEM. n = 3 mice for each group. *, P < 0.05 with Student’s t test. In A and B, experiments were performed three times independently.
Figure 3.
Figure 3.
BoMAMs bear distinct cell surface markers. (A) Pie chart of the total number of differentially expressed genes that are up-regulated or down-regulated in macrophages associated with bone metastasis compared with macrophages from normal bone. Differentially expressed genes are defined as fold-change >1.5, P < 0.05. (B) Heatmap showing the expression of major macrophage polarization markers. Bar denotes the relative expression level of each gene in each sample. (C) Heatmap showing the expression of genes of major tumor-promoting functions. Bar denotes the relative expression level of each gene in each sample. CSC, cancer stem cell; TAM, tumor-associated macrophage. (D) Representative histogram of different macrophage markers determined by flow cytometry in bone marrow macrophages from healthy mice (blue), bone metastasis (red), and adjacent normal (peritumor; green). Gray represents isotype control. Experiments performed three times independently. (E) Representative flow dot plot of CD204 and IL-4R (CD124) expression in macrophages from healthy bone marrow and BoMaMs. Experiments performed three times independently. (F) Representative immunofluorescent staining of CD204 and F4/80 in MetBo2 bone metastasis and adjacent normal bone marrow. Bar = 50 µm. T, tumor area. Experiments performed three times independently. (G) Representative immunofluorescent staining of CD204+ macrophage populations coexpressing Iba-1 and IL-4R in bone metastasis. Bar = 20 µm. Arrows point to the coexpression of markers (yellow) on macrophages. Experiments performed three times independently.
Figure 4.
Figure 4.
BoMAMs in human samples. (A) Multiplex immunofluorescent staining of CD204 and IL4R macrophages in patient breast cancer bone metastasis (bar = 20 µm) and quantification (n = 9 samples; error bar represents SEM). (B) IL4 target score correlation with CD204 expression in patient bone metastasis transcriptome datasets. Each point represents a patient sample in the dataset.
Figure 5.
Figure 5.
Monocyte-derived macrophage promotion of bone metastasis is IL4R dependent. (A) CD204 expression of CCR2+ and CCR2 monocytes from healthy control and bone metastasis. Gray, isotype control; red, CCR2+ monocytes; blue, CCR2 monocytes. n = 3. Experiments performed two times independently. (B) Volcano plot showing that Il4ra is highly up-regulated in monocytes from MetBo2 bone metastases compared with monocytes sorted from healthy mice. Volcano plot showing −log10(P value) versus log2(fold-change). Red colored points represent up-regulated gene with P < 0.05 and fold-change >1.5; green colored points represent down-regulated gene with P < 0.05 and fold-change >1.5. (C) Diagram of GFP+ monocyte adoptive transfer into bone metastasis (mets) bearing syngeneic host (left) and representative FACS histogram (right) showing CD204 and IL4R expression comparing monocyte-derived macrophages (GFP+) and endogenous macrophages (GFP). Gray, isotype control; red, GFP+ macrophages; blue, GFP macrophages. n = 3. Experiments performed two times independently. (D) Diagram of bone colonization assay in mosaic mice bearing Il4r+/− and Il4r−/− bone marrow (left). Representative images and quantification of bioluminescent (BLI) signal of 1833 bone metastasis in bone marrow (BM) mosaic mice generated as described in the diagram (right). Signals were measured by IVIS and normalized to day 0. n = 10 for each group. Bar represents SEM. ***, P < 0.001 with Student’s t test. Experiments performed two times independently. (E) Representative images and quantification of bioluminescent signal of 1833 bone metastasis in mice adoptively transferred with WT or Il4r−/− monocytes. Signals were quantified by PhotonIMAGER and normalized to day 0. n = 3–5. Bar represents SEM. Each group contain data from four legs. Bar represents SEM. ***, P < 0.001 with Student’s t test. Experiments performed three times independently.
Figure S5.
Figure S5.
Il4ra−/− affect BoMAM but not osteoclast. (A) Representative TRAP staining (pink stain, red arrowheads) and quantification of 1833 bone metastasis from mosaic mice bearing Il4r+/− and Il4r−/− bone marrow. Bar = 20 µm; error bars represent SEM. n = 3 mice for each group. ns, not significant. (B) Representative FACS plot and quantification showing the change of monocytes, macrophages, and CD204+ BoMAMs in mosaic mice bearing Il4r+/− and Il4r−/− bone marrow. Bar represents SEM. n = 3 mice for each group. *, P < 0.05 with Student’s t test. Experiments performed two times independently. (C) Representative image of relative expression of IL-4 in different cell types in MetBo2 bone metastasis. Immune cell populations and tumor cells from bone metastasis sample were sorted based on the lineage markers, and RNA was extracted for quantitative PCR. Each sample includes two mice, and the experiment was repeated two times. NK, natural killer.

References

    1. Afik R., Zigmond E., Vugman M., Klepfish M., Shimshoni E., Pasmanik-Chor M., Shenoy A., Bassat E., Halpern Z., Geiger T., et al. . 2016. Tumor macrophages are pivotal constructors of tumor collagenous matrix. J. Exp. Med. 213:2315–2331. 10.1084/jem.20151193 - DOI - PMC - PubMed
    1. Andreu P., Johansson M., Affara N.I., Pucci F., Tan T., Junankar S., Korets L., Lam J., Tawfik D., DeNardo D.G., et al. . 2010. FcRgamma activation regulates inflammation-associated squamous carcinogenesis. Cancer Cell. 17:121–134. 10.1016/j.ccr.2009.12.019 - DOI - PMC - PubMed
    1. Auffray C., Sieweke M.H., and Geissmann F.. 2009. Blood monocytes: development, heterogeneity, and relationship with dendritic cells. Annu. Rev. Immunol. 27:669–692. 10.1146/annurev.immunol.021908.132557 - DOI - PubMed
    1. Barbie D.A., Tamayo P., Boehm J.S., Kim S.Y., Moody S.E., Dunn I.F., Schinzel A.C., Sandy P., Meylan E., Scholl C., et al. . 2009. Systematic RNA interference reveals that oncogenic KRAS-driven cancers require TBK1. Nature. 462:108–112. 10.1038/nature08460 - DOI - PMC - PubMed
    1. Batoon L., Millard S.M., Wullschleger M.E., Preda C., Wu A.C., Kaur S., Tseng H.W., Hume D.A., Levesque J.P., Raggatt L.J., et al. . 2019. CD169+ macrophages are critical for osteoblast maintenance and promote intramembranous and endochondral ossification during bone repair. Biomaterials. 196:51–66. 10.1016/j.biomaterials.2017.10.033 - DOI - PubMed

Publication types

MeSH terms