. 2020 Oct 26;55(2):163-177.e6.
doi: 10.1016/j.devcel.2020.07.014. Epub 2020 Aug 10.

Small Extracellular Vesicle Regulation of Mitochondrial Dynamics Reprograms a Hypoxic Tumor Microenvironment

Affiliations

Small Extracellular Vesicle Regulation of Mitochondrial Dynamics Reprograms a Hypoxic Tumor Microenvironment

Irene Bertolini et al. Dev Cell. .

Abstract

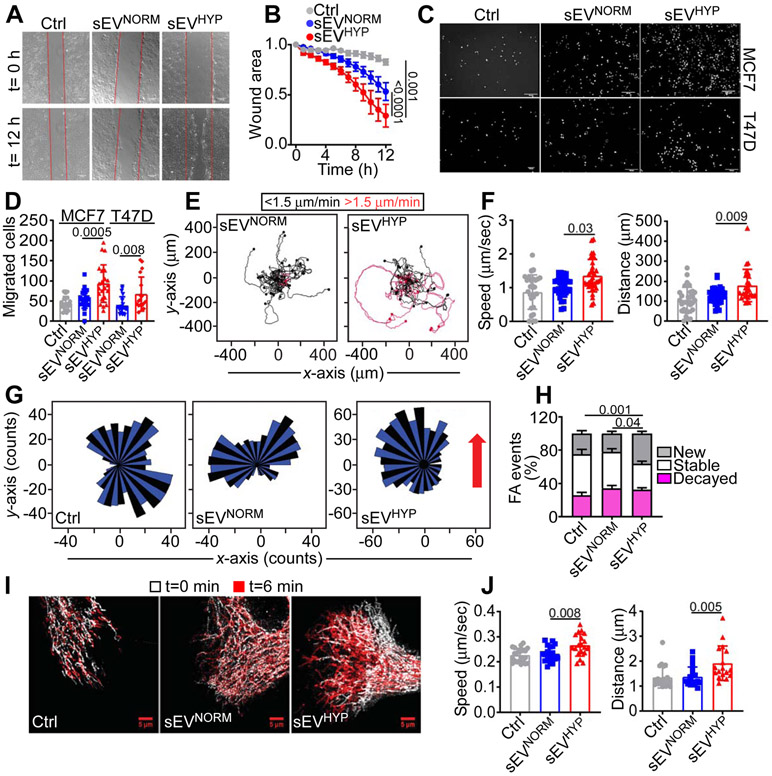
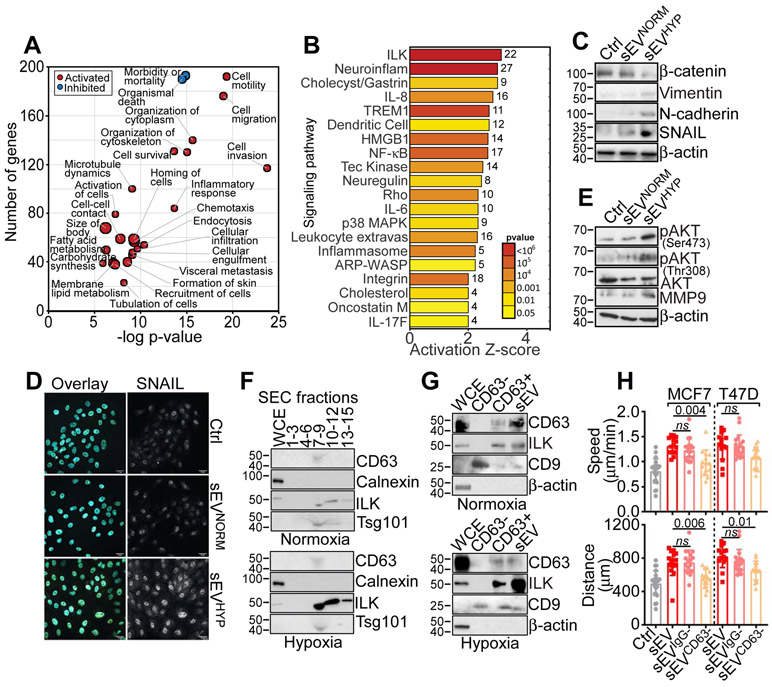
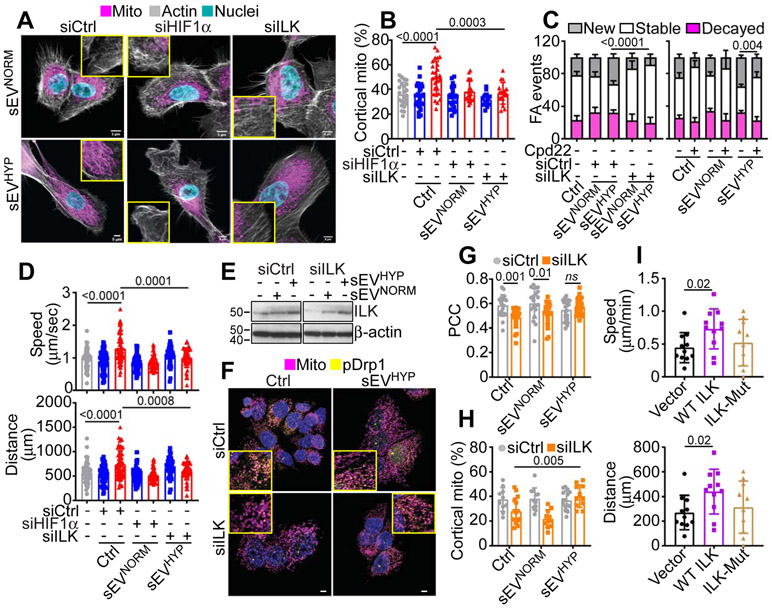
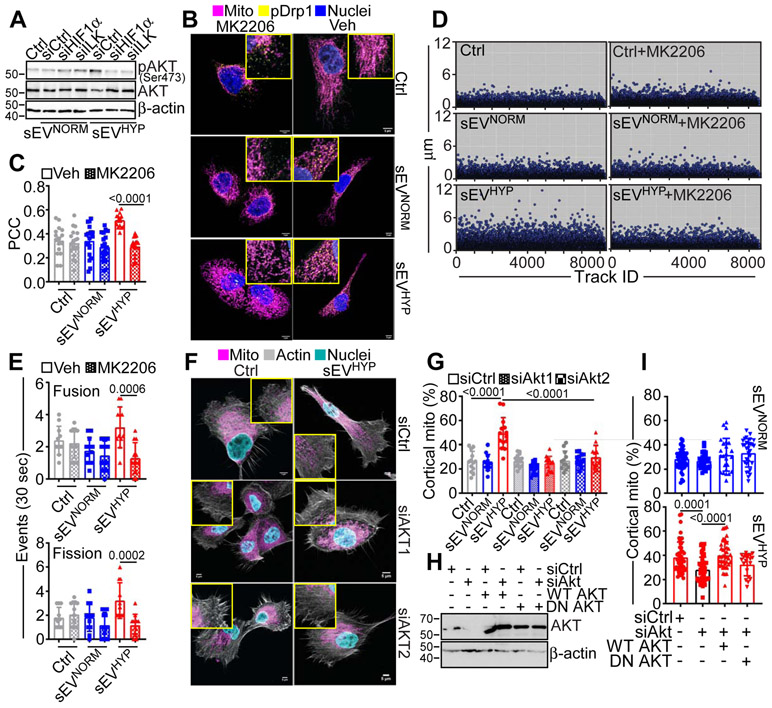
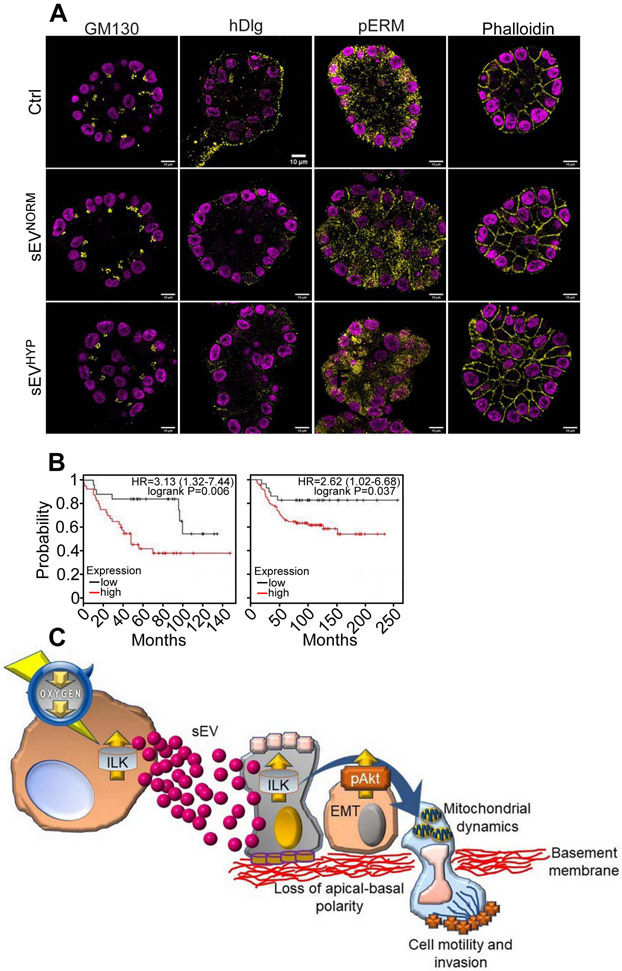
The crosstalk between tumor cells and the adjacent normal epithelium contributes to cancer progression, but its regulators have remained elusive. Here, we show that breast cancer cells maintained in hypoxia release small extracellular vesicles (sEVs) that activate mitochondrial dynamics, stimulate mitochondrial movements, and promote organelle accumulation at the cortical cytoskeleton in normal mammary epithelial cells. This results in AKT serine/threonine kinase (Akt) activation, membrane focal adhesion turnover, and increased epithelial cell migration. RNA sequencing profiling identified integrin-linked kinase (ILK) as the most upregulated pathway in sEV-treated epithelial cells, and genetic or pharmacologic targeting of ILK reversed mitochondrial reprogramming and suppressed sEV-induced cell movements. In a three-dimensional (3D) model of mammary gland morphogenesis, sEV treatment induced hallmarks of malignant transformation, with deregulated cell death and/or cell proliferation, loss of apical-basal polarity, and appearance of epithelial-to-mesenchymal transition (EMT) markers. Therefore, sEVs released by hypoxic breast cancer cells reprogram mitochondrial dynamics and induce oncogenic changes in a normal mammary epithelium.

Keywords: breast cancer; extracellular vesicles; hypoxia; mitochondria; morphogenesis; normal mammary epithelium; transformation.


Conflict of interest statement

Declaration of Interests The authors declare no competing interests.

Figures

Figure 1.
Figure 1.. Breast cancer-derived hypoxic sEV (sEVHYP) stimulate motility of normal mammary epithelial cells.
(A) Normal mammary epithelial MCF10A cells treated with small extracellular vesicles (sEV) produced by MCF7 cells under normoxic (eEVNORM) or hypoxic (sEVHYP) conditions and analyzed for directional cell migration in a wound closure assay. Representative images at time (t) 0 h and 12 h. Scale bar, 150 μm. (B) The conditions are as in (A) and directional motility of sEV-treated MCF10A recipient cells was quantified. Mean±SEM (N=5). Numbers correspond to p values by 2-way Anova with Tukey's multiple comparisons test. (C and D) MCF10A cells treated with sEVNORM or sEVHYP produced by MCF7 (top) or T47D (bottom) cells were analyzed for migration on PET inserts (C, representative images of DAPI-stained nuclei of migrated cells) and quantified (D). Scale bar, 200 μm. Mean±SEM (N=3). Numbers correspond to p values by 1-way Anova with Tukey's posttest. (E and F) MCF10A cultures treated with MCF7 cell-derived sEVNORM or sEVHYP were analyzed for cell motility in 2D contour plots (E) and the speed of cell movements (F, left) or total distance traveled (F, right) by individual sEV-treated MCF10A cells was quantified. Each tracing corresponds to an individual cell. The cutoff velocities for slow (black, <1.5 μm/min)- or fast (red, >1.5 μm/min)-moving cells are indicated. Mean±SD (N=3). Numbers correspond to p values by 1-way Anova with Tukey's posttest. (G) MCF10A cells treated with MCF7 cell-derived sEVNORM or sEVHYP were analyzed for chemotactic cell motility quantified by rose plots. Red arrow, direction of the chemotactic gradient. (N=3). (H) MCF10A cells treated with MCF7 cell-derived sEVNORM or sEVHYP were analyzed for focal adhesion (FA) turnover and the percentage of new, stable or decayed FA was quantified. Mean±SEM (N=3). Numbers correspond to p values by 2-way Anova with Tukey's posttest. (I and J) MCF10A cells as in (H) were analyzed for mitochondrial motility by time-lapse videomicroscopy (I, representative images) at time (t) 0 and 6 min, and the speed of mitochondrial movements (J, left) and total distance traveled by individual mitochondria (J, right) was quantified. Mean±SD (N=3). Scale bar, 5 μm. Numbers correspond to p values by 1-way Anova with Tukey’s posttest.
Figure 2.
Figure 2.. Breast cancer-derived sEVHYP regulate mitochondrial dynamics.
(A and B) MCF10A cells treated with T47D cell-derived sEVNORM or sEVHYP were imaged after 24 h for subcellular mitochondrial distribution by confocal fluorescence microscopy (A, representative images) and the percentage of mitochondria localized to the cortical cytoskeleton was quantified (B). Insets, magnification of indicated areas. Scale bar, 5 μm. Mean±SD (N=3). Numbers correspond to p values by 1-way Anova with Tukey’s posttest. (C) MCF10A cells treated with MCF7- or T47D-cell-derived sEVNORM or sEVHYP were analyzed for changes in mitochondrial inner membrane potential by TMRM labeling and flow cytometry. Mean±SD (N=3). (D) MCF10A cells treated with MCF7 cell-derived sEVNORM or sEVHYP for 8 h were analyzed by Western blotting. p, phosphorylated. (N=3). (E and F) sEVNORM- or sEVHYP-treated MCF10A cells were analyzed for co-localization of Ser616-phosphorylated Drp1 (pDrp1) and mitochondria by confocal microscopy (E, representative images) and quantified (F). Insets, image magnification of indicated areas. Mean±SD (N=3). Scale bar, 5 μm. Numbers correspond to p values by 1-way Anova with Tukey’s posttest. PCC, Pearson Correlation Coefficient. (G and H) sEV-treated MCF10A cells were analyzed for changes in mitochondrial volume indicative of organelle fusion (>1.5-fold, positive y-scale) or fission (<1.5-fold, negative y-scale) over 30-sec intervals (G) and the number of mitochondrial fusion and fission events was quantified (H) Each line corresponds to changes in mitochondrial volume in a single cell. Mean±SEM (N=3). Numbers correspond to p values by 2 way-Anova with Sidak's multiple comparisons test. See also Figure S3. (I and J) sEV-treated MCF10A cells transfected with control non-targeting siRNA (siCtrl) or siRNA directed to MNF1 (siMFN1) or Drp1 (siDrp1) were analyzed by Western blotting (I) and cell migration on PET inserts (J). Mean±SD (N=3).
Figure 3.
Figure 3.. sEVHYP-induced reprogramming of normal mammary epithelial cells.
(A) Ingenuity Pathway Analysis of genes significantly modulated (red, activated; blue, inhibited) in MCF10A cells treated with sEVHYP by RNA-Seq (p<0.05). (B) Bioinformatics analysis of gene pathways regulated by sEVHYP in recipient MCF10A cells by RNA-Seq. The activation Z-score and p values are indicated. (C) sEVNORM or sEVHYP-treated MCF10A cells were analyzed by Western blotting (N=3). (D) The conditions are as in (C) and MCF10A cells were analyzed for nuclear accumulation of SNAIL by fluorescence microscopy (representative images, N=3). Scale bar, 25 μm. (E) sEVNORM or sEVHYP-treated MCF10A cells were analyzed by Western blotting (N=3). (F) Whole cell extracts (WCE) or the indicated sEV-containing SEC fractions isolated from normoxic (top) or hypoxic (bottom) MCF7 cells were analyzed by Western blotting (N=2). (G) WCE, unfractionated sEV or CD63-positive (CD63+) or -negative (CD63−) sEV isolated from normoxic (top) or hypoxic (bottom) MCF7 cells were analyzed by Western blotting. An antibody to CD9 was used as a control (N=3). (H) MCF10A cells treated with total sEV, IgG-negative sEV (sEVIgG−) or CD63-negative sEV (sEVCD63−) isolated from MCF7 or T47D cells were analyzed for 2D motility with quantification of speed of cell movements (top) and total distance traveled by individual cells (bottom). Non-binding-sEV to IgG-coated beads were used as control. Mean±SD (N=3). Numbers correspond to p values by 1-way Anova with Tukey’s posttest.
Figure 4.
Figure 4.. ILK regulation of ExoHYP-induced mitochondrial dynamics.
(A and B) MCF10A cells treated with MCF7 cell-derived sEVNORM or sEVHYP after transfection with siCtrl, siHIF1α or siILK were analyzed for subcellular mitochondrial localization by confocal fluorescence microscopy (A, representative images) and the percentage of mitochondria accumulated at the cortical cytoskeleton was quantified (B). Insets, image magnification of indicated areas. Scale bar, 5 μm. Mean±SD (N=3). Numbers correspond to p values by 1-way Anova with Tukey’s multiple comparisons test. (C) MCF10A cells treated with MCF7 cell-derived sEVNORM or sEVHYP after transfection with siCtrl or siILK (left) or treated with small molecule ILK inhibitor, Cpd22 were analyzed for FA turnover by time-lapse videomicroscopy and the percentage of new, stable and decayed FA events under the various conditions tested was quantified. Mean±SD (N=3). Numbers correspond to p values by 1-way Anova with Tukey’s multiple comparisons test. (D) MCF10A cells co-cultured with MCF7 cell-derived sEVNORM or sEVHYP after transfection with siCtrl, siHIF1α or siILK were analyzed for 2D motility and the speed of cell movements (top) or total distance traveled by individual cells (bottom) was quantified. Mean±SD (N=3). Numbers correspond to p values by 1-way Anova with Tukey’s multiple comparisons test. (E) MCF7 cells transfected with siCtrl or siILK were reconstituted with sEVNORM or sEVHYP and analyzed after 8 h by Western blotting (N=3). (F and G) MCF7 cells transfected with siCtrl or siILK were treated with sEVNORM or sEVHYP and analyzed for co-localization of Ser616-phosphorylated Drp1 (pDrp1) with mitochondria by confocal microscopy (F, representative images) and quantified (G, N=3). Insets, image magnification of indicated areas. Scale bar, 5 μm. Numbers correspond to p values by 1-way Anova with Tukey’s multiple comparisons test. PCC, Pearson Correlation Coefficient. (H) The reconstitution conditions are as in (E) and MCF7 cells were analyzed for subcellular accumulation of mitochondria at the cortical cytoskeleton. Mean±SD (N=3). Numbers correspond to p values by 1-way Anova with Tukey’s multiple comparisons test. (I) Normal primary mammary epithelial cells transfected with ILK or L207W ILK mutant (ILK-Mut) were analyzed for 2D cell motility and the speed of cell movements (top) and total distance traveled by individual cells (bottom) was quantified. Mean±SD (N=3). Numbers correspond to p values by 1-way Anova with Tukey’s multiple comparisons test.
Figure 5.
Figure 5.. Akt regulation of sEVHYP-dependent mitochondrial dynamics.
(A) MCF10A cells treated with sEVNORM or sEVHYP isolated from MCF7 cells transfected with siCtrl, siHIF1α or siILK were analyzed by Western blotting. p, phosphorylated (N=3). (B and C) MCF10A cells treated with MCF7 cell-derived sEVNORM or sEVHYP were incubated with vehicle (Veh) or small molecule Akt inhibitor, MK2206 and co-localization of Ser616-phosphorylated Drp1 (pDrp1) with mitochondria was analyzed by confocal microscopy (B, representative images) and quantified (C). Scale bar, 5 μm. PCC, Pearson Correlation Coefficient. Mean±SEM (N=3) Numbers correspond to p values by 1-way Anova with Tukey’s multiple comparisons test. (D) MCF10A cells treated with MCF7 cell-derived sEVNORM or sEVHYP were treated with vehicle (Veh) or MK2206 and analyzed for mitochondrial motility by time-lapse videomicroscopy. Each symbol corresponds to an individual mitochondrion. Representative experiment (N=3). (E) MCF10A cells co-cultured with MCF7 cell-derived sEVNORM or sEVHYP were treated with vehicle (Veh) or MK2206 and analyzed for changes in mitochondrial dynamics by time-lapse videomicroscopy and fusion and fission events were quantified over 30-sec intervals. Mean±SD (N=3). Numbers correspond to p values by 2-way Anova with Tukey's posttest. (F and G) MCF10A cells treated with sEVNORM or sEVHYP isolated from MCF7 cells transfected with siCtrl, siAkt1 or siAkt2 were analyzed for subcellular mitochondrial localization by confocal microscopy (F, representative images) and the percentage of mitochondria accumulated at the cortical cytoskeleton was quantified (G). Insets, image magnification of indicated areas. Scale bar, 5 μm. Mean±SD (N=3). Numbers correspond to p values by 1-way Anova with Tukey’s multiple comparisons test. ns, not significant. (H) MCF10A cells transfected with siCtrl or siAkt were reconstituted with wild type (WT) Akt or dominant-negative (DN) Akt cDNA and analyzed by Western blotting. (N=3). (I) MCF10A cells reconstituted as in (H) and treated with MCF7 cell-derived sEVNORM (top) or sEVHYP (bottom) were quantified for mitochondrial accumulation at the cortical cytoskeleton by confocal microscopy. Mean±SD (N=3). Numbers correspond to p values by 1-way Anova with Tukey’s multiple comparisons test. ns, not significant. See also Figures S5 and Figure S6.
Figure 6.
Figure 6.. sEVHYP regulation of 3D mammary acini development.
(A) MCF10A cells were seeded in 3D acini culture in the presence of Ctrl, sEVNORM or sEVHYP for 21 d and imaged by brightfield microscopy. Insets, image magnification of indicated areas. Scale bar, 100 μm. (N=3). (B) The conditions are as in (A) and the surface area (top) and circularity (bottom, 1=perfect circle) of sEV-treated MCF10A acini in 3D culture were quantified. Each dot represents the mean of MCF10A acini in one 10x microscopy field. An average of 12 independent microscopy fields were used for counting. Data are expressed as boxplots (min to max) of at least three independent experiments. Numbers correspond to p values by 1-way Anova with Tukey’s multiple comparisons test. (C) The conditions are as in (A) and the lumen filling of sEV-treated MCF10A acini in 3D was quantified. Data are expressed as boxplots (min to max) of at least three independent experiments. Numbers correspond to p values by 1-way Anova with Tukey’s multiple comparisons test. (D) sEV-treated MCF10A acini in 3D as in (A) were analyzed for Ki67 (top) or cleaved caspase 3 (bottom) reactivity after 8 d, by immunohistochemistry. Representative equatorial section images. Scale bar, 10 μm. (E and F) The conditions are as in (D) and the percentage of Ki67+ nuclei and cleaved caspase 3-expressing cells was quantified for sEV added once at t=0 (E) or sequentially every 4 d (F). MFI, mean fluorescence intensity. Data are expressed as boxplots (min to max) of at least three independent experiments. Numbers correspond to p values by 1-way Anova with Tukey’s multiple comparisons test. (G) The conditions are as in (D) and sEV-treated MCF10A acini in 3D were analyzed for expression of pAkt (Ser473, top), nuclear accumulation of SNAIL (middle) or levels of vimentin (bottom) after 21 d, by immunohistochemistry. Representative confocal microscopy images are shown; inset, magnification of selected field. Scale bar, 10 μm. (H) The conditions are as in (G) and the percentage of pAkt+ cells (max projection), SNAIL+ nuclei and expression of vimentin was quantified. Data are expressed as boxplots (min to max) of at least three independent experiments (8 independent acini per condition). MFI, mean fluorescence intensity. Numbers correspond to p values by 1-way Anova with Tukey’s multiple comparisons test, N=3. See also Figures S7.
Figure 7.
Figure 7.. Role of sEVHYP-ILK signaling in mammary gland transformation.
(A) MCF10A acini in 3D culture seeded in the presence of Ctrl, sEVNORM or sEVHYP (added once at t=0) were analyzed after 21 d for expression of apical polarity marker, GM130, basolateral polarity marker, hDlg, plasma membrane marker, pERM or actin cytoskeleton marker, phalloidin by immunohistochemistry. Representative confocal microscopy images (N=3). (B) Correlation between ILK expression and overall survival in two independent series of triple-negative breast cancer patients. Kaplan-Meier curves for each dataset are indicated. HR, hazard ratio. (C) Proposed model for sEVHYP regulation of mitochondrial functions and cell motility in transformation of the normal mammary epithelium via ILK and Akt signaling. See text for details. See also Figures S7.

Comment in

References

    1. Agarwal E, Altman BJ, HoSeo J, Bertolini I, Ghosh JC, Kaur A, Kossenkov AV, Languino LR, Gabrilovich DI, Speicher DW, et al. (2019). Myc Regulation of a Mitochondrial Trafficking Network Mediates Tumor Cell Invasion and Metastasis. Mol Cell Biol 39. - PMC - PubMed
    1. Altieri DC (2019). Mitochondrial dynamics and metastasis. Cell Mol Life Sci 76, 827–835. - PMC - PubMed
    1. Anderson LR, Sutherland RL, and Butt AJ (2010). BAG-1 overexpression attenuates luminal apoptosis in MCF-10A mammary epithelial cells through enhanced RAF-1 activation. Oncogene 29, 527–538. - PubMed
    1. Anderson RG, Ghiraldeli LP, and Pardee TS (2018). Mitochondria in cancer metabolism, an organelle whose time has come? Biochim Biophys Acta Rev Cancer 1870, 96–102. - PMC - PubMed
    1. Antonyak MA, Li B, Boroughs LK, Johnson JL, Druso JE, Bryant KL, Holowka DA, and Cerione RA (2011). Cancer cell-derived microvesicles induce transformation by transferring tissue transglutaminase and fibronectin to recipient cells. Proc Natl Acad Sci U S A 108, 4852–4857. - PMC - PubMed

Publication types

MeSH terms

Substances