. 2020 Sep-Oct:484-485:112832.
doi: 10.1016/j.jim.2020.112832. Epub 2020 Aug 8.

SARS-CoV-2-specific ELISA development

Affiliations

SARS-CoV-2-specific ELISA development

Vicky Roy et al. J Immunol Methods. 2020 Sep-Oct.

Abstract

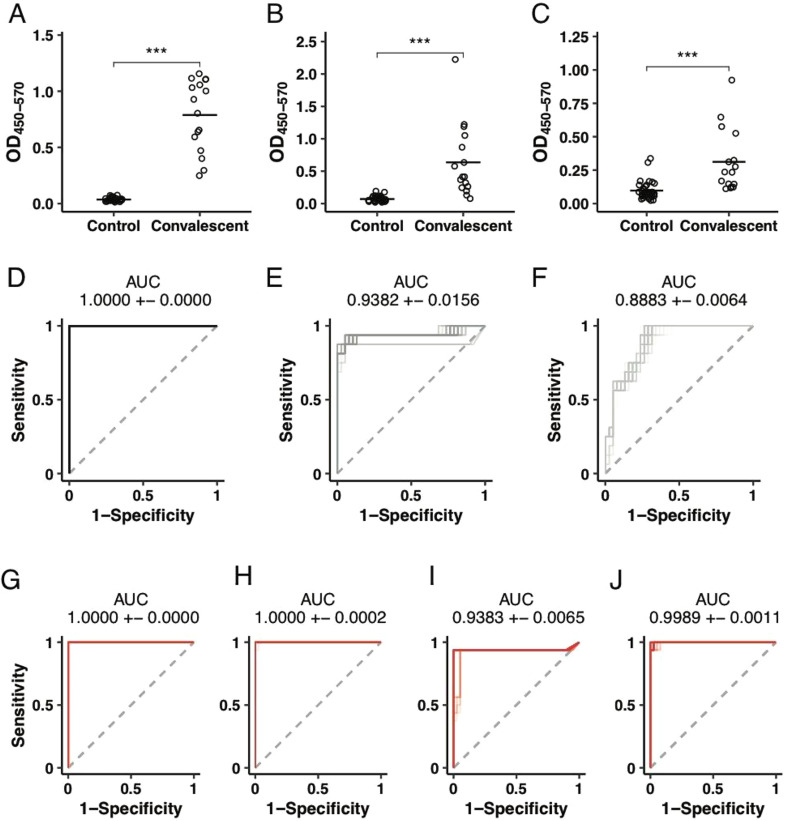
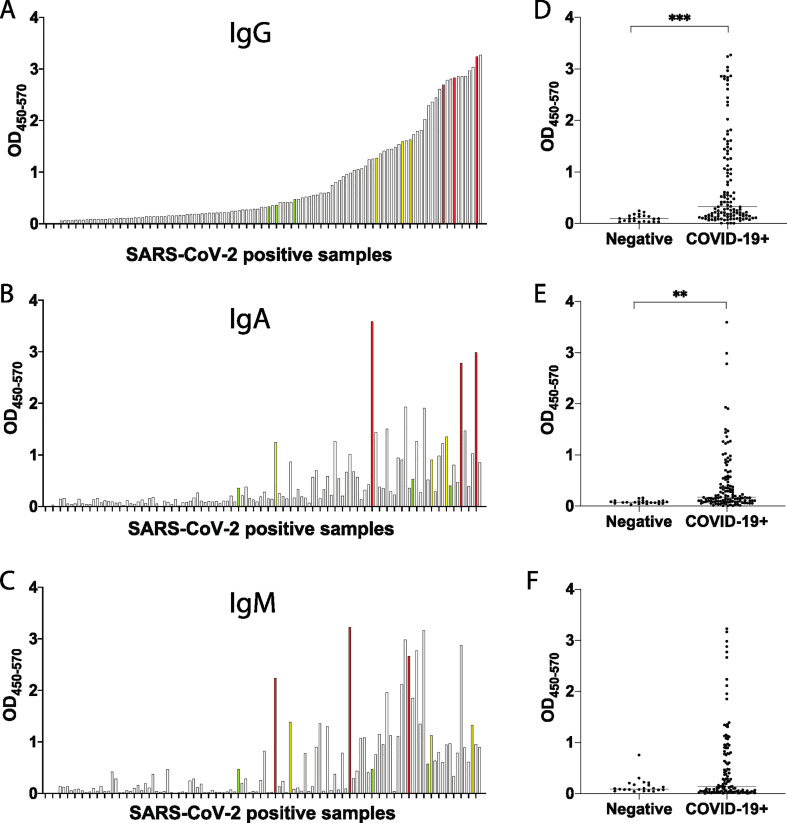
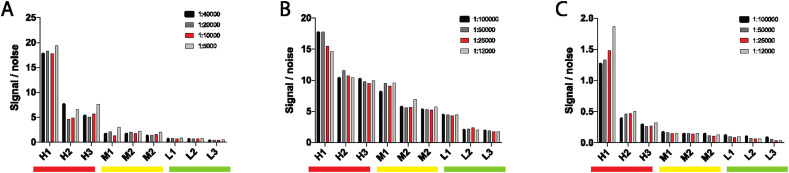
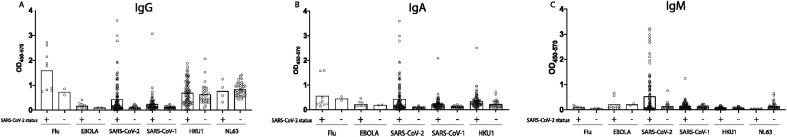
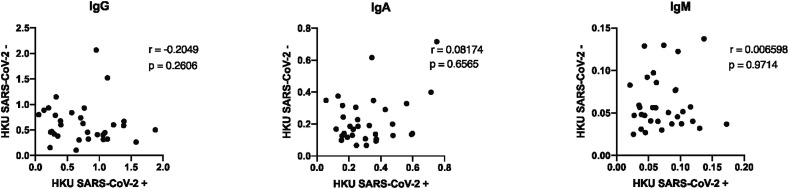
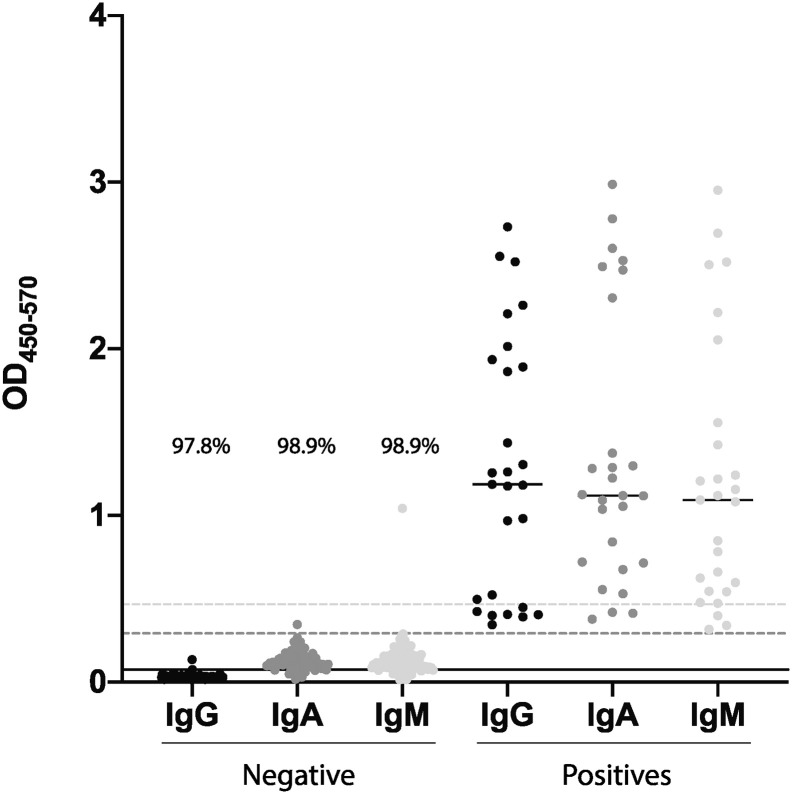
Critical to managing the spread of COVID-19 is the ability to diagnose infection and define the acquired immune response across the population. While genomic tests for the novel Several Acute Respiratory Syndrome Coronavirus 2 (SARS-CoV-2) detect the presence of viral RNA for a limited time frame, when the virus is shed in the upper respiratory tract, tests able to define exposure and infection beyond this short window of detectable viral replication are urgently needed. Following infection, antibodies are generated within days, providing a durable read-out and archive of exposure and infection. Several antibody tests have emerged to diagnose SARS-CoV-2. Here we report on a qualified quantitative ELISA assay that displays all the necessary characteristics for high-throughput sample analysis. Collectively, this test offers a quantitative opportunity to define both exposure and levels of immunity to SARS-CoV-2.


Conflict of interest statement

Declaration of Competing Interest Galit Alter is a founder of SeromYx.

Figures

Fig. 1
Fig. 1
Robust discrimination between convalescents and community controls by ELISA. (A-C) The dot plots show the differences in CoV2-receptor binding domain (RBD) IgG (A), IgA (B), or IgM (C) levels in convalescents and community controls. Groups were compared using a Mann-Whitney U test (***p < 0.001). (D-J) Receiver operator characteristic (ROC) curves. Area under the curve (AUC) was calculated in a 10-fold cross-validation framework for 100 repetitions for discriminating 38 SARS-CoV-2 negatives from 16 convalescent SARS-CoV-2 positives based on OD450570 levels for (D) IgG (E) IgA (F) IgM (G) IgG and IgA, (H) IgG and IgM, (I) IgA and IgM, (J) IgG, IgA, IgM. AUCs are reported as mean + − SD.
Fig. 2
Fig. 2
CoV2-RBD-specific antibody levels in early CoV2 infection. 118 SARS-CoV-2 positive samples were screened for SARS-COV-2-RBD specific IgG (A), IgA (B) and IgM (C). Each graph shows the OD obtained for each sample (450 nm–570 nm). Selected high samples are shown in red, mediums in yellow and lows in green. The same set of SARS-CoV-2 positive samples was run against 22 negative samples. Data is shown for IgG (D), IgA (E), IgM (F). Groups were compared using a Mann-Whitney U test (**p < 0.01, ***p < 0.001). . (For interpretation of the references to colour in this figure legend, the reader is referred to the web version of this article.)
Fig. 3
Fig. 3
CoV2-RBD-specific isotype profiles in early CoV2 infection. Relative amount of IgG, IgA and IgM against SARS-CoV-2-RBD are shown for the whole panel of 118 SARS-CoV-2 positive serum sample. For each sample, the relative amount of an isotype is reported as fold over background.
Fig. 4
Fig. 4
Optimization of antigen amount. With high (H), medium (M) and low (L) samples, four different concentrations of SARS-CoV-2-RBD were tested for IgG (A), IgA (B) and IgM (C). Optimal concentrations are shown in red. (For interpretation of the references to colour in this figure legend, the reader is referred to the web version of this article.)
Fig. 5
Fig. 5
Optimization of detecting antibody dilution. With high (H), medium (M) and low (L) samples, four different dilutions of detecting antibody were tested for IgG (A), IgA (B) and IgM (C). Optimal dilutions are shown in red. (For interpretation of the references to colour in this figure legend, the reader is referred to the web version of this article.)
Fig. 6
Fig. 6
Binding specificity. Binding specificity was assessed by running SARS-CoV-2 positive samples against Flu HA, EBOLA GP, CoV-HKU1-RBD, CoV-NL63-RBD, SARS-CoV-1-RBD and SARS-CoV-2-RBD for IgG (A), IGA (B) and IgM (C). Boxes show average result.
Fig. 7
Fig. 7
Absence of correlation between SARS-CoV-2 and HKU1 titers. Correlation analyses are plotted for HKU1 titers for SARS-CoV-2 positive and negative samples. Spearman rank correlation coefficient (r) and p value are shown.
Fig. 8
Fig. 8
Limit of detection. Known negative samples were run against SARS-CoV-2-RBD for IgG, IgA and IgM. The graph shows 90 negative samples for all three isotypes, the limit of detection (lines of corresponding colors) and the percentage of data point under the limit of detection. High, medium and low positive samples were also plotted to show the range in contrast to the limit of detection.
Fig. 9
Fig. 9
Quantification. 12 points dilution curves were run for CR3022_IgG (A), CR3022_IgA (B) and CR3022_IgM (C) monoclonal. The dotted lines show linear range between ULOQ and LLOQ. A five-parameter log-logistic function (Y = c + (d - c)/((1 + exp.(b*(log(X) - log(e))))^f)) allows the conversion of OD in concentration of antibody (μg/ml).
Fig. 10
Fig. 10
ROC curves. ROC curves were calculated based on OD450570 levels for IgG, IgA, IgM, IgG and IgA, IgG and IgM, IgA and IgM, IgG, IgA and IgM. Area under the curve (AUC) were calculated to assess performance of the model in a 10-fold cross-validation framework for 100 repetitions and reported as mean + − SD. ROC curves are shown for all samples and for 8–14 days, 15–21 days or > 21 days from symptoms onset.
Fig. 11
Fig. 11
Threshold at maximal Youden Index. Individual data points for SARS-CoV-2 positive and negative samples are plotted for IgG, IgA and IgM. Data is shown for all samples and for 8–14 days, 15–21 days or > 21 days from symptoms onset. Dashed lines show OD value at maximal Youden index as calculated from ROC curves shown in Fig. 9.
Fig. 12
Fig. 12
Precision Correlation. Correlation analyses are plotted for each operator across days. Spearman rank correlation coefficient are shown for each day.

References

    1. Adams E.R. Evaluation of antibody testing for SARS-CoV-2 using ELISA and lateral flow immunoassay. medRxiv. 2020 doi: 10.1101/2020.04.15.20066407. - DOI
    1. Amanat F., Krammer F. SARS-CoV-2 vaccines: status report. Immunity. 2020 doi: 10.1016/j.immuni.2020.03.007. - DOI - PMC - PubMed
    1. Amanat F. A serological assay to detect SARS-CoV-2 seroconversion in humans. medRxiv. 2020 doi: 10.1101/2020.03.17.20037713. - DOI - PMC - PubMed
    1. Bajic G. Influenza Antigen Engineering Focuses Immune Responses to a Subdominant but Broadly Protective Viral Epitope. Cell Host Microbe. 2019;25:827–835. doi: 10.1016/j.chom.2019.04.003. e826. - DOI - PMC - PubMed
    1. Bendavid E. COVID-19 Antibody Seroprevalence in Santa Clara County, California. medRxiv. 2020 doi: 10.1101/2020.04.14.20062463. - DOI - PMC - PubMed

MeSH terms

Substances