. 2020 Aug 12;21(1):197.
doi: 10.1186/s13059-020-02108-x.

Spatial patterns of CTCF sites define the anatomy of TADs and their boundaries

Affiliations

Spatial patterns of CTCF sites define the anatomy of TADs and their boundaries

Luca Nanni et al. Genome Biol. .

Abstract

Background: Topologically associating domains (TADs) are genomic regions of self-interaction. Additionally, it is known that TAD boundaries are enriched in CTCF binding sites. In turn, CTCF sites are known to be asymmetric, whereby the convergent configuration of a pair of CTCF sites leads to the formation of a chromatin loop in vivo. However, to date, it has been unclear how to reconcile TAD structure with CTCF-based chromatin loops.

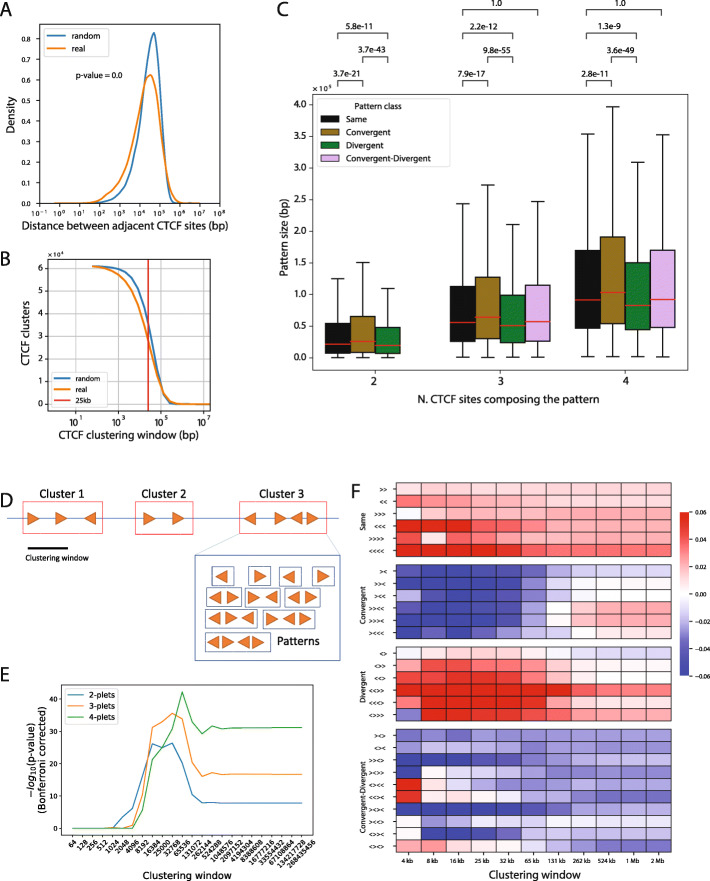
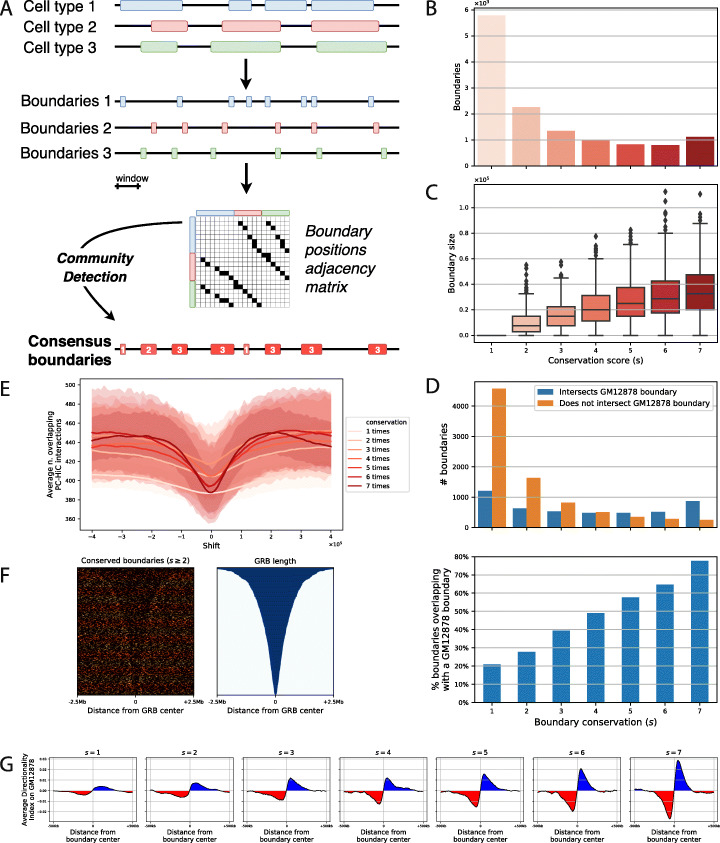
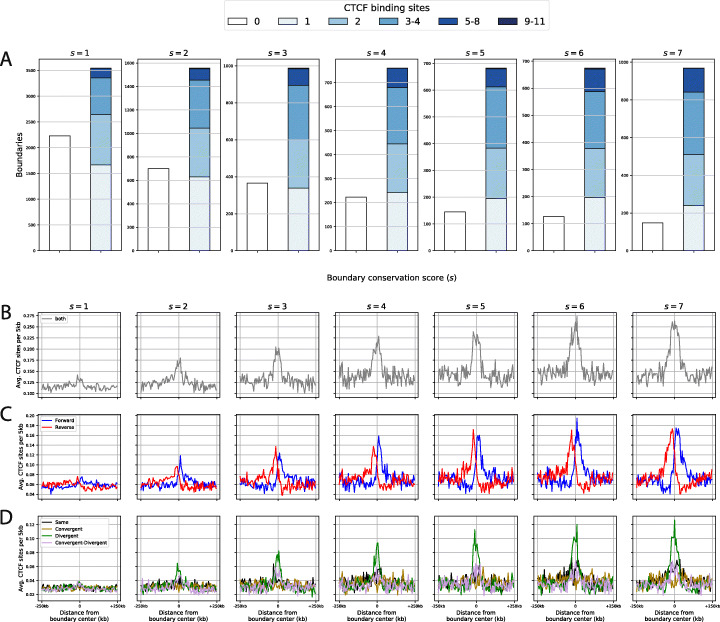
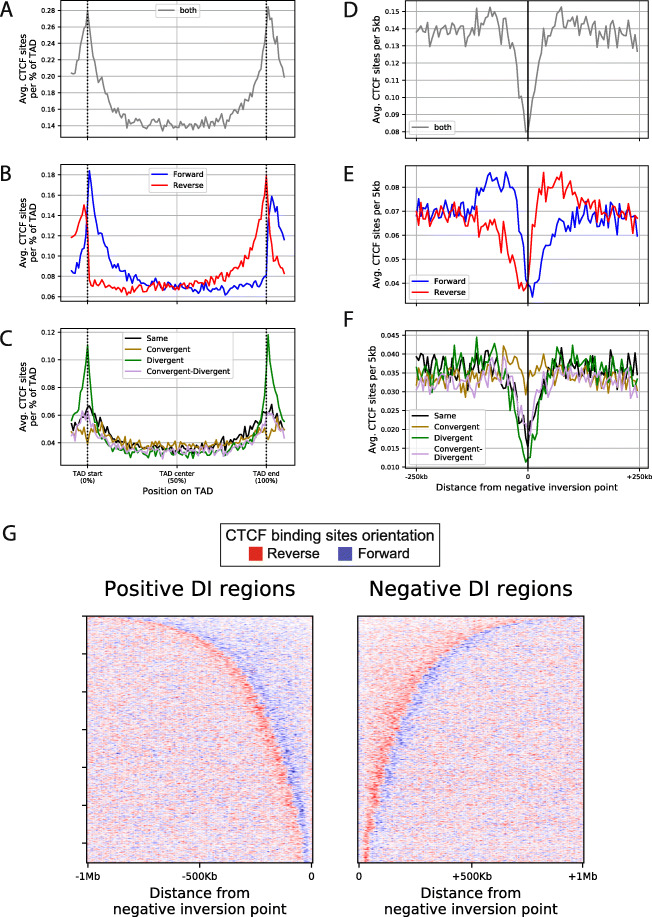
Results: We approach this problem by analysing CTCF binding site strengths and classifying clusters of CTCF sites along the genome on the basis of their relative orientation. Analysis of CTCF site orientation classes as a function of their spatial distribution along the human genome reveals that convergent CTCF site clusters are depleted while divergent CTCF clusters are enriched in the 5- to 100-kb range. We then analyse the distribution of CTCF binding sites as a function of TAD boundary conservation across seven primary human blood cell types. This reveals divergent CTCF site enrichment at TAD boundaries. Furthermore, convergent arrays of CTCF sites separate the left and right sections of TADs that harbour internal CTCF sites, resulting in unequal TAD 'halves'.

Conclusions: The orientation-based CTCF binding site cluster classification that we present reconciles TAD boundaries and CTCF site clusters in a mechanistically elegant fashion. This model suggests that the emergent structure of nuclear chromatin in the form of TADs relies on the obligate alternation of divergent and convergent CTCF site clusters that occur at different length scales along the genome.

Keywords: CTCF binding site clusters; CTCF orientation patterns; Chromatin architecture; Loop extrusion; TAD boundary conservation; TADs.


Conflict of interest statement

Not applicable.

Figures

Fig. 1
Fig. 1
CTCF binding site enrichment at gene promoters. Density of CTCF binding sites and their features around 7747 gene promoters bearing at least one of 8846 CTCF binding sites computed as the averages in 10-bp bins. All panels are centred on the gene transcription start sites (Ensembl v72). The window starts on the left (− 2 kb) and ends in the gene body on the right (+ 2 kb). Genes are stratified in four equal subsets based on their expression values (Read Per Kilobase per Million reads, RPKM) in macrophages [4]; the shading of each line reflects the expression level. We first show a the density of CTCF binding sites, then b their average motif score computed by HOMER, then c their average ChipSeq score computed from the 33 ENCODE NarrowPeak tracks and finally d the ratios of average motif and ChipSeq scores for each bin
Fig. 2
Fig. 2
Classification of CTCF site clusters by relative orientation. CTCF mono-plet, di-plet, tri-plet and tetra-plet adjacent binding sites in all possible patterns of relative orientation. Patterns are divided into four classes: Same (all sites oriented in the same direction), Convergent (sites pointing towards each other), Divergent (sites pointing away from each other) and, for tri-plets and tetra-plets, the class Convergent + Divergent. The total number of patterns discovered from the complete set of CTCF binding sites in the human genome, independent of inter-CTCF site distance, is shown for each class. Note that the marginal sums of patterns along the columns are slightly different. This is because the number of k-plet patterns found in each chromosome arm (see the ‘Methods’ section) is equal to M − K + 1, where M is the total number of CTCF sites on that chromosome arm. Therefore, we have a discrepancy of 42 di-plets, 84 tri-plets and 126 tetra-plets relative to the mono-plets (see the ‘Methods’ section). p values are computed for di-, tri- and tetra-plets using the Pearson chi-square test. Effect sizes and significances were also computed by randomising the orientations of CTCF binding sites (see Additional file 1: Fig. S4)
Fig. 3
Fig. 3
CTCF site cluster spatial distribution analysis reveals orientation biases in the human genome. Spatial distribution of CTCF binding sites and their motif orientation. a Distribution of distances between adjacent CTCF binding sites along the human genome (orange) and in spatially randomised CTCF binding sites (blue). The p value was computed at the hand of the Mann–Whitney U test for the difference between the two distributions. b Number of CTCF clusters at varying clustering window. Starting with a window of 1 bp yields 61,079 mono-plets and using a 108 bp window yields as many clusters as chromosome arms. Shuffled CTCF sites along the genome (blue) are compared to the real spatial distribution of sites (orange). The red line shows the 25-kb clustering window. c For each set of clusters composed of 2, 3 and 4 binding sites and subsequently stratified by their class, we show the distribution of their size (distance from the most upstream to the most downstream binding site). The brackets show the p values obtained in Bonferroni-corrected t tests. d Schematic representation of the clustering and pattern finding process. Clusters are non-overlapping sets of adjacent CTCF binding sites and can be decomposed in their various sub-patterns. In particular, in this representation, given the indicated clustering window, we find three clusters of CTCF sites. We also show that cluster 3 corresponds to 4 mono-plets, 3 di-plets, 2 tri-plets and 1 tetra-plet. ep values calculated with the Pearson chi-square test (see Fig. 2) as a function of the clustering window size used in panel f. f Overrepresented (red) and underrepresented (blue) occurrences of CTCF patterns as a function of the indicated clustering window sizes. The colour scale represents log10 enrichment values (see the ‘Methods’ section). CTCF orientation patterns are ordered by class, as in Fig. 2
Fig. 4
Fig. 4
Conserved boundaries show a gradient of enrichment of Hi-C features. a Schematic representation of the boundary consensus algorithm using an example of three cell types and a total of ten TADs that yields eight boundaries with conservation scores 1 to 3. For each conservation score, we report b the number and c the size distribution obtained when starting with the seven primary blood cell type TAD datasets of Javierre et al. [12]. d For each conservation score, the number (top) and proportion (bottom) of consensus boundaries that intersect a GM12878 cell boundary are shown. e Average number of PC-HIC loops from Javierre et al. [12] that span consensus boundaries of each conservation score. At the centre, the real boundary set is shown and then the coordinates are shifted to the left and right in steps of 10 kb up to 400 kb. f Density of consensus boundaries conserved in at least two cell types (s = > 2) on Genomic Regulatory Blocks (GRB) obtained from Harmston et al. [41], aligned at the centre of 5-Mb regions and ordered from largest to smallest. g Average directionality index in 5-kb windows, computed on GM12878 and projected onto the s1 to s7 boundaries in 1-Mb windows
Fig. 5
Fig. 5
Consensus boundaries are enriched in divergent CTCF sites. a Number of boundaries with a given conservation score that harbour 0 to 11 CTCF sites. To circumvent length biases, each boundary was defined by taking its centre and extending that for 25 kb in both directions. bd Average number of b any CTCF sites, c Forward (>, blue) and reverse (<, red) or d tri-plet orientation classes shown in 5-kb bins spanning a 500-kb window around the boundary centres and stratified by conservation score
Fig. 6
Fig. 6
Negative directionality index inversion sites are depleted of three CTCF classes but not the convergent patterns. ac Enrichment of a CTCF binding sites, b CTCF site orientation and c CTCF orientation classes along the length of a meta-TAD based on the TAD collection reported by Javierre et al. [12]. Each TAD was divided into 100 bins, and the average number of CTCF sites was computed for each bin. df As for ac but for 500-kb windows centred on the negative (+) to (−) points of inversion of directionality index showing d the average number of CTCF sites, e CTCF site orientation and f CTCF orientation classes per 5-kb bins. g Distribution of Forward (>, blue) and Reverse (<, red) CTCF sites in 1-Mb window from DI negative inversion points. On the left panel, the positive DI regions extracted from the TADs of GM12878 are ordered by their length from top to bottom and aligned with the negative inversion point to the right. On the right panel, the negative DI regions are ordered by their length from top to bottom and aligned with the negative inversion point to the left. Note that TADs are in general not symmetric with respect to their negative inversion point, as positive and negative DI regions in general have different lengths (see also Additional file 1: Fig. S9A-C)

Similar articles

Cited by

References

    1. Atlasi Y, Megchelenbrink W, Peng T, Habibi E, Joshi O, Wang SY, et al. Epigenetic modulation of a hardwired 3D chromatin landscape in two naive states of pluripotency. Nat Cell Biol. 2019;21:568–578. - PubMed
    1. Mifsud B, Tavares-Cadete F, Young AN, Sugar R, Schoenfelder S, Ferreira L, et al. Mapping long-range promoter contacts in human cells with high-resolution capture Hi-C. Nat Genet. 2015;47:598–606. - PubMed
    1. Sanyal A, Lajoie BR, Jain G, Dekker J. The long-range interaction landscape of gene promoters. Nature. 2012;489:109–113. - PMC - PubMed
    1. Wang C, Nanni L, Novakovic B, Megchelenbrink W, Kuznetsova T, Stunnenberg HG, et al. Extensive epigenomic integration of the glucocorticoid response in primary human monocytes and in vitro derived macrophages. Sci Rep. 2019;9:2772. - PMC - PubMed
    1. Beagrie RA, Scialdone A, Schueler M, Kraemer DCA, Chotalia M, Xie SQ, et al. Complex multi-enhancer contacts captured by genome architecture mapping. Nature. 2017;543:519–524. - PMC - PubMed

Publication types

LinkOut - more resources