. 2020 Aug 11;10(1):13509.
doi: 10.1038/s41598-020-70468-2.

Molecular determinants of SR-B1-dependent Plasmodium sporozoite entry into hepatocytes

Affiliations

Molecular determinants of SR-B1-dependent Plasmodium sporozoite entry into hepatocytes

Anne-Claire Langlois et al. Sci Rep. .

Abstract

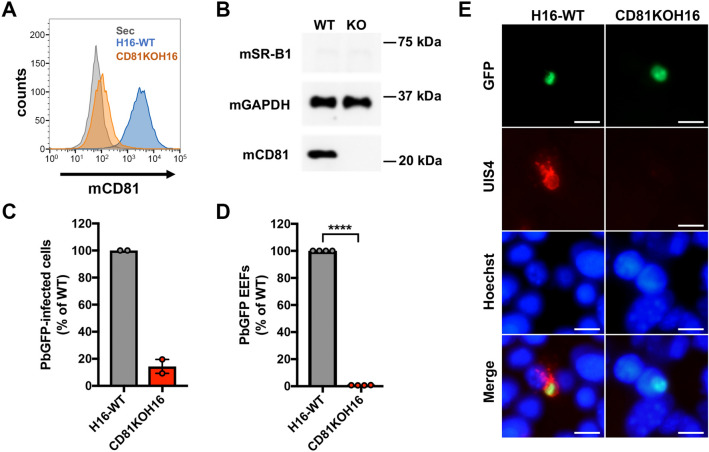
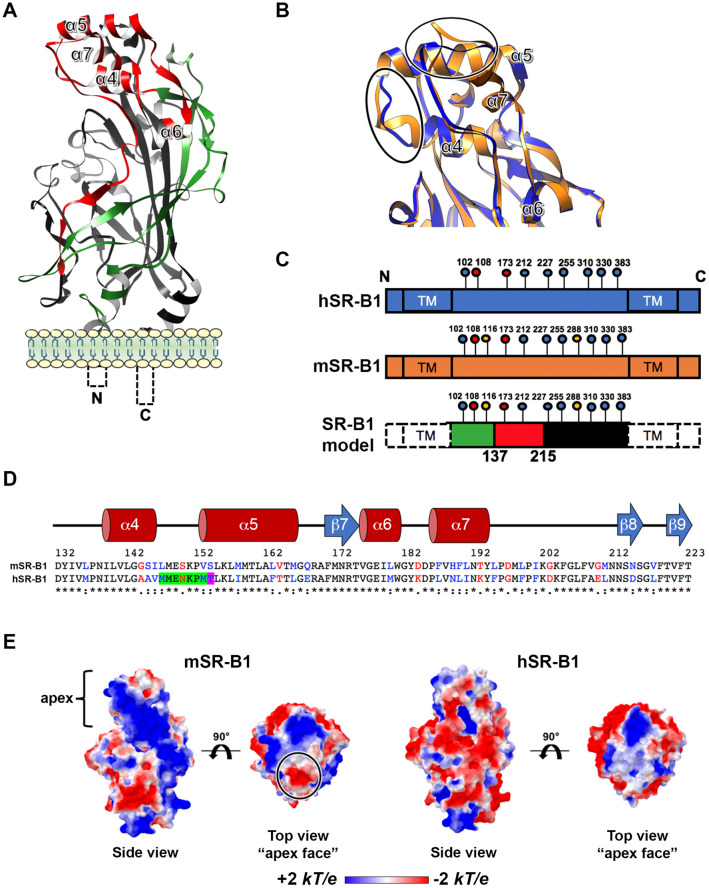
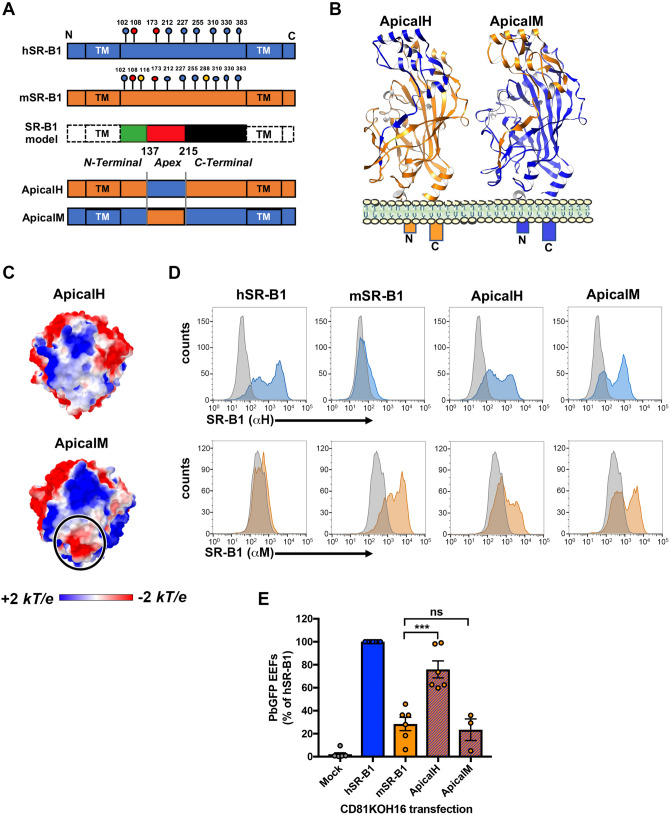
Sporozoite forms of the Plasmodium parasite, the causative agent of malaria, are transmitted by mosquitoes and first infect the liver for an initial round of replication before parasite proliferation in the blood. The molecular mechanisms involved during sporozoite invasion of hepatocytes remain poorly understood. Two receptors of the Hepatitis C virus (HCV), the tetraspanin CD81 and the scavenger receptor class B type 1 (SR-B1), play an important role during the entry of Plasmodium sporozoites into hepatocytes. In contrast to HCV entry, which requires both CD81 and SR-B1 together with additional host factors, CD81 and SR-B1 operate independently during malaria liver infection. Sporozoites from human-infecting P. falciparum and P. vivax rely respectively on CD81 or SR-B1. Rodent-infecting P. berghei can use SR-B1 to infect host cells as an alternative pathway to CD81, providing a tractable model to investigate the role of SR-B1 during Plasmodium liver infection. Here we show that mouse SR-B1 is less functional as compared to human SR-B1 during P. berghei infection. We took advantage of this functional difference to investigate the structural determinants of SR-B1 required for infection. Using a structure-guided strategy and chimeric mouse/human SR-B1 constructs, we could map the functional region of human SR-B1 within apical loops, suggesting that this region of the protein may play a crucial role for interaction of sporozoite ligands with host cells and thus the very first step of Plasmodium infection.


Conflict of interest statement

The authors declare no competing interests.

Figures

Figure 1
Figure 1
P. berghei sporozoites can infect primary mouse hepatocytes through CD81-and SR-B1-independent pathways. (A) Primary hepatocytes isolated from WT or SR-B1 deficient C57BL/6 mice were infected with PbGFP sporozoites in the absence or presence of neutralizing anti-mCD81 mAb MT81, and cultured for 24 h before EEF quantification (mean control values for each experiment without MT81: 63 and 266 EEFs/well in srb1+/+ hepatocytes; 94, 311 and 420 EEFs/well in srb1−/− hepatocytes). *p < 0.05 (ratio paired t test). (B)P. berghei infection in Hepa1-6 cells was inhibited by the anti-mCD81 mAb MT81 antibody (mean control values for each experiment without MT81: 0.64 and 1.09% PbGFP-infected cells).
Figure 2
Figure 2
CRISPR-mediated inactivation of CD81 abrogates P. berghei infection in Hepa1-6 cells. (A) Hepa1-6 and CD81KOH16 cells were stained for surface CD81 with anti-CD81 MT81 monoclonal antibody and Alexa Fluor 488-conjugated secondary antibodies, before flow cytometry analysis. Histograms represent the fluorescence intensity of extracellular CD81 proteins for WT Hepa1-6 (blue) and CD81KOH16 cells (orange). The grey histogram represents cells stained with secondary antibodies only (Control). (B) Western blot analysis of total CD81 protein expression in WT Hepa1-6 and CD81KOH16 cells. GAPDH was used as loading control. (C–E) WT Hepa1-6 and CD81KOH16 cells were infected with PbGFP sporozoites and analyzed 24 h after invasion by flow cytometry (C) or microscopy (D, E) after staining with anti-UIS4 antibodies (red) and Hoechst 33342 nuclear stain (blue). The mean control values for each experiment were 0.27 and 0.93% PbGFP-infected cells (C), and 144, 145, 215 and 288 EEFs/well (D). ****p < 0.0001 (ratio paired t test). The images show PbGFP EEFs (green) surrounded by a UIS4-positive PV membrane (red) or intranuclear parasites in CD81KOH16 cells. Scale bar, 10 μm.
Figure 3
Figure 3
Mouse SR-B1 poorly supports P. berghei sporozoite invasion. (A,B) CD81KOH16 cells were transfected with either mouse or human SR-B1 plasmids, or no plasmid as a control (Mock). Total protein expression was analyzed using polyclonal anti-SR-B1 antibodies (Ab24603) by western blot (A) with GAPDH as a loading control. Surface protein expression was analyzed by flow cytometry (B) using anti-human “αH” SR-B1 polyclonal rabbit serum (blue) and anti-mouse “αM” polyclonal antibodies NB400-113 (orange). The grey histogram represents untransfected cells labeled with the corresponding antibody. (C,D) CD81KOH16 (C) and WT Hepa1-6 cells treated with siRNA against CD81 24 h before (D), were transfected with mouse or human SR-B1 plasmids, or no plasmid as a negative control (Mock), and then infected with PbGFP sporozoites. EEF numbers were counted by microscopy after UIS4 staining, 24 h after sporozoite addition. The mean control values for each experiment were 59, 139, 214, 245, 299, 315 and 383 EEFs/well in hSR-B1-transfected CD81KOH16 cells (C), and 30, 140, 155 and 215 EEFs/well in control Hepa1-6 cells (D). *p < 0.05; **p < 0.01 (repeated measures one-way ANOVA followed by Tukey’s multiple comparisons test).
Figure 4
Figure 4
SR-B1 modeling identifies potential functional regions. (A) Predicted tertiary structure of hSR-B1 extracellular domain by homology modeling using CD36 (PDB ID: 5lgd) as a template, with the three regions referred to as “N-terminal” (green), “apex” (red) and “C-terminal” (black). (B) A close-up view of structural alignment of the apical helix bundle of mouse (orange) and human (blue) SR-B1, with their four alpha helices (α4 to α7). The main structural differences are circled in black. (C) Schematic representation of SR-B1 N-glycosylation sites on human (blue) and mouse (orange) proteins. Two determinant sites for SR-B1 structure and function are in red (Asn 108 and 173), mouse specific sites are in yellow (Asn 116 and 288) and conserved sites are in blue. SR-B1 model is a schematic representation of the delineated regions (“N-terminal” (green), “apex” (red), “C-terminal” (black)) in SR-B1 protein displaying all potential N-glycosylation sites. (D) Pairwise sequence alignment of mSR-B1 and hSR-B1 proteins for the 132–223 apical region with corresponding predicted human secondary structure (alpha helices in red and beta strand in blue). Identical, similar and different amino acids are represented in black, blue and red respectively. The threonine residue position corresponding to PfEMP1 binding phenylalanine in CD36 homolog is highlighted in purple. The residues in SR-B1 equivalent to Enterovirus-interacting site in LIMP-2 are highlighted in green and purple. (E) Electrostatic surface potential of mSR-B1 and hSR-B1 extracellular domain from side and top views. Values are in units of kT/e at 298 K, on a scale of − 2 kT/e (red) to + 2 kT/e (blue). White color indicates a neutral potential. The black circle highlights a differential electrostatic surface potential between mSR-B1 and hSR-B1 at the top of the “apex” region.
Figure 5
Figure 5
The apical domain of SR-B1 plays a crucial role during P. berghei infection. (A) Schematic representation of the ApicalH and ApicalM chimeric constructs. (B) Predicted tertiary structure of ApicalH and ApicalM chimeras by homology modeling, highlighting the portions of mouse (orange) or human (blue) origins. (C) Top views of the electrostatic surface potential of ApicalH and ApicalM chimeras’ apex. Values are in units of kT/e at 298 K, on a scale of − 2 kT/e (red) to + 2 kT/e (blue). White color indicates a neutral potential. The black circle highlights a differential electrostatic surface potential between the two chimeric constructs at the top of the “apex” region. (D) CD81KOH16 cells were transfected with hSR-B1, mSR-B1, ApicalH or ApicalM chimera plasmids, or no plasmid as a control (Mock). Protein surface expression was analyzed using anti-hSR-B1 (“αH”, blue histograms) and anti-mSR-B1 (“αM”, orange histograms), 24 h after transfection. The grey histogram represents untransfected cells stained with the cognate antibody. (E) CD81KOH16 cells were transfected with hSR-B1, mSR-B1, ApicalH or ApicalM constructs, or no plasmid as a control (Mock), and infected with PbGFP sporozoites 24 h after transfection. The number of infected cells (EEFs) was determined by microscopy after UIS4 staining, 24 h after sporozoite addition (mean control values for each experiment: 59, 139, 214, 245, 299, 315 and 383 EEFs/well in hSR-B1-transfected CD81KOH16 cells). ns, non-significant; ***p < 0.001 (one-way ANOVA followed by Tukey’s multiple comparisons test).
Figure 6
Figure 6
A key domain within the SR-B1 apex regulates P. berghei infection. (A) Mouse and human protein sequence alignment of the apical region AA 132–223 with the corresponding predicted human secondary structure (alpha helices in red and beta strand in blue). Identical, similar and different amino acids are represented in black, blue and red respectively. Short domains D1, D2 and D3 are delimited by boxes. (B) Predicted tertiary structure of D1, D2 and D3 chimeras by homology modeling, highlighting the segments of mouse (orange) or human (blue) origins. (C) Top views of the electrostatic surface potential of the D1, D2 and D3 chimera apices. Values are in units of kT/e at 298 K, on a scale of − 2 kT/e (red) to + 2 kT/e (blue). White color indicates a neutral potential. Black circles highlight differential electrostatic surface potentials between the different chimeric constructs at the top of the “apex” region. (D) CD81KOH16 cells were transfected with hSR-B1, mSR-B1, D1, D2, or D3 chimeric constructs. Protein surface expression was analyzed using anti-hSR-B1 (“αH”, blue histograms) and anti-mSR-B1 (“αM”, orange histograms), 24 h after transfection. The grey histogram represents untransfected cells stained with the cognate antibody. (E) CD81KOH16 cells were transfected with hSR-B1, mSR-B1, D1, D2, or D3 chimeric constructs, or no plasmid as a control (Mock), and then infected with PbGFP sporozoites 24 h after transfection. The number of infected cells (EEFs) was determined by microscopy after UIS4 staining, 24 h after sporozoite addition (mean control values for each experiment: 59, 139, 214, 245, 299, 315 and 383 EEFs/well in hSR-B1-transfected CD81KOH16 cells). ns, non-significant; **p < 0.01 (one-way ANOVA followed by Tukey’s multiple comparisons test).

References

    1. World Health Organization. World Malaria Report 2019. 1–232 (2019).
    1. Rodrigues CD, et al. Host scavenger receptor SR-BI plays a dual role in the establishment of malaria parasite liver infection. Cell Host Microbe. 2008;4:271–282. doi: 10.1016/j.chom.2008.07.012. - DOI - PubMed
    1. Silvie O, et al. Hepatocyte CD81 is required for Plasmodium falciparum and Plasmodium yoelii sporozoite infectivity. Nat. Med. 2003;9:93–96. doi: 10.1038/nm808. - DOI - PubMed
    1. Manzoni G, et al. Plasmodium P36 determines host cell receptor usage during sporozoite invasion. Elife. 2017;6(e25903):1–24. - PMC - PubMed
    1. Yalaoui S, et al. Scavenger receptor BI boosts hepatocyte permissiveness to Plasmodium infection. Cell Host Microbe. 2008;4:283–292. doi: 10.1016/j.chom.2008.07.013. - DOI - PubMed

Publication types