. 2020 Aug 11;11(1):4018.
doi: 10.1038/s41467-020-17840-y.

Gut microbial co-abundance networks show specificity in inflammatory bowel disease and obesity

Affiliations

Gut microbial co-abundance networks show specificity in inflammatory bowel disease and obesity

Lianmin Chen et al. Nat Commun. .

Abstract

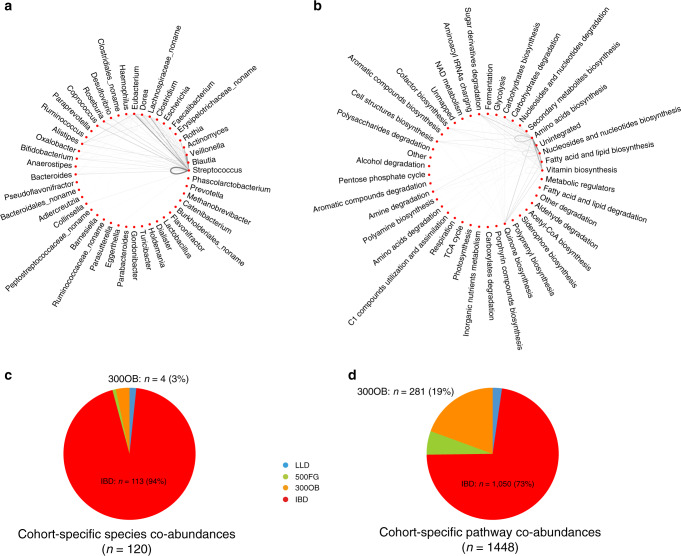
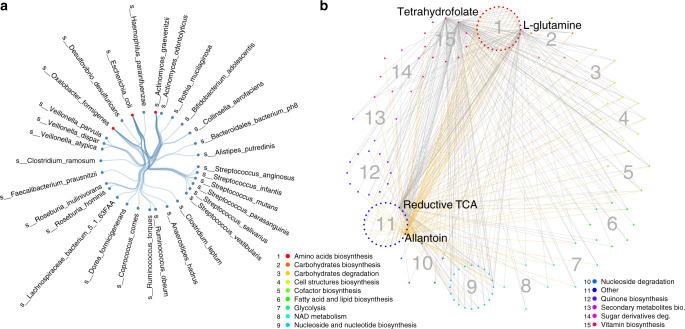
The gut microbiome is an ecosystem that involves complex interactions. Currently, our knowledge about the role of the gut microbiome in health and disease relies mainly on differential microbial abundance, and little is known about the role of microbial interactions in the context of human disease. Here, we construct and compare microbial co-abundance networks using 2,379 metagenomes from four human cohorts: an inflammatory bowel disease (IBD) cohort, an obese cohort and two population-based cohorts. We find that the strengths of 38.6% of species co-abundances and 64.3% of pathway co-abundances vary significantly between cohorts, with 113 species and 1,050 pathway co-abundances showing IBD-specific effects and 281 pathway co-abundances showing obesity-specific effects. We can also replicate these IBD microbial co-abundances in longitudinal data from the IBD cohort of the integrative human microbiome (iHMP-IBD) project. Our study identifies several key species and pathways in IBD and obesity and provides evidence that altered microbial abundances in disease can influence their co-abundance relationship, which expands our current knowledge regarding microbial dysbiosis in disease.


Conflict of interest statement

The authors declare no competing interests.

Figures

Fig. 1
Fig. 1. Analysis workflow of the present study.
The study comprised 2,379 metagenomics samples from four cohorts: the general population LifeLines-DEEP cohort (LLD), the 500FG cohort, an obesity cohort (300OB), and an inflammatory bowel disease (IBD) cohort. By combining SparCC and SPIEC-EASI methods, we constructed species and pathway co-abundance networks in each cohort separately. The established co-abundances were then subjected to heterogeneity testing and cohort-specificity analysis to assess whether the effect size of each co-abundance was significantly different between cohorts and whether the differences were driven by a specific cohort.
Fig. 2
Fig. 2. Microbial co-abundance networks in each cohort.
a Venn diagram of the numbers of species co-abundances detected in each cohort. In total, we identified 3454 co-abundance relationships significant at FDR < 0.05 in at least one cohort by combing SparCC and SpiecEasi. b Venn diagram of the numbers of species co-abundances detected in each cohort. Similarly, at the microbial metabolic pathway level, 43,355 co-abundance relationships were detected at FDR < 0.05 in at least one cohort by combing SparCC and SpiecEasi.
Fig. 3
Fig. 3. Differential and cohort-specific microbial co-abundances.
a Differential species co-abundances involved in 45 microbial genera. b Differential pathway co-abundances involved in 41 microbial metabolic categories. Each dot indicates one microbial genus or metabolic category. Each line represents differential species or pathway co-abundances between species or pathways from either the same or different genera or metabolic categories. The width and darkness of the lines represent the relative number of differential co-abundances. c Pie chart of 120 cohort-specific species co-abundances showing the proportion of specific co-abundances detected in each cohort. d Pie chart of 1448 cohort-specific pathway co-abundances showing the proportion of specific co-abundances detected in each cohort.
Fig. 4
Fig. 4. Cohort-specific species and pathway co-abundances.
a Cohort-specific co-abundances identified for three key species in the IBD cohort, involving 33 IBD-specific co-abundances. Each dot indicates one species. Red indicates IBD key species. Each line represents one IBD-specific co-abundance relationship. b Cohort-specific co-abundances identified for four key pathways in IBD and one key pathway in 300OB, involving 385 cohort-specific co-abundances. Each line represents a cohort-specific correlation between two pathways. Yellow lines represent obesity-specific co-abundances. Grey lines represent IBD-specific co-abundances. Each dot indicates one pathway. Pathways belonging to the same metabolic category have the same colour and are clustered as sub-circles. Colour legends are shown in the plot.
Fig. 5
Fig. 5. Menaquinone biosynthesis related to Streptococcus overgrowth in IBD.
a Menaquinone biosynthesis (PWY-5837) from the reductive TCA cycle (P23-PWY) in bacteria. b The menaquinone biosynthesis pathway shows IBD-specific interaction with the reductive TCA cycle pathway. c Both menaquinone biosynthesis and reductive TCA cycle pathway abundance are significantly higher (ANOVA test, FDR < 0.05) in the IBD cohort than in the two population-based cohorts. Box plots show medians and the first and third quartiles (the 25th and 75th percentiles) of abundance after correcting for age and sex, respectively. The upper and lower whiskers extend the largest and smallest value no further than 1.5 × IQR, respectively. Outliers are plotted individually. (Source data is provided as a Source data file). d Three Streptococcus species show IBD-specific co-abundance with Escherichia coli. e The menaquinone biosynthesis pathway shows strong positive correlation with three Streptococcus species in IBD. N = 2379 independent samples are involved (NLLD = 1135, N500FG = 450, N300OB = 298, NIBD = 496). The forest plots show co-abundance strength and direction in each cohort, with square dot for the correlation coefficient and bar for the 95% confidence interval.
Fig. 6
Fig. 6. Allantoin degradation pathway links to glycaemia in obesity.
The allantoin degradation pathway shows stronger negative correlation with 14 amino acid biosynthesis pathways in the obesity cohort compared to the other cohorts. These pathways represent the biosynthesis of six amino acids: a isoleucine (PWY-5103, PWY-3001, BRANCHED-CHAIN-AA-SYN-PWY and ILEUSYN-PWY), b methionine (PWY-6151, PWY-5347, MET-SAM-PWY and HOMOSER-METSYN-PWY), c threonine (THRESYN-PWY and PWY-724), d lysine (PWY-5097 and PWY-2942), e aspartate (PWY0-781) and f homoserine (METSYN-PWY). All six amino acids are involved in the oxaloacetate/aspartate amino acids biosynthesis pathway. Lines with arrows represent metabolic relationships. Lines with a circle represent an inhibitory role in a metabolic pathway. N = 2379 independent samples are involved (NLLD = 1135, N500FG = 450, N300OB = 298, NIBD = 496). The forest plots show co-abundance strength and direction in each cohort, with square dot for the correlation coefficient and bar for the 95% confidence interval.

References

    1. Chen LM, Garmaeva S, Zhernakova A, Fu JY, Wijmenga C. A system biology perspective on environment-host-microbe interactions. Hum. Mol. Genet. 2018;27:R187–R194. - PubMed
    1. Falony G, et al. Population-level analysis of gut microbiome variation. Science. 2016;352:560–564. - PubMed
    1. Zhernakova A, et al. Population-based metagenomics analysis reveals markers for gut microbiome composition and diversity. Science. 2016;352:565–569. - PMC - PubMed
    1. Lloyd-Price J, et al. Strains, functions and dynamics in the expanded Human Microbiome Project. Nature. 2017;550:61–66. - PMC - PubMed
    1. Kurilshikov A, Wijmenga C, Fu J, Zhernakova A. Host genetics and gut microbiome: challenges and perspectives. Trends Immunol. 2017;38:633–647. - PubMed

Publication types