. 2020 Sep;20(3):2291-2301.
doi: 10.3892/ol.2020.11763. Epub 2020 Jun 19.

Mechanistic studies of cytotoxic activity of the mesoionic compound MIH 2.4Bl in MCF-7 breast cancer cells

Affiliations

Mechanistic studies of cytotoxic activity of the mesoionic compound MIH 2.4Bl in MCF-7 breast cancer cells

Luciana Amaral de Mascena Costa et al. Oncol Lett. 2020 Sep.

Abstract

In the present study, the cytotoxic effects of a 1,3-thiazolium-5-thiolate derivative of a mesoionic compound, MIH 2.4Bl, were assessed in the MCF-7 breast cancer cell line. The cytotoxic effects of MIH 2.4Bl were determined using a crystal violet assay. Using a dose-response curve, the IC50 value of MIH 2.4Bl was determined to be 45.8±0.8 µM. Additionally, the effects of MIH 2.4Bl on mitochondrial respiration were characterized using oxygen consumption rate analysis. Treating MCF-7 cells with increasing concentrations of MIH 2.4Bl resulted in a significant reduction in all mitochondrial respiratory parameters compared with the control cells, indicative of an overall decrease in mitochondrial membrane potential. The induction of autophagy by MIH 2.4Bl was also examined by measuring changes in the expression of protein markers of autophagy. As shown by western blot analysis, treatment of MCF-7 cells with MIH 2.4Bl resulted in increased protein expression levels of Beclin-1 and ATG5, as well as an increase in the microtubule-associated protein 1A/1B light chain 3B (LC3B)-II to LC3B-I ratio compared with the control cells. Microarray analysis of changes in gene expression following MIH 2.4Bl treatment demonstrated 3,659 genes exhibited a fold-change ≥2. Among these genes, 779 were up-regulated, and 2,880 were down-regulated in cells treated with MIH 2.4Bl compared with the control cells. Based on the identity of the transcripts and fold-change of expression, six genes were selected for verification by reverse transcription-quantitative (RT-q)PCR; activating transcription factor 3, acidic repeat-containing protein, heparin-binding EGF-like growth factor, regulator of G-protein signaling 2, Dickkopf WNT signaling pathway inhibitor 1 and adhesion molecule with Ig like domain 2. The results of RT-qPCR analysis of RNA isolated from control and MIH 2.4Bl treated cells were consistent with the expression changes identified by microarray analysis. Together, these results suggest that MIH 2.4Bl may be a promising candidate for treating breast cancer and warrants further in vitro and in vivo investigation.

Keywords: autophagy; breast cancer; cancer therapy; chemotherapy; cytotoxicity; mesoionic compound; mitochondria.


Figures

Figure 1.
Figure 1.
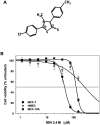
Effect of MIH 2.4Bl on the viability of MCF-7 breast cancer cells. (A) The chemical structure of the mesoionic compound MIH 2.4Bl. (B) Relative cell viability of MCF-7 cells (circles) was determined using a crystal violet assay after 72 h of treatment with increasing concentrations of MIH 2.4Bl. The relative cell viability of HMEC (triangles) and MCF-10A cells (squares) was also determined. Each data point represents the mean ± the standard error of the mean of eight replicates. The IC50 values were calculated based on data from the best fit data of the Hill slope curve using a nonlinear regression analysis. HMEC, human mammary epithelial cells.
Figure 2.
Figure 2.
Effect of MIH 2.4Bl on the induction of autophagy in MCF-7 cells. (A) Expression of Beclin-1, ATG5, LC3B II/I and GAPDH were determined by western blot analysis in control or MIH 2.4Bl treated cells after 48 or 72 h of culture. (B) Densitometry analysis of Beclin-1, ATG5, LC3B II and LC3B I expression was performed and normalized to GAPDH. Data are presented as histograms of normalized Beclin-1 and ATG5 intensity values, and the intensity ratios of LC3B-II to LC3B-I. LC3B, microtubule-associated protein 1A/1B light chain 3B. C, control cells; M, MIH 2.4Bl treated cells.
Figure 3.
Figure 3.
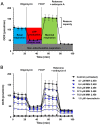
Dose-dependent effects of MIH 2.4Bl on the OCR of MCF-7 cells. (A) Representative schematic of OCR using specific inhibitors to assess mitochondrial function. After four initial measurements to acquire the baseline OCR, sequential injections of oligomycin, FCCP, and a rotenone/antimycin A mixture were performed with four OCR measurements obtained after each injection. Shown in the OCR profile are calculations of basal respiration, maximal respiration, ATP production, proton leak, reserve respiratory capacity and non-mitochondrial respiration. (B) OCR profiles were determined in MCF-7 cells after treatment for 24 h with 4.7, 9.4, 18.8, 37.7 or 75.4 µM MIH 2.4Bl. Treatment with 1.5 µM doxorubicin for 24 h was used as a positive control for maximum cytotoxic effect. Each data point represents the mean ± the standard error of the mean of eight replicates. OCR, oxygen consumption rate.
Figure 4.
Figure 4.
Microarray expression summary. Data are expressed as a scatter plot showing the ≥2-fold upregulated and downregulated genes (light grey and dark grey dots, respectively) in MCF-7 cells treated with MIH 2.4Bl compared with control cells. Genes with <2-fold change are shown as black dots.
Figure 5.
Figure 5.
Effect of MIH 2.4Bl on the mRNA expression levels of six differentially expressed genes in MCF-7 cells. Relative expression levels of ACRC, HBEGF, ATF3, RGS2, DKK1 and AMIGO2 were determined in control and MIH 2.4Bl treated cells. Data were calculated as ΔΔCq values based on Cq expression levels in MIH 2.4Bl treated cells compared with control cells, and normalized to GAPDH expression. Each data point represents the mean ± the standard error of the mean of three replicates. *P<0.05. ACRC, acidic repeat-containing protein; HBEGF, heparin-binding EGF-like growth factor; ATF3, activating transcription factor 3; RGS2, Regulator of G-protein signaling 2; DKK1, Dickkopf WNT signaling pathway inhibitor 1; AMIGO2, adhesion molecule with Ig like domain 2.
Figure 6.
Figure 6.
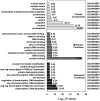
GO enrichment analysis of differentially expressed genes in MCF-7 cells treated with MIH 2.4Bl compared with the control cells. The y-axis represents the top ten significantly enriched GO terms in each category defined by biological process, molecular function, and cellular component. The x-axis data is presented in terms of the negative log (base 10) of the Benjamini-Hochberg adjusted P-values of each pathway. GO, gene ontology.

References

    1. World Health Organization. WHO report on cancer: Setting priorities, investing wisely and providing care for all World Health Organization, 2020. https://apps.who.int/iris/handle/10665/330745
    1. Harbeck N, Penault-Llorca F, Cortes J, Gnant M, Houssami N, Poortmans P, Ruddy K, Tsang J, Cardoso F. Breast cancer. Nat Rev Dis Primers. 2019;5:66. doi: 10.1038/s41572-019-0111-2. - DOI - PubMed
    1. Santini D, Vincenzi B, Galluzzo S, Battistoni F, Rocci L, Venditti O, Schiavon G, Angeletti S, Uzzalli F, Caraglia M, Dicuonzo G. Repeated intermittent low-dose therapy with zoledronic acid induces an early, sustained, and long-lasting decrease of peripheral vascular endothelial growth factor levels in cancer patients. Clin Cancer Res. 2007;13:4482–4486. doi: 10.1158/1078-0432.CCR-07-0551. - DOI - PubMed
    1. Bhosale SK, Deshpande SR, Wagh RD, Dhake AS. Biological activities of 1, 2, 3-oxadiazolium-5-olate derivatives. Der Chem Sin. 2015;6:79–95.
    1. Badami BV. Mesoionic compounds. Resonance. 2006;11:40–48. doi: 10.1007/BF02835674. - DOI