. 2020 May 20;36(4):692-702.
doi: 10.1002/joa3.12361. eCollection 2020 Aug.

Diverse activation patterns during persistent atrial fibrillation by noncontact charge-density mapping of human atrium

Affiliations

Diverse activation patterns during persistent atrial fibrillation by noncontact charge-density mapping of human atrium

Rui Shi et al. J Arrhythm. .

Abstract

Background: Global simultaneous recording of atrial activation during atrial fibrillation (AF) can elucidate underlying mechanisms contributing to AF maintenance. A better understanding of these mechanisms may allow for an individualized ablation strategy to treat persistent AF. The study aims to characterize left atrial endocardial activation patterns during AF using noncontact charge-density mapping.

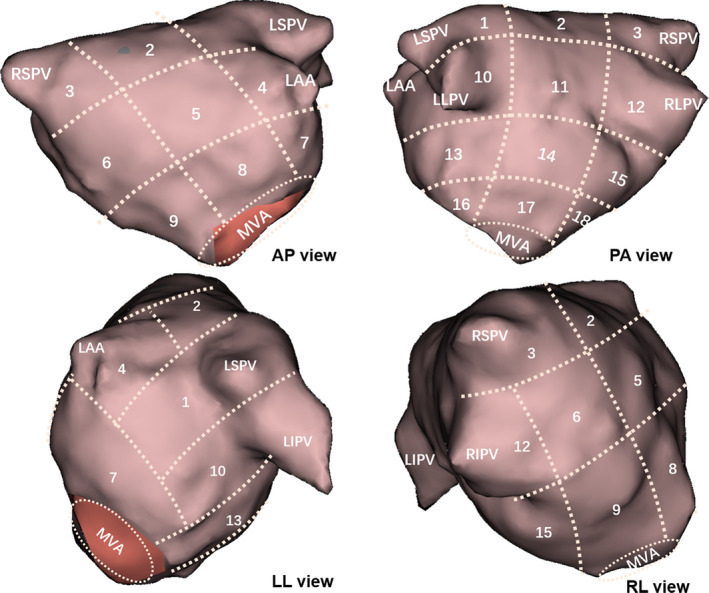
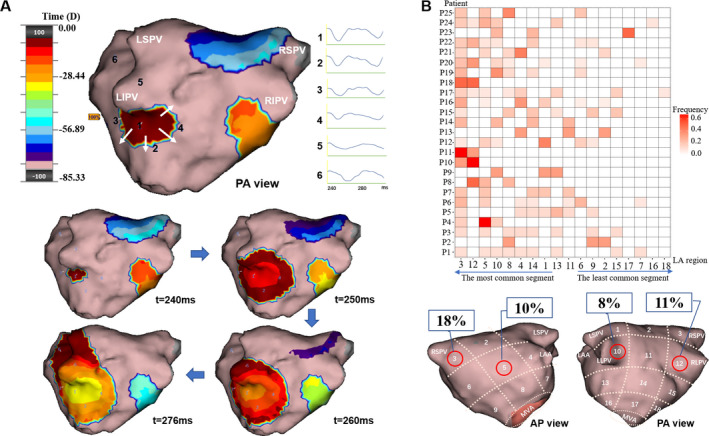
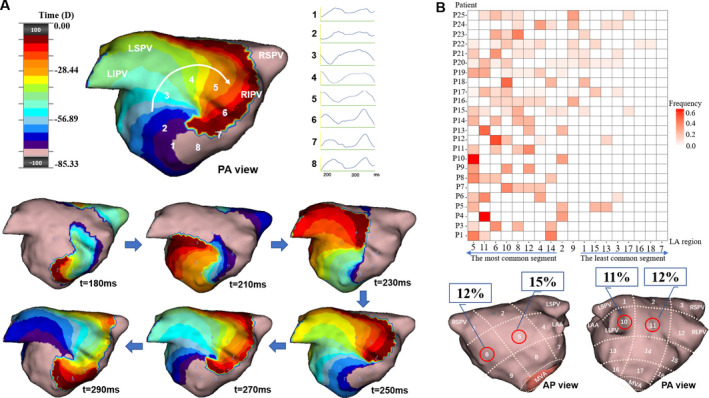
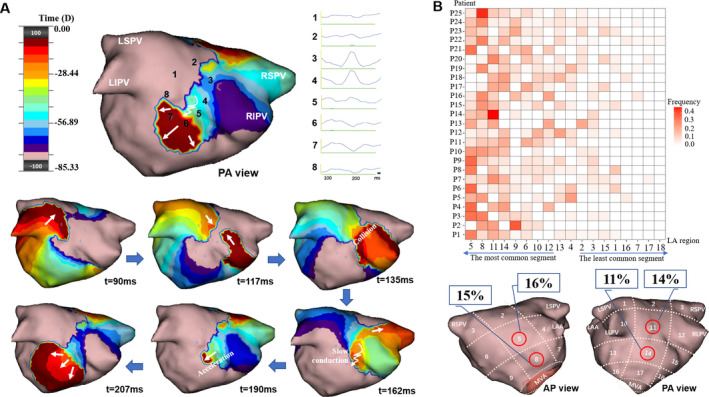
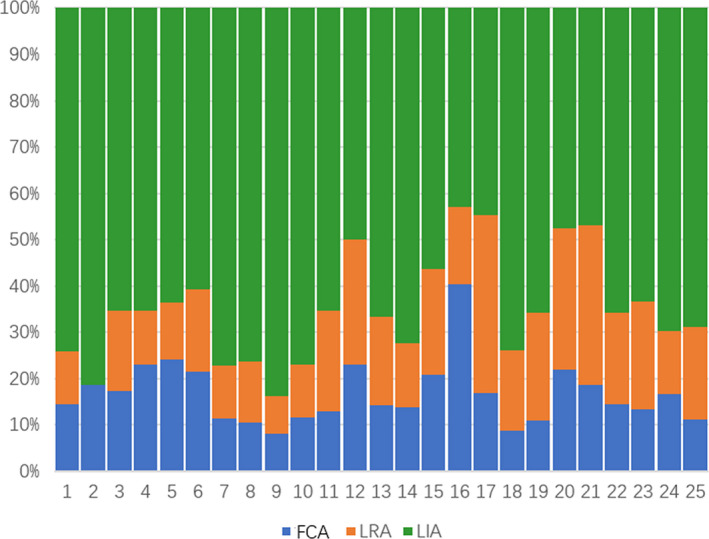
Methods: Twenty-five patients with persistent AF were studied. Activation patterns were characterized into three subtypes: (i) focal with centrifugal activation (FCA); (ii) localized rotational activation (LRA); and (iii) localized irregular activation (LIA). Continuous activation patterns were analyzed and distributed in 18 defined regions in the left atrium.

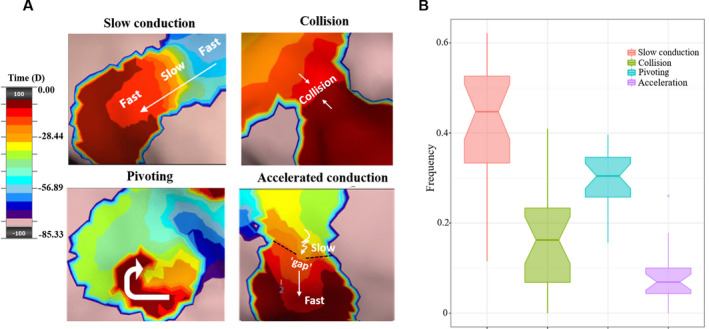
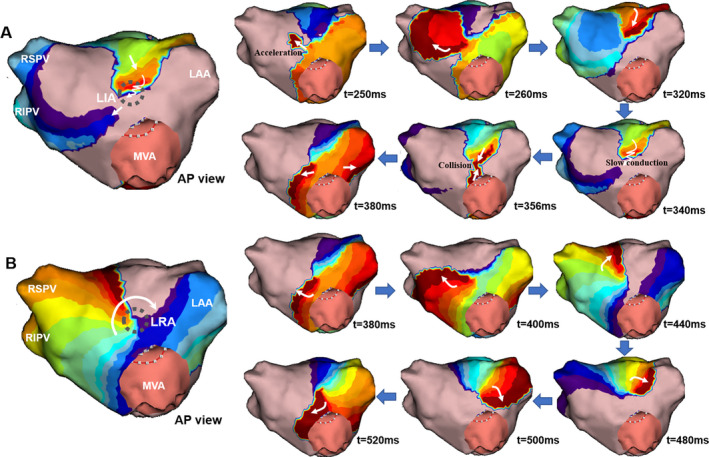
Results: A total of 144 AF segments with 1068 activation patterns were analyzed. The most common pattern during AF was LIA (63%) which consists of four disparate features of activation: slow conduction (45%), pivoting (30%), collision (16%), and acceleration (7%). LRA was the second-most common pattern (20%). FCA accounted for 17% of all activations, arising frequently from the pulmonary veins (PVs)/ostia. A majority of patients (24/25; 96%) showed continuous and highly dynamic patterns of activation comprising multiple combinations of FCA, LRA, and LIA, transitioning from one to the other without a discernible order. Preferential conduction areas were typically seen in the mid-anterior (48%) and lower-posterior (40%) walls.

Conclusion: Atrial fibrillation is characterized by heterogeneous activation patterns identified in PV-ostia and non-PV regions throughout the LA at varying locations between individuals. Clinical implications of individualized ablation strategies guided by charge-density mapping need to be determined.

Keywords: activation pattern; atrial fibrillation; localized irregular activation; localized rotational activation; noncontact charge‐density mapping.


Figures

FIGURE 1
FIGURE 1
Anatomical regions of the left atrium. The 3D geometry of the LA is divided into 18 regions for demarcating the distribution of activation patterns and are displayed in the anteroposterior (AP) view, posteroanterior (PA) view, left lateral (LL) view, and right later (RL) view, respectively. Numbered regions 1, 3, 10, and 12 represent pulmonary vein/ostium; the number 4 represents the left atrial appendage (LAA); and the remaining numbered regions include the roof, floor, anterior wall, posterior wall, and lateral and septal wall of the LA, respectively
FIGURE 2
FIGURE 2
Focal centrifugal activation (FCA) identified by charge‐density mapping and the “Heat‐map” of FCA for each patient. Panel A shows an example of a FCA involving the left inferior pulmonary vein (LIPV) (Movie A in the online Data Supplement). White arrows show the centrifugal path of the propagation at the LIPV. The virtual electrograms taken at the site of focal source (1) and the following sequential activation sites (2‐6) are shown beside the upper activation map. The propagation map is color‐coded using the standard “thermal” scale to represent a “windowed‐history” of activation‐time across the endocardium with the leading edge of the wavefront shown in maroon. The time (milliseconds) at the bottom of each snapshot represents the moment when the snapshot is taken. Panel B shows the “Heat‐map” illustrating the frequency and distribution of the activation pattern in each patient. The x‐axis denotes the order from the most to the least common LA region where the activation pattern is observed. The intensity of the color bar reflects how frequent the activation pattern is observed, which is measured by the percentage of activation among the total patterns observed in individual patient. The most common regions on the anterior and posterior walls are labeled in the LA region map below
FIGURE 3
FIGURE 3
Localized rotational activation (LRA) identified by charge‐density mapping and the “Heat‐map” of LRA for each patient. Panel A shows an example of LRA on the lower‐posterior wall of the LA in a patient with persistent AF (Movie B in the online Data Supplement). The white arrow delineates the rotational direction of the LRA. The virtual electrograms taken along the path of LRA (1‐8) are shown, respectively. The time (milliseconds) at the bottom of each snapshot represents the moment when the snapshot is taken. Panel B shows the “Heat‐map” illustrating the frequency and distribution of LRA in each patient. See Figure 2 legends for details of the figure annotations
FIGURE 4
FIGURE 4
Localized irregular activation (LIA) identified by charge‐density mapping and the “Heat‐map” of LIA for each patient. Panel A shows an example of LIA on the posterior wall of LA in a patient with persistent AF (Movie C in the online Data Supplement). The white arrows show the activation direction of the LIA. A pivot can be seen first, then wavefront collision, followed by a slow conduction, and then acceleration through a gap at the posterior wall. The virtual electrograms taken along the path of LIA (1‐8) are shown, respectively. The time (milliseconds) at the bottom of each snapshot represents the moment when the snapshot is taken. Panel B shows the “Heat‐map” illustrating the frequency and distribution of LIA in each patient. See Figure 2 legends for details of the figure annotations
FIGURE 5
FIGURE 5
Proportion of four components of localized irregular activation. Panels A shows the four components of localized irregular activation (LIA). The propagation map is color coded using the standard “thermal” scale to represent a “windowed‐history” of activation time across the endocardium with the leading edge of the wavefront shown in maroon. The box plots in Panel B illustrate the proportion of each component of LIA observed. The x‐axis denotes four types of components; the y‐axis denotes the percentage of each component in all cases
FIGURE 6
FIGURE 6
Percentage of atrial fibrillation activation patterns for each patient. The x‐axis denotes the patient number; the y‐axis denotes the frequency of each activation patterns. FCA = focal centrifugal activation; LIA = localized irregular activation; LRA = localized rotational activation
FIGURE 7
FIGURE 7
Preferential conduction area showing two consecutive activation patterns in the same patient. Panel A shows a localized irregular activation (LIA) detected on the mid‐anterior wall of the left atrium. Panel B shows a clockwise localized rotational activation (LRA) which subsequently occurred in the same region within the same R‐R interval. The grey circle represents the preferential conduction area. The time (milliseconds) at the bottom of each snapshot represents the moment when the snapshot is taken. White arrows delineate the propagation directions of the activation patterns

References

    1. Haïssaguerre M, Jaïs P, Shah DC, Takahashi A, Hocini M, Quiniou G, et al. Spontaneous initiation of atrial fibrillation by ectopic beats originating in the pulmonary veins. N Engl J Med. 1998;339:659–66. - PubMed
    1. Calkins H, Hindricks G, Cappato R, Kim YH, Saad EB, Aguinaga L, et al. 2017 HRS/EHRA/ECAS/APHRS/SOLAECE expert consensus statement on catheter and surgical ablation of atrial fibrillation: executive summary. Europace. 2018;20:157–208. - PMC - PubMed
    1. Verma A, Jiang C‐Y, Betts TR, Chen J, Deisenhofer I, Mantovan R, et al. Approaches to catheter ablation for persistent atrial fibrillation. N Engl J Med. 2015;372:1812–22. - PubMed
    1. Vogler J, Willems S, Sultan A, Schreiber D, Lüker J, Servatius H, et al. Pulmonary vein isolation versus defragmentation: the CHASE‐AF clinical trial. J Am Coll Cardiol. 2015;66:2743–52. - PubMed
    1. Narayan SM, Krummen DE, Shivkumar K, Clopton P, Rappel W‐J, Miller JM, et al. Treatment of atrial fibrillation by the ablation of localized sources: CONFIRM (Conventional Ablation for Atrial Fibrillation With or Without Focal Impulse and Rotor Modulation) trial. J Am Coll Cardiol. 2012;60:628–36. - PMC - PubMed