. 2020 Nov;44(8):893-907.
doi: 10.1002/gepi.22349. Epub 2020 Aug 11.

Joint testing of donor and recipient genetic matching scores and recipient genotype has robust power for finding genes associated with transplant outcomes

Affiliations

Joint testing of donor and recipient genetic matching scores and recipient genotype has robust power for finding genes associated with transplant outcomes

Victoria L Arthur et al. Genet Epidemiol. 2020 Nov.

Abstract

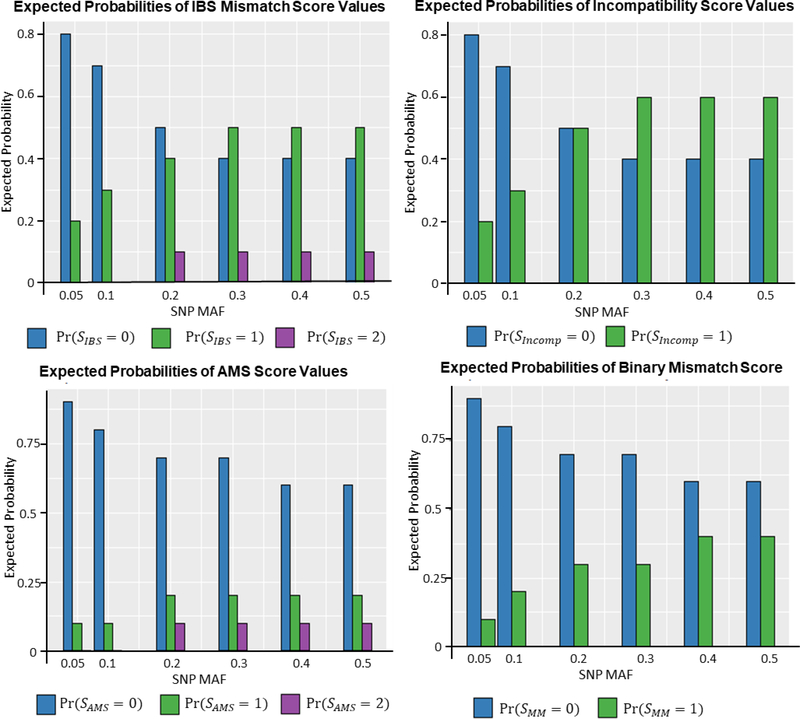
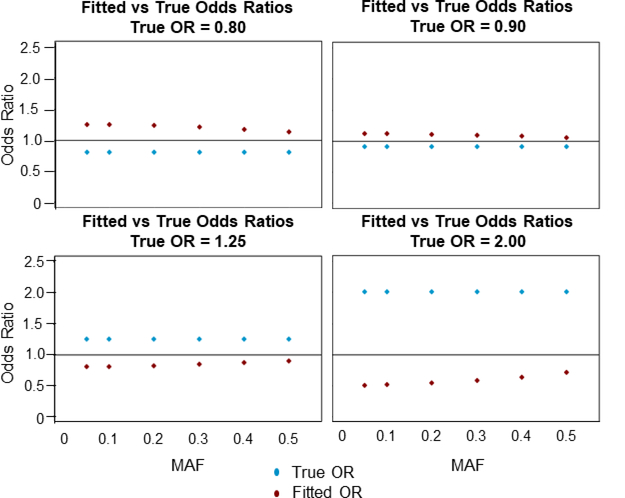
Genetic matching between transplant donor and recipient pairs has traditionally focused on the human leukocyte antigen (HLA) regions of the genome, but recent studies suggest that matching for non-HLA regions may be important as well. We assess four genetic matching scores for use in association analyses of transplant outcomes. These scores describe genetic ancestry distance using identity-by-state, or genetic incompatibility or mismatch of the two genomes and therefore may reflect different underlying biological mechanisms for donor and recipient genes to influence transplant outcomes. Our simulation studies show that jointly testing these scores with the recipient genotype is a powerful method for preliminary screening and discovery of transplant outcome related single nucleotide polymorphisms (SNPs) and gene regions. Following these joint tests with marginal testing of the recipient genotype and matching score separately can lead to further understanding of the biological mechanisms behind transplant outcomes. In addition, we present results of a liver transplant data analysis that shows joint testing can detect SNPs significantly associated with acute rejection in liver transplant.

Keywords: genetic matching scores; joint testing; transplant genetics.


Conflict of interest statement

Conflict of Interests

The authors declare that there are no conflicts of interest.

Figures

Figure 1:
Figure 1:
Expected probabilities of different score values for the IBS Mismatch Score (SIBS), the incompatibility Score (SIncomp), the Allogenomics Mismatch Score (SAMS) and the binary mismatch score (SMM) under different minor allele frequencies.
Figure 2:
Figure 2:
Minor allele frequency (MAF) versus true and fitted odds ratios (OR) calculated using the empirical equation ORFit=ORTrue+1MAF2MAF2(1MAF2MAF2)ORTrue+1. The horizontal line corresponds to an OR of 1.00. The blue points correspond to the true OR and the red points correspond to the fitted OR.
Figure 3:
Figure 3:
Plots of estimated statistical power versus SNP minor allele frequency for joint modeling both the recipient genotype and the IBS mismatch score. Results are shown for a true odds ratio of 1.45 and an outcome prevalence of 15%. From left to right, the true model is that IBS mismatch score is associated with the outcome and that recipient genotype is associated with the outcome.
Figure 4:
Figure 4:
Plots of estimated statistical power versus SNP minor allele frequency for joint modeling both the recipient genotype and each of the four scores. Results are shown for a true odds ratio of 1.45 and an incidence of outcome of 15%. From top to bottom, and left to right, the true models are that IBS mismatch score is associated with the outcome, that incompatibility score is associated with the outcome, that the Allogenomics Mismatch Score (AMS) is associated with the outcome, and that binary mismatch score is associated with outcome.
Figure 5:
Figure 5:
Estimated power level versus SNP MAF for power analyses. Results shown are for an incidence of outcome of 15% and a true odds ratio value of 1.45. For each plot, a different single SNP covariate value was used to generate the true phenotype values. From top to bottom, and left to right, the covariate used to generate phenotypes is recipient genotype, IBS mismatch score, incompatibility score, Allogenomics Mismatch Score (AMS), and binary mismatch score.

References

    1. Ajuebor MN, Carey JA, & Swain MG (2006). CCR5 in T cell-mediated liver diseases: what’s going on?. The Journal of Immunology, 177(4), 2039–2045. 10.4049/jimmunol.177.4.2039 - DOI - PubMed
    1. Almoguera B, Shaked A, & Keating BJ (2014). Transplantation genetics: current status and prospects. American Journal of Transplantation, 14(4), 764–778. 10.1111/ajt.12653 - DOI - PubMed
    1. Barrett JC, Fry B, Maller J, & Daly MJ (2004). Haploview: analysis and visualization of LD and haplotype maps. Bioinformatics, 21(2), 263–265. 10.1093/bioinformatics/bth457 - DOI - PubMed
    1. Choudhary NS, Saigal S, Bansal RK, Saraf N, Gautam D, & Soin AS (2017). Acute and chronic rejection after liver transplantation: what a clinician needs to know. Journal of Clinical and Experimental Hepatology, 7(4), 358–366. 10.1016/j.jceh.2017.10.003 - DOI - PMC - PubMed
    1. Dai JY, Kooperberg C, Leblanc M, & Prentice RL (2012). Two-stage testing procedures with independent filtering for genome-wide gene-environment interaction. Biometrika, 99(4), 929–944. 10.1093/biomet/ass044 - DOI - PMC - PubMed

Publication types