. 2020 Sep 17;182(6):1560-1573.e13.
doi: 10.1016/j.cell.2020.07.033. Epub 2020 Jul 28.

Structural Basis for Helicase-Polymerase Coupling in the SARS-CoV-2 Replication-Transcription Complex

Affiliations

Structural Basis for Helicase-Polymerase Coupling in the SARS-CoV-2 Replication-Transcription Complex

James Chen et al. Cell. .

Abstract

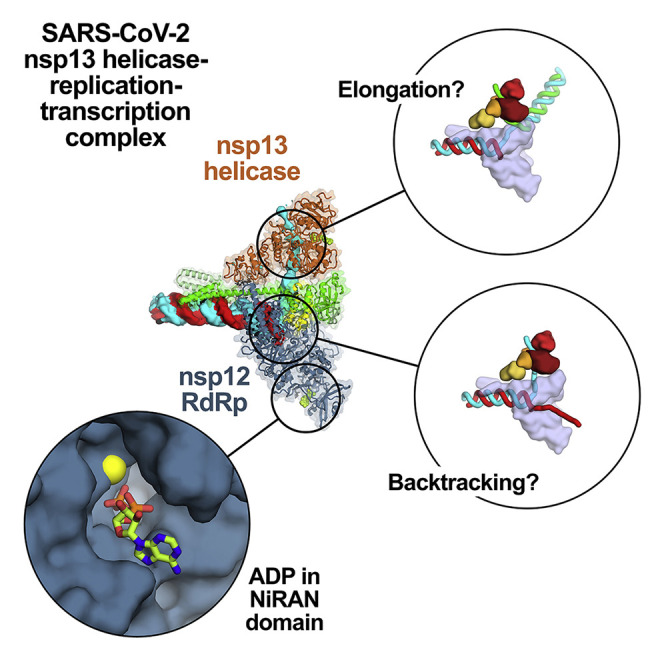
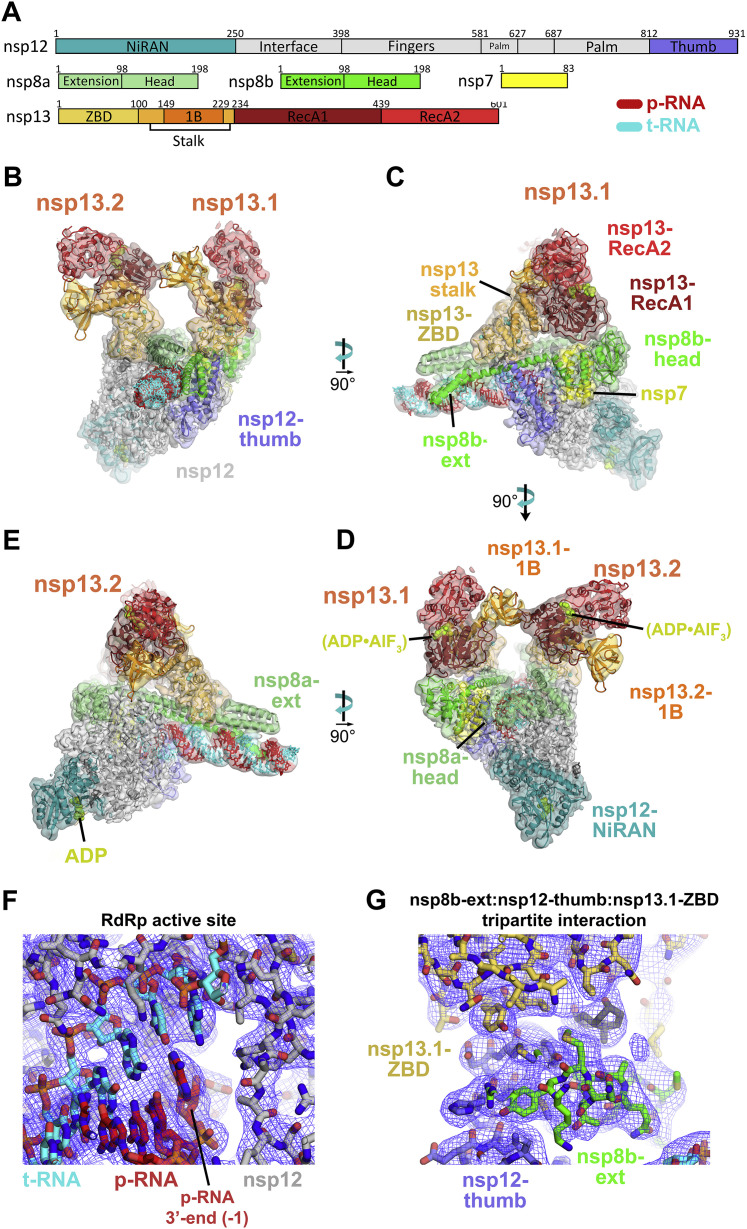
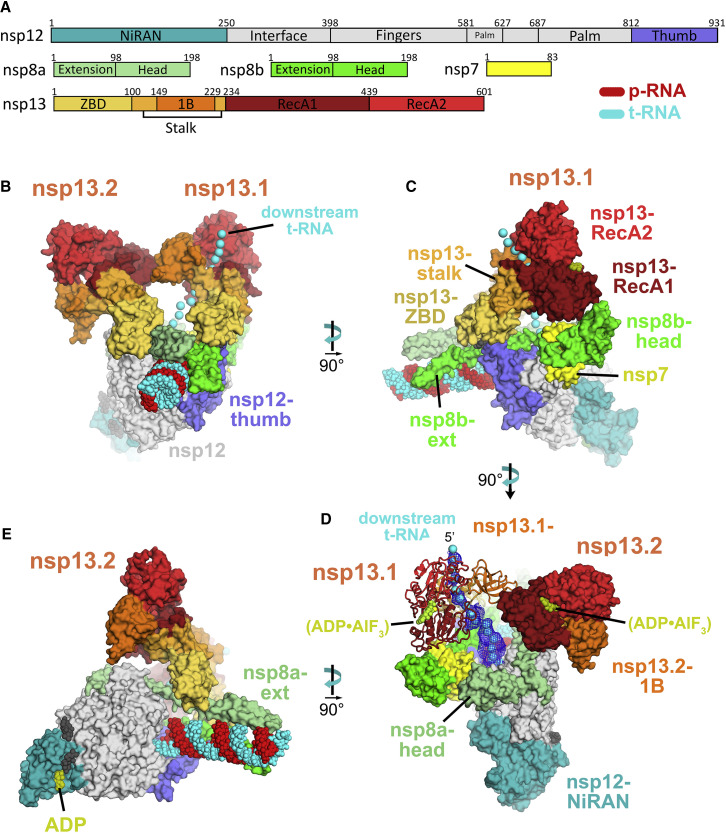
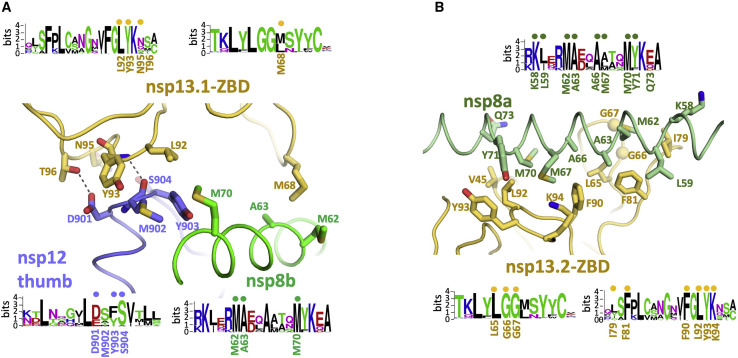
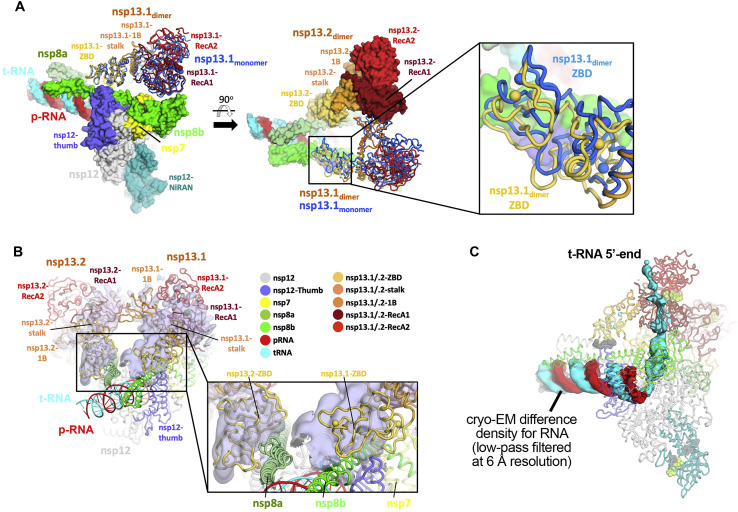
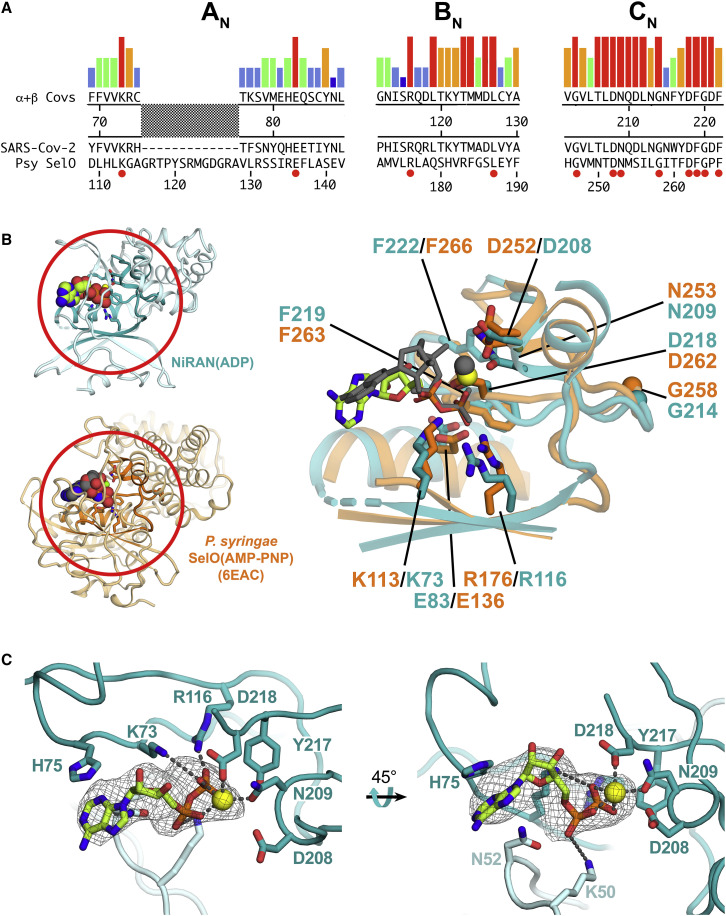
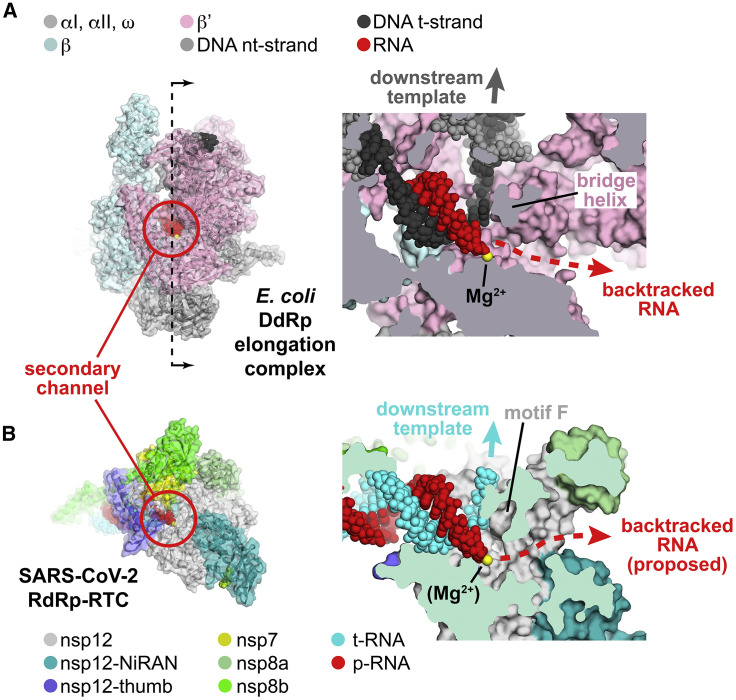
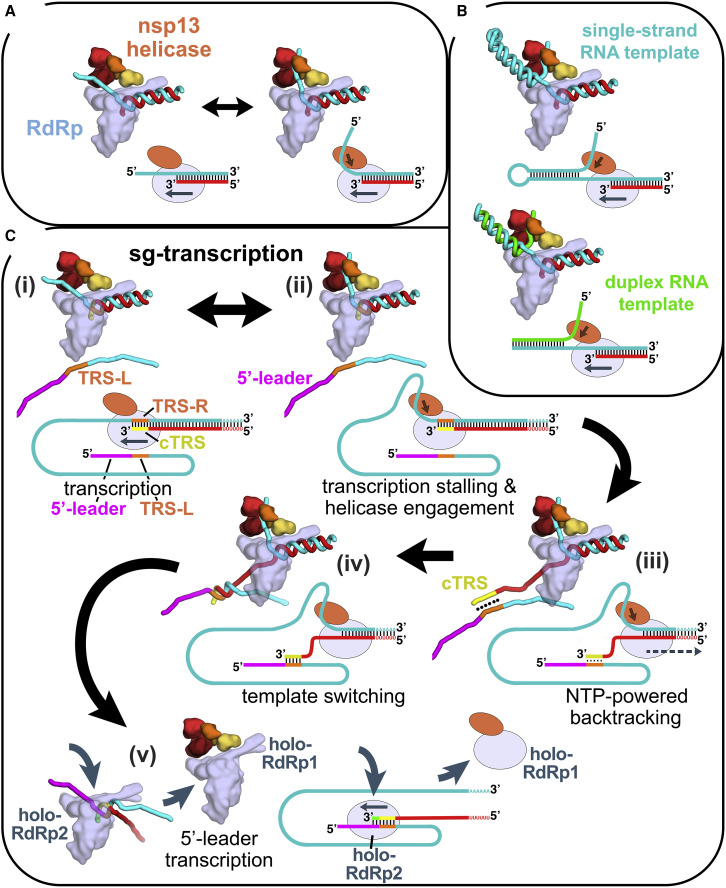
SARS-CoV-2 is the causative agent of the 2019-2020 pandemic. The SARS-CoV-2 genome is replicated and transcribed by the RNA-dependent RNA polymerase holoenzyme (subunits nsp7/nsp82/nsp12) along with a cast of accessory factors. One of these factors is the nsp13 helicase. Both the holo-RdRp and nsp13 are essential for viral replication and are targets for treating the disease COVID-19. Here we present cryoelectron microscopic structures of the SARS-CoV-2 holo-RdRp with an RNA template product in complex with two molecules of the nsp13 helicase. The Nidovirales order-specific N-terminal domains of each nsp13 interact with the N-terminal extension of each copy of nsp8. One nsp13 also contacts the nsp12 thumb. The structure places the nucleic acid-binding ATPase domains of the helicase directly in front of the replicating-transcribing holo-RdRp, constraining models for nsp13 function. We also observe ADP-Mg2+ bound in the nsp12 N-terminal nidovirus RdRp-associated nucleotidyltransferase domain, detailing a new pocket for anti-viral therapy development.


Conflict of interest statement

Declaration of Interests The authors declare no competing interests.

Figures

None
Graphical abstract
Figure S1
Figure S1
Purification and Assembly of nsp13 and the RTC, Related to Figure 1 A. (left) SDS-PAGE of purified SARS-CoV-2 nsp7/8, nsp12, and nsp13. (right) Size exclusion chromatography profiles for the purified nsp7/8, nsp12, and nsp13. Nsp7/8 are known to form high molecular weight complexes (Xiao et al., 2012; Zhai et al., 2005), which we observed in equilibrium with the 31 kDa nsp7/nsp8 heterodimer. For assembly of the holo-RdRp, we isolated the peak corresponding to the 31 kDa heterodimer. B. Purification of RTC by size exclusion chromatography. (left) Chromatogram of RTC (blue trace) and individual components (gray trace) labeled. C. Holo-RdRp elongates the primer-strand of the RNA scaffold shown in the presence of NTPs. Original primer (20-mer, dark red), 27-mer AU elongated product (red), 32-mer AUC product (pink), 40-mer AUCG product (orange) and the product of nsp8-mediated TATAse activity (yellow; Tvarogová et al., 2019). Products, taken at a 30-minute time point, are shown for a representative gel (n = 2) and are visualized alongside Decade RNA ladder (Invitrogen).
Figure S2
Figure S2
Nsp13 Activities, Related to Figure 1 A. (left) ATPase assay comparing nsp13 alone, nsp13 + holo-RdRp (nsp12/7/8), nsp13 + RNA scaffold alone, nsp13-RTC (nsp13/12/7/8 + RNA), and the RTC alone (nsp12/7/8 + RNA). Error bars indicate the range for two independent measurements. (right) Calculated Kcat and Km values for the ATPase assay. B. (left) ATPase assay comparing nsp13 alone and nsp13-RTC (nsp13/12/7/8 + RNA) ± 8 mM CHAPSO. Error bars indicate the range for two independent measurements. (right) Calculated Kcat and Km values for the ATPase assay. C. Inhibitory effect of ADP-AlF3 on nsp13 ATPase activity (N = 6). Error bars denote standard deviation.
Figure 1
Figure 1
SARS-CoV-2 nsp13 Helicase Forms a Stable Complex with the Holo-RdRp and an RNA Scaffold (A) The RNA scaffold used for biochemistry, native mass spectrometry (nMS), and cryo-EM. (B) A native gel electrophoretic mobility shift assay reveals that nsp13 forms a stable complex with holo-RdRp:RNA. The 4.5% polyacrylamide gel was visualized with Gel Red to stain the RNA. (C) nMS spectra and the corresponding deconvolved spectra for the holo-RdRp containing the RNA scaffold (A) with and without nsp13. The measured mass for the holo-RdRp:RNA complex corroborates the established stoichiometry of 1:2:1:1 for nsp7:nsp8:nsp12:RNA (Hillen et al., 2020; Kirchdoerfer and Ward, 2019; Wang et al., 2020; Yin et al., 2020), respectively (bottom). Addition of the 67.5-kDa nsp13 helicase to the RNA-bound holo-RdRp sample forms a transcription complex/helicase assembly with 1:1 stoichiometry (top). See also Figures S1 and S2.
Figure S3
Figure S3
Cryo-EM Processing Pipeline and Analysis for the nsp13-RTC (No Detergent) Dataset, Related to Figure 2 A. Cryo-EM processing pipeline. B. Nominal 3.6 Å-resolution cryo-EM reconstruction of nsp132-RTC (no detergent) filtered by local resolution (Cardone et al., 2013) and colored by subunit according to the key on the right. C. Directional 3D Fourier shell correlation (FSC) for nsp132-RTC (no detergent) calculated by 3DFSC (Tan et al., 2017). D. Angular distribution plot for reported nsp132-RTC (no detergent) calculated in cryoSPARC. Scale shows the number of particles assigned to a particular angular bin. Blue, a low number of particles; red, a high number of particles.
Figure S4
Figure S4
Cryo-EM Processing Pipeline and Analysis for the nsp13-RTC (CHAPSO) Dataset, Related to Figure 2 A. Cryo-EM processing pipeline. B. Nominal 3.5 Å-resolution cryo-EM reconstruction of nsp132-RTC (CHAPSO) filtered by local resolution (Cardone et al., 2013). The view on the right is a cross-section. (top) Colored by subunit. (bottom) Color by local resolution (key on the bottom). C. Directional 3D Fourier shell correlation (FSC) for nsp132-RTC (CHAPSO) calculated by 3DFSC (Tan et al., 2017). D. Angular distribution plot for reported nsp132-RTC (CHAPSO) calculated in cryoSPARC. Scale shows the number of particles assigned to a particular angular bin. Blue, a low number of particles; red, a high number of particles. E. Gold-standard FSC plot for nsp132-RTC (CHAPSO), calculated by comparing two independently determined half-maps from cryoSPARC. The dotted line represents the 0.143 FSC cutoff which indicates a nominal resolution of 3.5 Å. F. FSC calculated between the refined structure and the half map used for refinement (work, red), the other half map (free, blue), and the full map (black).
Figure S5
Figure S5
Cryo-EM Density Maps, Related to Figure 2 A. Schematic illustrating domain structure of SARS-CoV-2 holo-RdRp (nsp7, nsp8, nsp12) and nsp13. The color-coding corresponds to the figures throughout this manuscript unless otherwise specified. B-E. Orthogonal views showing the overall architecture of the nsp132-RTC. Shown is the transparent cryo-EM density (local-resolution filtered) with the nsp132-RTC model superimposed. Same views as Figures 2B–2E. F. View of the nsp12 (RdRp) active site (refined model superimposed onto the cryo-EM density, shown as blue mesh), showing the post-translocated state of the RNA. G. View of the nsp8b-extension:nsp12-thumb:nsp13-ZBD tripartite interaction (refined model superimposed onto the cryo-EM density, shown as blue mesh). Similar view as Figure 3A.
Figure 2
Figure 2
Overall Structure of the SARS-CoV2 nsp13 Helicase with the Holo-RdRp:RNA Replication-Transcription Complex (RTC) (A) Schematic illustrating the domain structure of SARS-CoV-2 holo-RdRp (nsp7, nsp8, and nsp12) and nsp13. Structural domains discussed in the text are labeled. The color coding corresponds to the figures throughout this manuscript unless otherwise specified. (B–E) Orthogonal views showing the overall architecture of the nsp132-RTC. Proteins are shown as molecular surfaces (except nsp13.1 in D) and RNA as atomic spheres. Adventitious CHAPSO detergent molecules are shown as atomic spheres and colored dark gray. The path of downstream tRNA through the nsp13.1 helicase, shown as cyan spheres, is revealed with low-pass-filtered (6 Å) difference density (shown in D). (B) Two copies of the nsp13 helicase bind to the RTC. Nsp13.1 forms a tripartite interaction with the nsp8b extension and the nsp12 thumb via the nsp13.1-ZBD. The 5′ end of the tRNA extrudes through the nucleic acid binding channel of nsp13.1. The two helicases interact via the nsp13.1-1B domain and the nsp13.2-RecA1 domain. (C) In addition to the nsp13.1-ZBD:nsp8b extension:nsp12 thumb tripartite interaction, nsp13.1-RecA1 interacts with nsp7 and the nsp8b head. (D) ADP-AlF3 is modeled in the NTP binding site of each helicase. The low-pass-filtered (6 Å) cryo-EM difference density revealing the path of the downstream t-RNA is shown (dark blue mesh). (E) The nsp13.2-ZBD interacts with the nsp8a extension. ADP-Mg2+ is bound to the NiRAN domain. See also Figure S3, Figure S4, Figure S5, Figure S6, Table S1, and Video S1.
Figure 3
Figure 3
Interactions of the nsp13-ZBDs with the RTC (A and B) Views of the nsp13-ZBD:RTC interactions. Proteins are shown as α-carbon backbone worms. Side chains that make protein:protein interactions are shown. Polar interactions are shown as dashed gray lines. Sequence logos (Schneider and Stephens, 1990) from alignments of α- and β-CoV clades for the interacting regions are shown. The residues involved in protein:protein interactions are labeled under the logos. Dots above the logos denote conserved interacting residues. (A) View of the tripartite nsp13.1-ZBD:nsp8b extension:nsp12 thumb interaction. The adventitiously bound CHAPSO molecule is shown in dark gray. (B) View of the nsp13.2-ZBD:nsp8a extension interaction. See also Figure S6 and Data S1 and S2.
Figure S6
Figure S6
Comparison of the nsp132-RTC (CHAPSO) Structure with nsp131-RTC (CHAPSO) and nsp132-RTC (No Detergent), Related to Figures 2 and 3 A. Structure of nsp132-RTC (CHAPSO) colored according to key in b and shown as a molecular surface except nsp13.1, which is shown as cartoon tubes. Superimposed on the overall structure is nsp13 (marine) modeled from the nsp131-RTC (CHAPSO). Overall RMSD (calculated using ‘rms_cur’ in PyMOL) between the two nsp13.1 structures is 8.1 Å over 596 Cα atoms. (left) overall structure. (middle) overall structure rotated 90°. (right) zoom-in of boxed region in middle panel, showing region around nsp13.1-ZBD.s RMSD (calculated using ‘rms_cur’ in PyMOL) between the two nsp13.1 ZBDs is 3.6 Å over 100 Cα atoms. B. Structure of nsp132-RTC (CHAPSO) is shown in cartoon tubes, colored based on key, and superimposed onto the cryo-EM map from the nsp132-RTC (no detergent) dataset (shown as light blue transparent surface). Density map is locally filtered by resolution and difference density for nsp13 is highlighted using ‘isosurf’ command in PyMOL with 10 Å carve buffer. (left) overall structure. (right) zoom-in of boxed region in left panel, showing region around nsp13-ZBDs. C. Structure of nsp132-RTC (CHAPSO) colored according to key in (b), the view is similar to the view of Figure S6A(left). Protein is shown as pale, transparent backbone worms. The surface shows a cryo-EM different density for the RNA (t-RNA, cyan; p-RNA, red) low-pass filtered to 6 Å resolution. The difference map was generated by calculating a map from the nsp132-RTC coordinates with the RNA removed using the molmap command in Chimera (Pettersen et al., 2004), subtracting this map from the experimental map (Chimera vop command), then low-pass filtering this difference map at 6 Å resolution).
Figure 4
Figure 4
The SARS-CoV-2 nsp12-NiRAN Domain, Pseudokinase SelO, and ADP Binding (A) The colored histograms denote identity in a sequence alignment of 45 α- and β-CoV nsp12 sequences (red bar, 100% identity; dark blue bar, 20% or less) in the N-terminal signature motifs AN, BN, and CN (Lehmann et al., 2015a) of the NiRAN domain. The consensus sequence is shown below. The SARS-CoV-2 nsp12 and the pseudokinase P. syringae (Psy) SelO (Sreelatha et al., 2018) are aligned below. Residues that are 100% identical in the nsp12 alignment and conserved in SelO are highlighted by a red dot underneath. (B) Left: structures of the SARS-CoV-2 NiRAN domain (cyan ribbon) with ADP-Mg2+ (spheres) and Psy SelO (orange) with AMP-PNP-Mg2+ (PDB: 6EAC; Sreelatha et al., 2018). The AN, BN, and CN regions are highlighted. Right: structure-based alignment via α-carbons of the AN, BN, and CN regions, with side chains of conserved residues shown. The α- and β-phosphates of the NiRAN domain ADP-Mg2+ (lime carbon atoms and yellow sphere, respectively) superimpose almost exactly with the β- and γ-phosphates of the SelO AMP-PNP-Mg2+ (dark gray), whereas the nucleoside moieties diverge. (C) Two views of the ADP-Mg2+-bound pocket of the SARS-CoV-2 NiRAN domain. Side chains interacting with the ADP-Mg2+ are shown (polar interactions are denoted by gray dashed lines). D208 likely makes a water-mediated interaction with Mg2+ (Sreelatha et al., 2018). The cryo-EM difference density for ADP-Mg2+ is shown (light gray mesh). See also Data S3.
Figure 5
Figure 5
Correspondence of Structural Determinants for Backtracking between Cellular Multi-subunit DdRp and SARS-CoV-2 RdRp (A and B) Left: overall views of complexes. Proteins are shown as cartoon ribbons with transparent molecular surfaces. Nucleic acids are shown as atomic spheres. Color coding is shown in the keys. Right: cross-sectional view of the active site region (at the 3′ end of the RNA product). (A) Left: structure of the E. coli DdRp transcription elongation complex (EC; Kang et al., 2017), viewed down the secondary channel. The DdRp active-site Mg2+-ion is shown as a yellow sphere. The secondary channel is highlighted in the red circle. The thin dashed line illustrated the cut and viewing direction of the cross-section on the right. Right: cross-sectional view showing the RNA/DNA hybrid. The bridge helix (viewed end-on in the cross-section) is denoted. The bridge helix directs the downstream template duplex DNA to the top (dark gray arrow). Under the bridge helix, the secondary channel allows NTP substrates to diffuse into the active site (Westover et al., 2004; Zhang et al., 1999) and accommodates the single-strand RNA transcript 3′ end in backtracked complexes (Abdelkareem et al., 2019; Cheung and Cramer, 2011; Wang et al., 2009). (B) Left: view down the newly described secondary channel of the SARS-CoV-2 holo-RdRp. The secondary channel is highlighted in the red circle. Right: cross-sectional view showing the t-RNA/p-RNA hybrid. Motif F (viewed end-on in the cross-section) is denoted. Motif F directs the downstream t-RNA to the top (cyan arrow). Under motif F, the secondary channel could accommodate the single-strand p-RNA 3′ end in the event of backtracking.
Figure 6
Figure 6
Structural Basis for Possible nsp13 Helicase Functions during Viral Genome Replication-Transcription Structural models are shown as cartoons (holo-RdRp, light blue; nsp13.1 helicase, orange shades; RNA strands, colored tubes). The nsp13.2 helicase is not shown for clarity (all models are compatible with the presence of nsp13.2). With each structural diagram is a schematic cartoon illustrating the arrangement of RNA strands. Additional proteins involved in these processes are omitted. The product RNA (p-RNA) being elongated by the RdRp is shown in red. (A) The SARS-CoV-2 nsp13-RdRp cryo-EM structure likely represents an equilibrium between two states. (B) During RNA synthesis on a single-stranded RNA template (cyan), nsp13 could function distributively to clear downstream RNA secondary structure (or RNA binding proteins). Similarly, on a duplex RNA template (cyan and green), nsp13 could processively unwind downstream duplex RNA. (C) Proposed helicase function during template switching associated with sub-genomic transcription (sg-transcription) (Enjuanes et al., 2006; Lehmann et al., 2015b; Pasternak et al., 2001; Snijder et al., 2016; Sola et al., 2015). (i) Negative-strand RNA synthesis proceeds from the genomic 3′ poly(A)-tail until a transcription-regulating sequence (TRS-R, orange) (Alonso et al., 2002) is transcribed (cTRS, yellow). (ii) The TRS causes transcription complex stalling. (iii) Helicase function acting on the + strand RNA (cyan) causes backtracking of the transcription complex, freeing the pRNA 3′ end. (iv) The p-RNA 3′-end cTRS (yellow) hybridizes with the complementary TRS-L (orange) following the genomic 5′ leader sequence (magenta) (Alonso et al., 2002; Pasternak et al., 2001; Zúñiga et al., 2004). (v) Processive helicase function backtracks the RdRp complex and unwinds the p-RNA from the genomic 3′ end. A second RdRp complex (holo-RdRp2) can load into the p-RNA 3′ end and continue transcription using the 5′ leader as a template.

Update of

Similar articles

Cited by

References

    1. Abdelkareem M., Saint-André C., Takacs M., Papai G., Crucifix C., Guo X., Ortiz J., Weixlbaumer A. Structural Basis of Transcription: RNA Polymerase Backtracking and Its Reactivation. Mol. Cell. 2019;75:298–309.e4. - PMC - PubMed
    1. Adams P.D., Afonine P.V., Bunkóczi G., Chen V.B., Davis I.W., Echols N., Headd J.J., Hung L.-W., Kapral G.J., Grosse-Kunstleve R.W. PHENIX: a comprehensive Python-based system for macromolecular structure solution. Acta Crystallogr. D Biol. Crystallogr. 2010;66:213–221. - PMC - PubMed
    1. Adedeji A.O., Marchand B., Te Velthuis A.J.W., Snijder E.J., Weiss S., Eoff R.L., Singh K., Sarafianos S.G. Mechanism of nucleic acid unwinding by SARS-CoV helicase. PLoS ONE. 2012;7:e36521. - PMC - PubMed
    1. Afonine P.V., Klaholz B.P., Moriarty N.W., Poon B.K., Sobolev O.V., Terwilliger T.C., Adams P.D., Urzhumtsev A. New tools for the analysis and validation of cryo-EM maps and atomic models. Acta Crystallogr. D Struct. Biol. 2018;74:814–840. - PMC - PubMed
    1. Agostini M.L., Andres E.L., Sims A.C., Graham R.L., Sheahan T.P., Lu X., Smith E.C., Case J.B., Feng J.Y., Jordan R. Coronavirus Susceptibility to the Antiviral Remdesivir (GS-5734) Is Mediated by the Viral Polymerase and the Proofreading Exoribonuclease. MBio. 2018;9 e00221–e18. - PMC - PubMed

Publication types

MeSH terms