. 2020 Aug 20;182(4):886-900.e17.
doi: 10.1016/j.cell.2020.07.013. Epub 2020 Aug 11.

TREM2 Modulation Remodels the Tumor Myeloid Landscape Enhancing Anti-PD-1 Immunotherapy

Affiliations

TREM2 Modulation Remodels the Tumor Myeloid Landscape Enhancing Anti-PD-1 Immunotherapy

Martina Molgora et al. Cell. .

Abstract

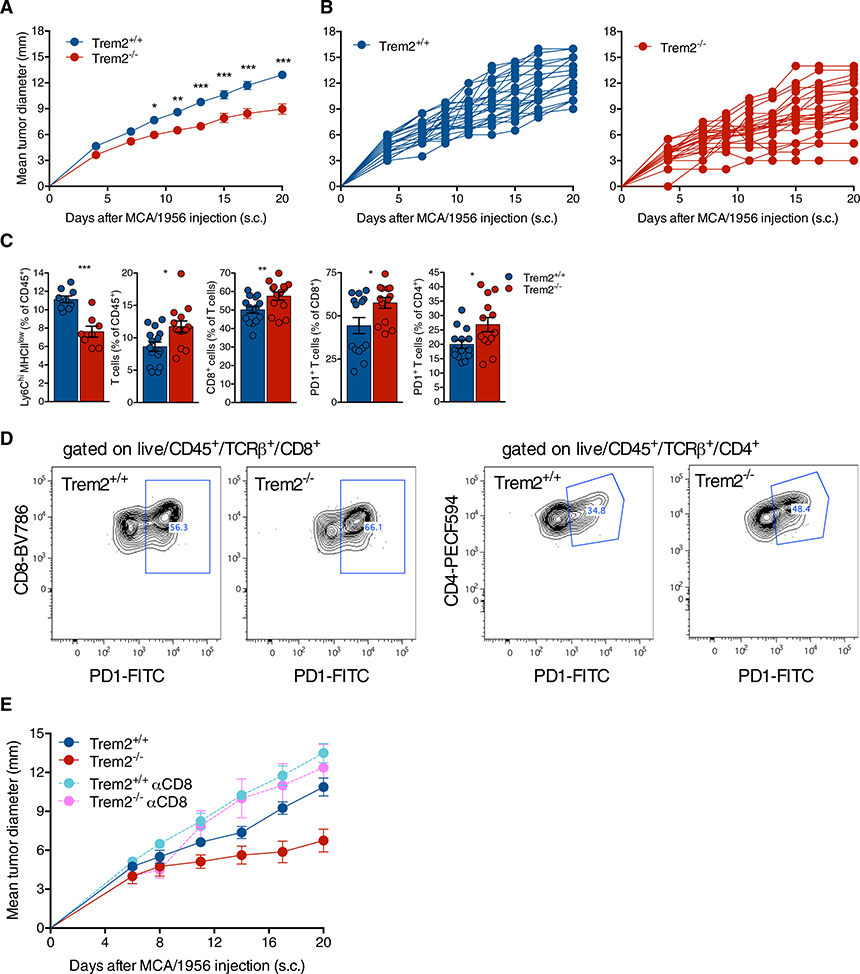
Checkpoint immunotherapy unleashes T cell control of tumors, but is undermined by immunosuppressive myeloid cells. TREM2 is a myeloid receptor that transmits intracellular signals that sustain microglial responses during Alzheimer's disease. TREM2 is also expressed by tumor-infiltrating macrophages. Here, we found that Trem2-/- mice are more resistant to growth of various cancers than wild-type mice and are more responsive to anti-PD-1 immunotherapy. Furthermore, treatment with anti-TREM2 mAb curbed tumor growth and fostered regression when combined with anti-PD-1. scRNA-seq revealed that both TREM2 deletion and anti-TREM2 are associated with scant MRC1+ and CX3CR1+ macrophages in the tumor infiltrate, paralleled by expansion of myeloid subsets expressing immunostimulatory molecules that promote improved T cell responses. TREM2 was expressed in tumor macrophages in over 200 human cancer cases and inversely correlated with prolonged survival for two types of cancer. Thus, TREM2 might be targeted to modify tumor myeloid infiltrates and augment checkpoint immunotherapy.

Keywords: TREM2; breast cancer; checkpoint blockade; colorectal cancer; human; macrophages; sarcoma; tumor.


Conflict of interest statement

Declaration of Interests M. Colonna received research support from Alector, Amgen, Ono, and Pfizer for activities not related to the findings described in this publication. M. Colonna is a scientific advisory board member of Alector, Cell Signaling Technologies, and Bluefin, and has a patent to TREM2 pending. R.D.S. is a cofounder, scientific advisory board member, stockholder, and royalty recipient of Jounce Therapeutics and Neon Therapeutics and is a scientific advisory board member for A2 Biotherapeutics, BioLegend, Codiak Biosciences, Constellation Pharmaceuticals, NGM Biopharmaceuticals, and Sensei Biotherapeutics.

Figures

Figure 1.
Figure 1.. TREM2 Deficiency Attenuates Growth of Transplantable Tumors
(A and B) Tumor growth in Trem2+/+ and Trem2−/− mice injected subcutaneously (s.c.) with MCA/1956. (C) Flow cytometry analysis of the immune infiltrate of MCA/1956 tumors 10 days after injection. (D) Representative flow plots of PD-1 expression in CD8 (left panels) and CD4 (right panels) T cells. (E) Tumor growth of MCA/1956 in Trem2+/+ and Trem2−/− after depletion of CD8 T cells. Growth curves of groups (A and E) and single mice (B) are shown. **: Trem2+/+ versus Trem2−/−; *** Trem2−/− versus Trem2+/+ αCD8; *** Trem2−/− versus Trem2−/− αCD8; ns: Trem2+/+ versus Trem2+/+ αCD8; Trem2+/+ versus Trem2−/− αCD8; Trem2+/+ αCD8 versus Trem2−/− αCD8 (day 20). Data represent mean ± SEM. *p ≤ 0.05, **p ≤ 0.01, ***p ≤ 0.001. Two-way Anova with multiple comparisons (A and E) and Mann-Whitney test (C). See also Figure S1.
Figure 2.
Figure 2.. TREM2 Deficiency Remodels the Myeloid Compartment in MCA-Derived Sarcoma
(A) UMAP plots of myeloid clusters from merged conditions. (B) Cluster proportions in each condition: Trem2+/+ and Trem2−/−. Cluster identities were based on expression of key marker shown below. (C) UMAP plots of selected cluster markers from merged conditions. (D) UMAP plots of myeloid clusters in each condition. (E) Violin plots of TREM2 expression level in each cluster. (F) TREM2 expression in each condition. (G) Heatmap showing normalized expression of selected genes in each myeloid cluster for each condition. Tumors from Trem2+/+ and Trem2−/− male mice were analyzed 10 days after injection. See also Figure S2.
Figure 3.
Figure 3.. TREM2 Deficiency Drives a Complex Remodeling of Macrophage Infiltrate that Partly Resembles that Observed Following ICT
Feature plots of selected genes in MCA/1956 sarcoma in Trem2+/+ and Trem2−/− mice (left panels) and in T3 sarcoma (Gubin et al., 2018) following ICT.
Figure 4.
Figure 4.. TREM2 Deficiency Enhances Anti-PD-1 Immunotherapy
(A) Experimental setup of the anti-PD-1 treatment. Optimal treatment started at day 3 (aPD-1-I); suboptimal treatment started at day 8 (aPD-1-II). (B–E) Tumor growth of MCA/1956 (B and C) and MC38 (D and E) in Trem2+/+ and Trem2−/− mice treated with anti-PD-1. (B) ***: Trem2+/+ aPD-1 versus Trem2−/− aPD-1 (day 20). (D) ***: Trem2+/+ aPD-1 versus Trem2−/− aPD-1 (day 20). (F) Flow cytometry analysis of lymphoid cells in Trem2+/+ and Trem2−/− mice treated with anti-PD-1 (day 14 after tumor injection). Growth curves of groups (A, B, and D) and single mice (C and E) are shown. Data represent mean ± SEM. *p ≤ 0.05, **p ≤ 0.01, ***p ≤ 0.001; Mann-Whitney test.
Figure 5.
Figure 5.. TREM2 Engagement Reduces MCA-Sarcoma Growth and Enhances Anti-PD-1-Induced Tumor Regression
(A and B) Tumor growth in mice injected s.c. with the MCA/1956 cell line treated with anti-TREM2 and anti-PD-1 antibodies. (A) *: αPD-1 versus αTREM2+αPD-1 (day 24). (C) Tumor growth of MCA/1956 tumors in Trem2+/+ and Trem2−/− mice treated with anti-TREM2. Anti-ILT1 was used as a control in both Trem2+/+ and Trem2−/− mice. **: CTRL versus CTRL Trem2−/−; ***: CTRL versus αTREM2; ns: CTRL Trem2−/− versus αTREM2 Trem2−/− (day 20). (D) Flow cytometry analysis of the myeloid immune compartment 10 days after tumor injection in mice treated with anti-TREM2. Control groups, mice treated with anti-TREM2, anti-PD-1, and the combination of anti-TREM2 and anti-PD-1 are shown. (E) IFNγ and TNFα production by CD8 and CD4 T cells stimulated ex vivo with PMA/I. Data represent mean ± SEM. *p ≤ 0.05, **p ≤ 0.01, ***p ≤ 0.001; Mann-Whitney test. Growth curves of groups (A and C) and single mice (B) are shown. See also Figure S3.
Figure 6.
Figure 6.. Anti-TREM2 Treatment Remodels the Myeloid Compartment in MCA-Derived Sarcoma
(A) UMAP plots of myeloid clusters from merged conditions. (B) Cluster proportions in each condition: controls (CTRL); mice treated with anti-PD-1 (αPD-1); mice treated with anti-TREM2 (αTREM2); mice treated with the combination of anti-PD-1 and anti-TREM2 (αTREM2 + αPD-1). Cluster identities were based on expression of key marker shown below. (C) TREM2 expression in myeloid clusters from merged conditions. (D) UMAP plots of myeloid clusters in each condition. (E) UMAP plots of selected cluster markers from merged conditions. (F) Heatmap showing normalized expression of selected genes in each myeloid cluster for each condition. Tumors from control and treated female mice were analyzed 10 days after injection. See also Figures S3 and S4.
Figure 7.
Figure 7.. TREM2 Expression in Human Cancers and Association with Prognosis in CRC and TNBC Patients
(A) IHC of tissue sections immunostained with anti-human TREM2 from primary carcinomas of skin (A), liver (B), lung (C), breast (D), bladder (E), colon (F), stomach (G), pancreas (H), and kidney (I), as well as from nodal lymphoma (J), cutaneous melanoma (K), and brain glioma (L). Sections are counterstained with hematoxylin. Magnification: 200×, scale bar: 100 μm. (B) Morphology and phenotype of TREM2+ tumor macrophages. Sections are form primary carcinomas and melanomas and stained as labeled. TREM2 reactivity decorates the cell membrane as observed in high-power view (A). TREM2+ tumor macrophages co-stain for CD163 (B), CD68 (C), nuclear MAFB (D), CSF1R (E), and the MITF transcription factor (F). Sections are counterstained with hematoxylin. Magnification: 600× (A, scale bar: 33 μm) and 200× (B–F, scale bar: 100 μm). (C and D) Kaplan-Meier survival curves generated for TREM2 expression. Patients were divided in high- and low- expressing groups based on 75% quantile of TREM2 expression. TCGA CRC (C) and TNBC (D) cohorts are shown. See also Figures S5, S6, and S7.

Comment in

References

    1. Allavena P, Chieppa M, Bianchi G, Solinas G, Fabbri M, Laskarin G, and Mantovani A (2010). Engagement of the mannose receptor by tumoral mucins activates an immune suppressive phenotype in human tumor-associated macrophages. Clin. Dev. Immunol. 2010, 547179. - PMC - PubMed
    1. Alspach E, Lussier DM, Miceli AP, Kizhvatov I, DuPage M, Luoma AM, Meng W, Lichti CF, Esaulova E, Vomund AN, et al. (2019). MHCII neoantigens shape tumour immunity and response to immunotherapy. Nature 574, 696–701. - PMC - PubMed
    1. Arlauckas SP, Garren SB, Garris CS, Kohler RH, Oh J, Pittet MJ, and Weissleder R (2018). Arg1 expression defines immunosuppressive subsets of tumor-associated macrophages. Theranostics 8, 5842–5854. - PMC - PubMed
    1. Barkal AA, Brewer RE, Markovic M, Kowarsky M, Barkal SA, Zaro BW, Krishnan V, Hatakeyama J, Dorigo O, Barkal LJ, and Weissman IL (2019). CD24 signalling through macrophage Siglec-10 is a target for cancer immunotherapy. Nature 572, 392–396. - PMC - PubMed
    1. Biswas SK, and Mantovani A (2012). Orchestration of metabolism by macrophages. Cell Metab. 15, 432–437. - PubMed

Publication types

MeSH terms