. 2020 Sep 15;53(3):685-696.e3.
doi: 10.1016/j.immuni.2020.07.009. Epub 2020 Jul 19.

Single-Cell Sequencing of Peripheral Mononuclear Cells Reveals Distinct Immune Response Landscapes of COVID-19 and Influenza Patients

Affiliations

Single-Cell Sequencing of Peripheral Mononuclear Cells Reveals Distinct Immune Response Landscapes of COVID-19 and Influenza Patients

Linnan Zhu et al. Immunity. .

Abstract

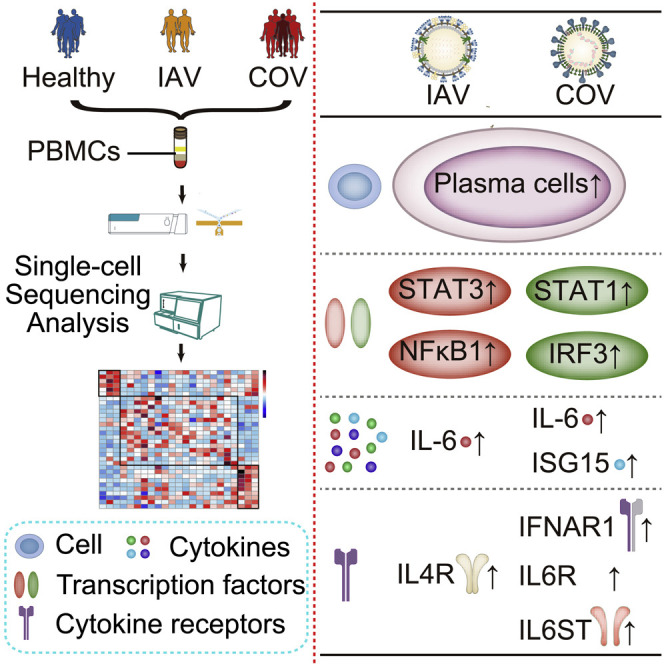
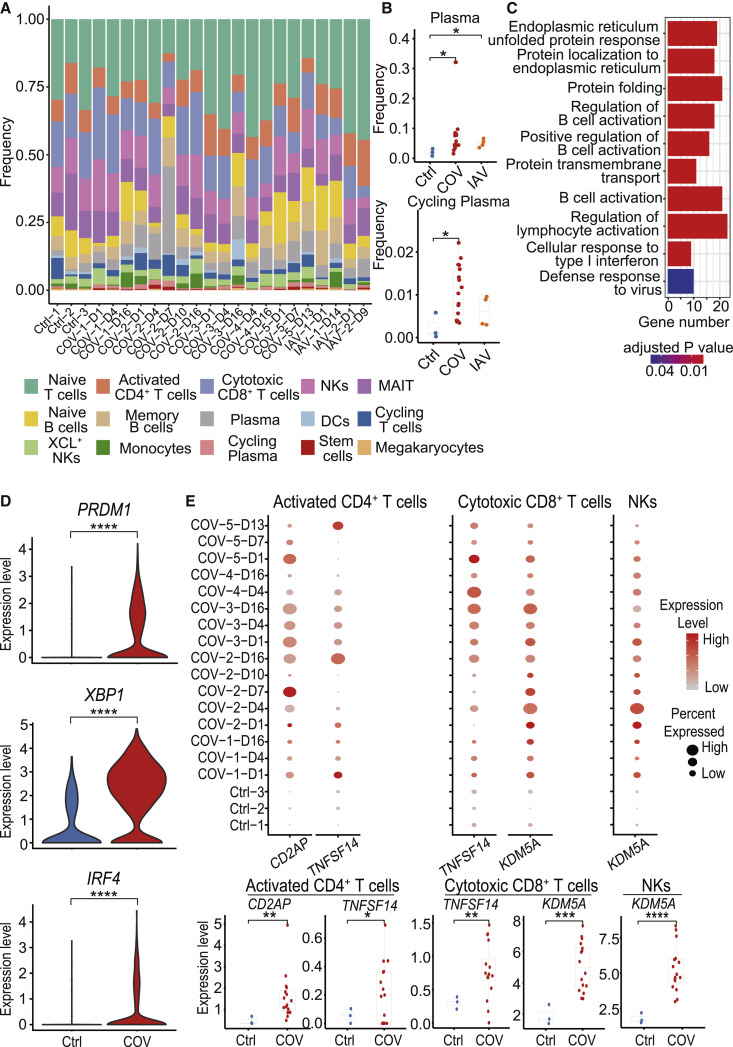
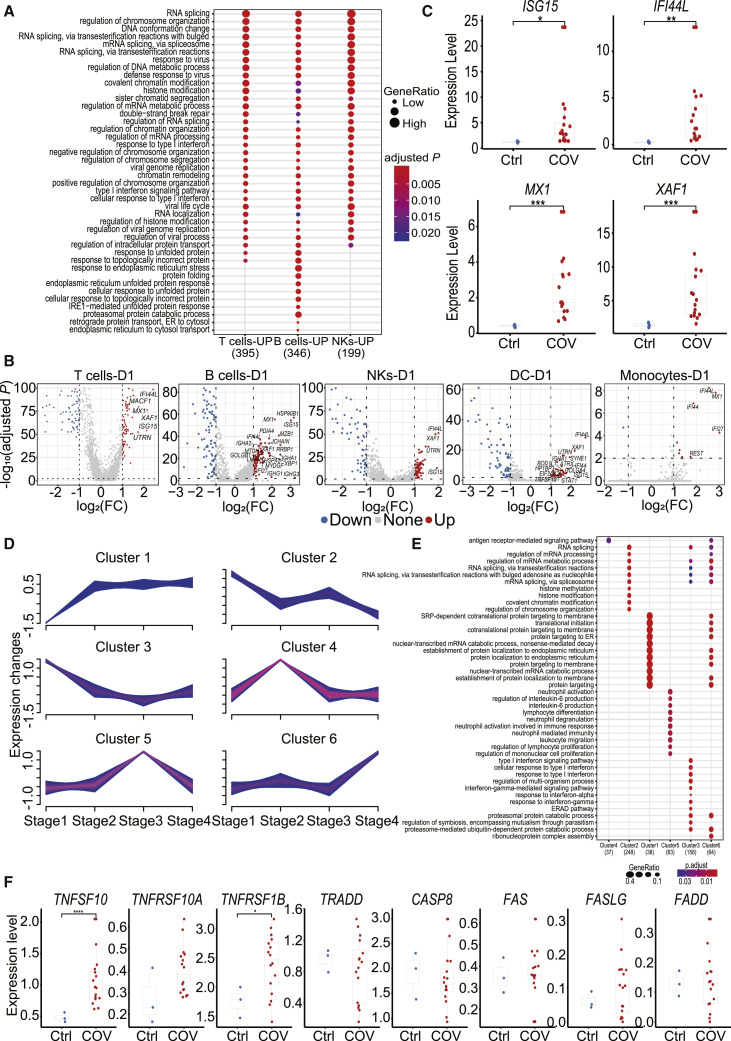
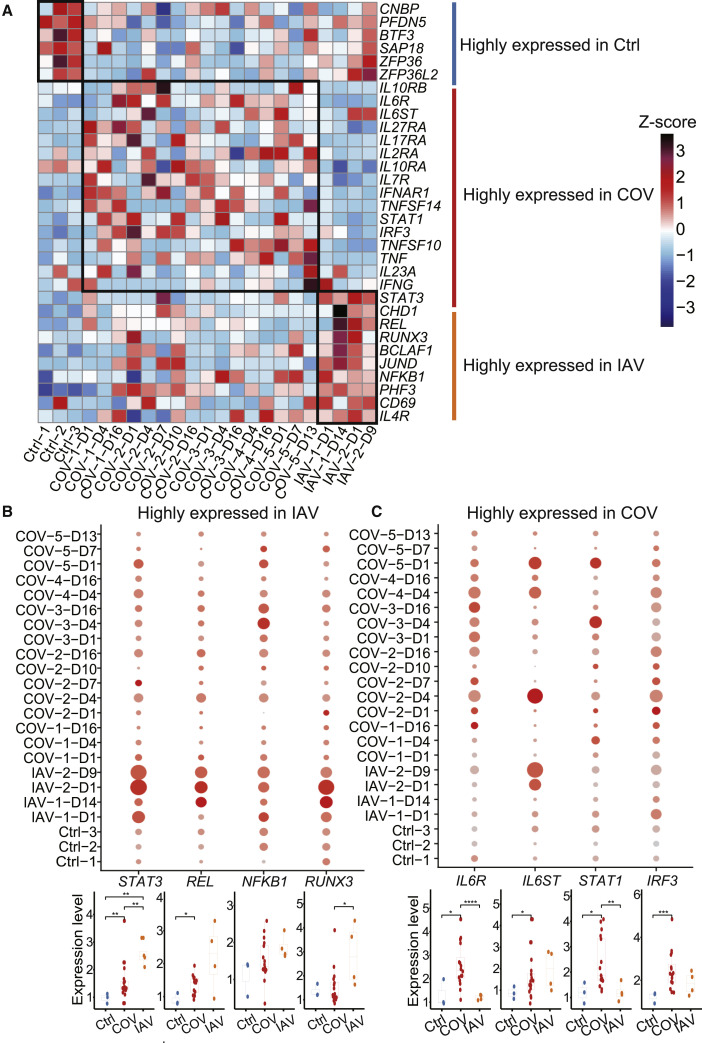
The coronavirus disease 2019 (COVID-19) pandemic poses a current world-wide public health threat. However, little is known about its hallmarks compared to other infectious diseases. Here, we report the single-cell transcriptional landscape of longitudinally collected peripheral blood mononuclear cells (PBMCs) in both COVID-19- and influenza A virus (IAV)-infected patients. We observed increase of plasma cells in both COVID-19 and IAV patients and XIAP associated factor 1 (XAF1)-, tumor necrosis factor (TNF)-, and FAS-induced T cell apoptosis in COVID-19 patients. Further analyses revealed distinct signaling pathways activated in COVID-19 (STAT1 and IRF3) versus IAV (STAT3 and NFκB) patients and substantial differences in the expression of key factors. These factors include relatively increase of interleukin (IL)6R and IL6ST expression in COVID-19 patients but similarly increased IL-6 concentrations compared to IAV patients, supporting the clinical observations of increased proinflammatory cytokines in COVID-19 patients. Thus, we provide the landscape of PBMCs and unveil distinct immune response pathways in COVID-19 and IAV patients.

Keywords: COVID-19; IL-6R; apoptosis; influenza; scRNA-seq.


Conflict of interest statement

Declaration of Interests Employees of BGI have stock holdings in BGI.

Figures

None
Graphical abstract
Figure 1
Figure 1
Single-Cell Gene Expression Profiling of Immune Cells Derived from PBMCs of the Participants (A) Schematic outline of the study design. 10 subjects, including three healthy donors, five COVID-19 patients, and two IAV-infected patients were included in this study. (B) Bar plot shows the log10 transformed cell number of each sample for every donor at different time points. Blue represents three healthy donors, orange represents two IAV-infected patients, and five COVID-19 patients are displayed using five different colors. (C) The clustering result of 46,022 cells from ten donors. Each point represents one single cell, colored according to cell type. Mega., Megakaryocytes. (D) Expression levels of cell typing genes in cell type clusters. CD3G indicates T cells, KLRF1 and XCL1 indicate NKs, MS4A1 indicates B cells, IGHG1 and MZB1 indicate plasma cells, CD68 indicates monocytes, LYZ indicates DCs, MKI67 and TOP2A indicate cycling T cells, GZMA indicates cytotoxic CD8+ T cells and NKs, and PPBP indicates megakaryocytes. See also Figure S1 and Table S1.
Figure 2
Figure 2
Dynamic Composition and Functional Changes in Immune Cells during SARS-CoV-2 Infection (A) The cell-type frequency in each sample. Bars are colored by cell types. (B) Differences in plasma and cycling plasma proportion among samples from healthy donors (Ctrl) (n = 3), COVID-19 patients (COV) (n = 16), and IAV patients (IAV) (n = 4). Student’s t test was applied to test the significance of the difference. p < 0.05, ∗∗p < 0.01, ∗∗∗p < 0.001. (C) Enriched GO terms for upregulated genes in COVID-19 patients compared to healthy controls in B cells. (D) The differential expression levels of B cell activation-related genes PRDM1, XBP1, and IRF4 between healthy donors (Ctrl) and COVID-19 patients (COV) in plasma cells. (E) The expression levels of T cell activation related genes in activated CD4+ T cells, cytotoxic CD8+ T cells, and NKs in samples from healthy donors and COVID-19 patients. In the upper panel, the color of each dot represents expression levels of the gene, while the dot size represents the fraction of cells expressing the gene in the specific cell type. In the lower panel, the difference between healthy donors (Ctrl) (n = 3) and COVID-19 patients (COV) (n = 16) were tested using the Student’s t test. p < 0.05, ∗∗p < 0.01, ∗∗∗p < 0.001. See also Figure S2 and Table S2.
Figure 3
Figure 3
Analysis of IFN Response- and Apoptosis-Associated Genes in COVID-19 Patients (A) The top 20 enriched biological processes by GO analysis in day 1 samples from COVID-19 patients compared to healthy controls in different cell populations. Dot color indicates the statistical significance of the enrichment (p), and dot size represents gene ratio annotated to each term. (B) The differentially expressed genes in day 1 samples from COVID-19 patients compared to healthy controls in different cell subsets. Red dots represent genes upregulated in COVID-19 patients (adjusted p < 0.01 and fold Change (FC) ≥ 2), while blue dots represent downregulated genes in COVID-19 patients (adjusted p < 0.01 and FC ≤ 0.5). Genes with log2(FC) ≥ 1.5 were labeled by gene symbols. (C) The gene expression of ISG15, IFI44L, MX1, and XAF1 in healthy donors (Ctrl) (n = 3) and COVID-19 patients (COV) (n = 16). Student’s t test was applied to test the significance of the difference. p < 0.05, ∗∗p < 0.01, ∗∗∗p < 0.001. (D) Genes clustered by their expression pattern along the progression of the disease by the mfuzz R package. (E) The top 10 enriched biological processes in each cluster of genes as revealed by GO analysis. (F) The difference in expression levels of apoptosis-associated genes between COVID-19 patients (COV) (n = 5) and healthy controls (Ctrl) (n = 3) in T cells. Student’s t test was applied. p < 0.05, ∗∗p < 0.01, ∗∗∗p < 0.001. See also Figure S3 and Table S3.
Figure 4
Figure 4
Hallmarks of COVID-19 Compared to IAV (Revealed by Single-Cell Analysis of Cytokines, Cytokine Receptors, and Transcription Factors) (A) The relative expression level (Z score) of key cytokines, cytokine receptors, and transcription factors among COVID-19 patients, IAV patients, and healthy controls in the activated CD4+ T cells population. (B) The expression level of four representative genes highly expressed in activated CD4+ T cells of IAV patients. Upper panel: the color of each dot in the dot plot indicates expression level of the gene; dot size represents the fraction of cells expressing the gene in activated CD4+ T cells population. Lower panel: difference in gene expression among samples from COVID-19 patients (COV) (n = 16), IAV patients (IAV) (n = 4), and healthy donors (Ctrl) (n = 3). Each dot in the boxplot represents the average expression level of a gene in the activated CD4+ T cells population in one sample. Student’s t test was applied to test the significance of the difference. p < 0.05, ∗∗p < 0.01, ∗∗∗p < 0.001. (C) Similar to (B), showing four representative genes highly expressed in the activated CD4+ T cells of COVID-19 patients. See also Figure S4.

Comment in

References

    1. Butler A., Hoffman P., Smibert P., Papalexi E., Satija R. Integrating single-cell transcriptomic data across different conditions, technologies, and species. Nat. Biotechnol. 2018;36:411–420. - PMC - PubMed
    1. Chen N., Zhou M., Dong X., Qu J., Gong F., Han Y., Qiu Y., Wang J., Liu Y., Wei Y. Epidemiological and clinical characteristics of 99 cases of 2019 novel coronavirus pneumonia in Wuhan, China: a descriptive study. Lancet. 2020;395:507–513. - PMC - PubMed
    1. Desai P., Tahiliani V., Hutchinson T.E., Dastmalchi F., Stanfield J., Abboud G., Thomas P.G., Ware C.F., Song J., Croft M., Salek-Ardakani S. The TNF superfamily molecule LIGHT promotes the generation of circulating and lung-resident memory CD8 T cells following an acute respiratory virus infection. J. Immunol. 2018;200:2894–2904. - PMC - PubMed
    1. Dobin A., Davis C.A., Schlesinger F., Drenkow J., Zaleski C., Jha S., Batut P., Chaisson M., Gingeras T.R. STAR: ultrafast universal RNA-seq aligner. Bioinformatics. 2013;29:15–21. - PMC - PubMed
    1. Elmore S. Apoptosis: a review of programmed cell death. Toxicol. Pathol. 2007;35:495–516. - PMC - PubMed

Publication types