. 2020 Aug 8;21(16):5688.
doi: 10.3390/ijms21165688.

Strain-Level Metagenomic Data Analysis of Enriched In Vitro and In Silico Spiked Food Samples: Paving the Way towards a Culture-Free Foodborne Outbreak Investigation Using STEC as a Case Study

Affiliations

Strain-Level Metagenomic Data Analysis of Enriched In Vitro and In Silico Spiked Food Samples: Paving the Way towards a Culture-Free Foodborne Outbreak Investigation Using STEC as a Case Study

Assia Saltykova et al. Int J Mol Sci. .

Abstract

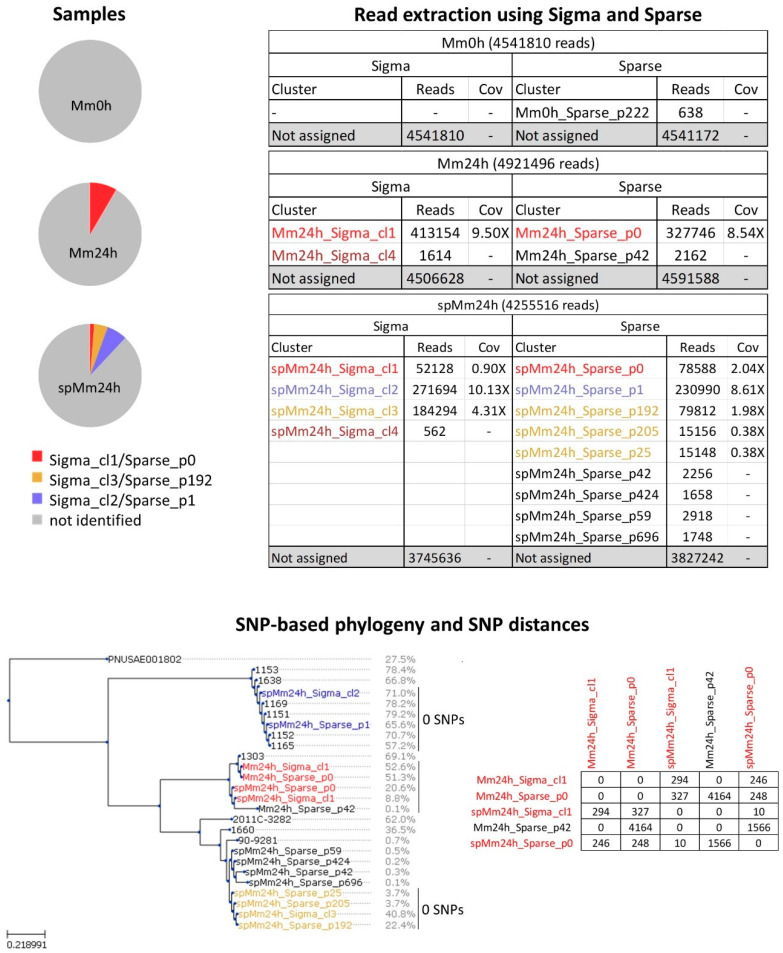
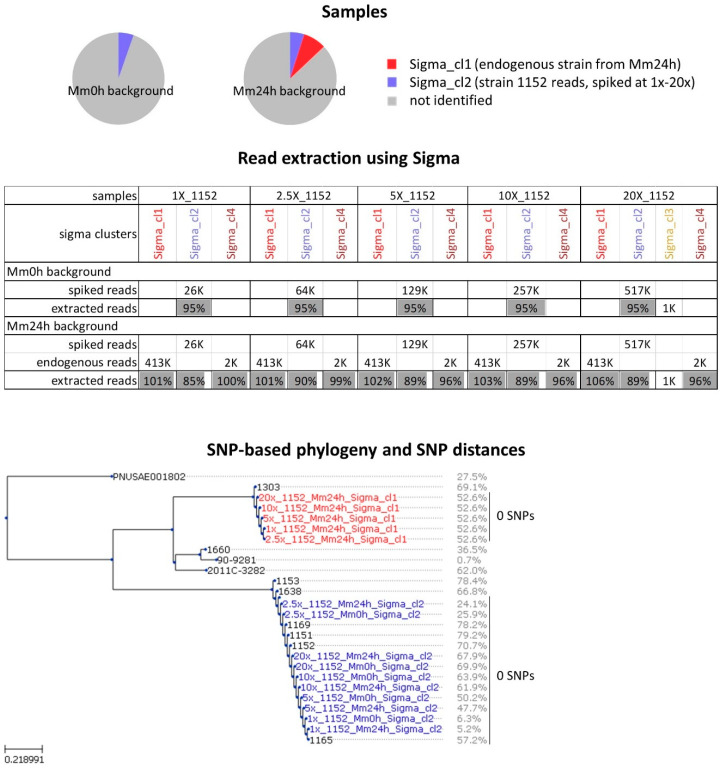
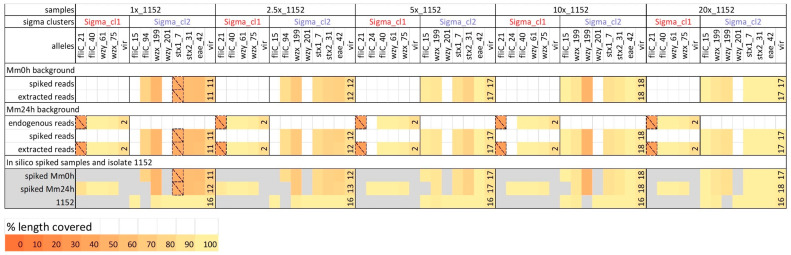
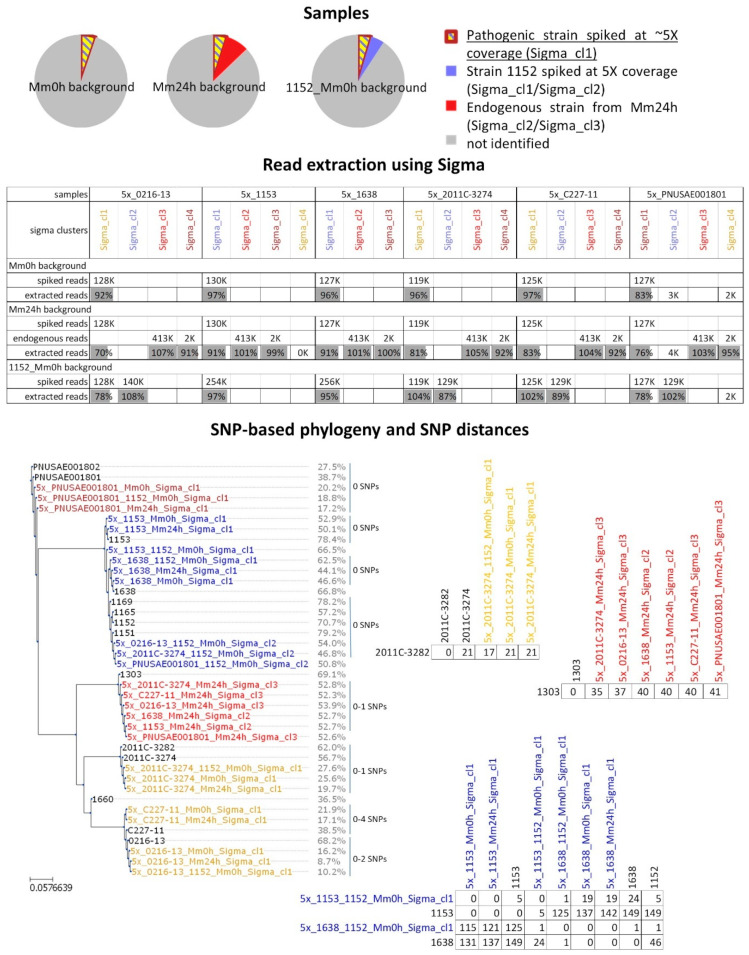
Culture-independent diagnostics, such as metagenomic shotgun sequencing of food samples, could not only reduce the turnaround time of samples in an outbreak investigation, but also allow the detection of multi-species and multi-strain outbreaks. For successful foodborne outbreak investigation using a metagenomic approach, it is, however, necessary to bioinformatically separate the genomes of individual strains, including strains belonging to the same species, present in a microbial community, which has up until now not been demonstrated for this application. The current work shows the feasibility of strain-level metagenomics of enriched food matrix samples making use of data analysis tools that classify reads against a sequence database. It includes a brief comparison of two database-based read classification tools, Sigma and Sparse, using a mock community obtained by in vitro spiking minced meat with a Shiga toxin-producing Escherichia coli (STEC) isolate originating from a described outbreak. The more optimal tool Sigma was further evaluated using in silico simulated metagenomic data to explore the possibilities and limitations of this data analysis approach. The performed analysis allowed us to link the pathogenic strains from food samples to human isolates previously collected during the same outbreak, demonstrating that the metagenomic approach could be applied for the rapid source tracking of foodborne outbreaks. To our knowledge, this is the first study demonstrating a data analysis approach for detailed characterization and phylogenetic placement of multiple bacterial strains of one species from shotgun metagenomic WGS data of an enriched food sample.

Keywords: foodborne outbreak investigation; public health; strain-level metagenomics.


Conflict of interest statement

The authors declare no conflict of interest.

Figures

Figure 1
Figure 1
Strain-level metagenomic analysis of minced meat samples by Sigma and Sparse. Samples: the pie plots represent schematically the three metagenomic samples: the non-enriched minced meat sample containing no considerable endogenous E. coli strains (Mm0h), the enriched minced meat sample containing one more prevalent and one negligible (not included in figure) endogenous E. coli strain according to Sigma (Mm24h) and the minced meat sample spiked with isolate TIAC1152 and enriched containing three more prevalent and some negligible (not included in figure) E. coli strains, one of which (Sigma_cl2/Sparse_p1) corresponds to the spiked strain (spMm24h). Read extraction using Sigma and Sparse: the tables show Sigma and Sparse clusters detected in Mm0h, Mm24h and spMm24h, along with the corresponding number of reads and coverage (Cov). Single nucleotide polymorphism (SNP)-based phylogeny and SNP distances: on the left, SNP-based phylogeny of Sigma and Sparse clusters detected in metagenomic samples (colored) and some background isolates (black, Table 1) is shown. Percentages listed next to the Sigma and Sparse cluster names and isolate names represent the fraction of the reference genome that was suitable for the phylogenetic analysis. On the right, SNP distances (expressed as SNPs per million of genomic positions) observed within some of the groups of closely related strains and isolates are indicated. The colors of the Sigma and Sparse clusters correspond to the colors used in Figure S2 and Figure 2, allowing to identify the section of the reference genome cgMLST tree from which the references underlying the clusters originated.
Figure 2
Figure 2
Gene detection of the O- and H-type serotyping and virulence genes performed on the clusters detected by Sigma and Sparse in the spiked (spMm24h) and unspiked (Mm24h) enriched minced meat samples. The table includes only the three largest clusters from spMm24h and only the first largest cluster from Mm24h, as none of the smaller clusters generated by any the two tools contained any of the monitored genes. In addition to the clusters generated by Sigma and Sparse, for comparison reasons, gene detection was performed on the reads obtained for the whole metagenomic samples, Mm24h and spMm24h, and on those of isolate TIAC1152 that was used for spiking. The Shiga toxin-producing Escherichia coli (STEC)-specific virulence genes (stx and eae), are displayed separately, while for the remaining virulence genes (vir), only the total number of the detected genes is shown (see Figure S3 for more detailed information). Cell color represents the percentage of the allele length covered by reads (%). Only alleles covered for more than 50% at least once are included in the table. Thereby, alleles that are covered below 50% are encased with dashed lines, and are not considered during interpretation of the results.
Figure 3
Figure 3
Strain-level analysis of in silico spiked metagenomic samples containing the strain TIAC1152 at different coverages. Samples: the pie plots represent schematically the simulated metagenomic samples consisting of isolate TIAC1152 reads down-sampled to different coverage and in silico spiked into the non-enriched minced meat sample containing no endogenous E. coli strains (Mm0h background) and the enriched minced meat sample containing one more prevalent and one negligible (not included in figure) endogenous E. coli strain according to Sigma (Mm24h background). Read extraction using Sigma: the number of isolate TIAC1152 reads surviving upon quality trimming spiked into the Mm0h and the Mm24h backgrounds (spiked reads), number of reads belonging to the endogenous strains from Mm24h according to Sigma (endogenous reads), and percentage of spiked and endogenous reads that were attributed by Sigma to clusters and extracted from the simulated metagenomic samples (extracted reads) are listed. For clusters containing in silico spiked reads, the percentage is calculated relative to the number of the in silico spiked reads. If the origin of the reads in a cluster is unclear, then the number of extracted reads is reported instead of a percentage. For clusters containing reads of the main endogenous strain from the Mm24h background, the percentage is calculated relative to the number of reads observed in the unspiked Mm24h sample. SNP-based phylogeny and SNP distances: SNP-based phylogeny of Sigma clusters detected in metagenomic samples and thus presumably corresponding to individual bacterial strains (colored) and some background isolates (black, Table 1) is shown. Percentages listed next to the Sigma cluster names and isolate names indicate the fraction of the reference genome that was suitable for the phylogenetic analysis. In addition, SNP distances (expressed as SNPs per million of genomic positions) observed within some of the groups of closely related strains and isolates are indicated.
Figure 4
Figure 4
Strain-level analysis of in silico spiked metagenomic samples containing the strain TIAC1152 at different coverages: gene detection. Isolate TIAC1152 reads were down-sampled to different coverages (spiked reads) and spiked into the following metagenomic backgrounds: the non-enriched minced meat sample containing no endogenous E. coli strains (Mm0h background) and the enriched minced meat sample containing one more prevalent (endogenous reads) and one negligible endogenous E. coli strain according to Sigma (the latter strain contained no virulence or serotyping genes and is therefore omitted) (Mm24h background). The reads attributed to different Sigma clusters and thus presumably belonging to the different strains were extracted from the resulting in silico spiked metagenomic samples (extracted reads), and gene detection of the O- and H-type serotyping genes, STEC-specific virulence genes (stx and eae) and remaining virulence genes (vir) was performed. For the latter, only the total number of detected genes is shown (see Figure S4 for more details). The detected genes are grouped according to the Sigma clusters, in which the corresponding reads were retrieved. The line “endogenous reads” in the Mm24h background shows the genes observed in the main cluster extracted by Sigma from the unspiked Mm24h sample (Mm24h_Sigma_cl1). The lowest section of the table shows genes observed in the whole in silico spiked metagenomic samples prior to Sigma analysis (spiked Mm0h and spiked Mm24h) and in the non-downsampled sequencing data of isolate TIAC1152, the latter showing which serotyping and virulence gene alleles are expected for isolate TIAC1152. Cell color represents the percentage of the allele length covered by reads (%). Only alleles covered for more than 50% at least once are included in the table. Thereby, alleles that are covered below 50% are encased with dashed lines, and are not considered during interpretation of the results.
Figure 5
Figure 5
Strain-level analysis of in silico spiked metagenomic samples containing different pathogenic E. coli strains. Samples: the pie plots represent schematically the simulated metagenomic samples, consisting of reads of a pathogenic E. coli isolate (mixed color) in silico spiked at a ~5× coverage into the non-enriched minced meat sample containing no endogenous E. coli strains (Mm0h background), the enriched minced meat sample containing one more prevalent (red) and one negligible (not included in figure) endogenous E. coli strains according to Sigma (Mm24h background), and the non-enriched minced meat sample that has been previously in silico spiked with reads of a pathogenic E. coli isolate TIAC1152 (blue) at a coverage of 5× (1152_Mm0h background). Read extraction using Sigma: number of reads of a pathogenic E. coli isolate and isolate TIAC1152 surviving upon quality trimming spiked into the different backgrounds (spiked reads), the number of reads belonging to the endogenous strains of Mm24h according to Sigma (endogenous reads), and percentage of spiked and endogenous reads that were attributed by Sigma to clusters and extracted from the simulated metagenomic samples (extracted reads) are listed. For clusters containing in silico spiked reads, the percentage is calculated relative to the number of the in silico spiked reads. If the origin of the reads in a cluster is unclear, then the number of extracted reads is reported instead of a percentage. For clusters containing reads of the main endogenous strain from the Mm24h background, the percentage is calculated relative to the number of reads observed in the unspiked Mm24h sample. SNP-based phylogeny and SNP distances: on the left, SNP-based phylogeny of Sigma clusters detected in metagenomic samples and thus presumably corresponding to individual bacterial strains (colored) and some background isolates (black, Table 1) is shown. Percentages listed next to the Sigma cluster names and isolate names indicate the fraction of the reference genome that was suitable for the phylogenetic analysis. On the right, SNP distances (expressed as SNPs per million of genomic positions) observed within some of the groups of closely related strains and isolates are indicated.
Figure 6
Figure 6
Strain-level analysis of in silico spiked metagenomic samples containing different pathogenic E. coli strains: gene detection. Reads from different pathogenic E. coli isolates (Table 1) were down-sampled to a coverage of ~5× (spiked reads) and in silico spiked into three metagenomic backgrounds: the non-enriched minced meat sample containing no endogenous E. coli strains (Mm0h background), the enriched minced meat sample containing one more prevalent (endogenous reads) and one negligible endogenous E. coli strain according to Sigma (the latter strain contained no virulence or serotyping genes and is therefore omitted) (Mm24h background), and an the non-enriched minced meat sample that has been previously in silico spiked with reads of a pathogenic E. coli isolate TIAC1152 (spiked reads, Sigma_cl2) at a coverage of 5× (1152_Mm0h background). The reads attributed to different Sigma clusters and thus presumably belonging to the different strains were extracted from the resulting in silico spiked metagenomic samples (extracted reads), and gene detection of the O- and H-type serotyping genes, STEC-specific virulence genes (stx and eae) and remaining virulence genes (vir) was performed. For the latter, only the total number of detected genes is shown (see Figure S6 for more details). The detected genes are grouped according to the Sigma clusters, in which the corresponding reads were retrieved. The line “endogenous reads” in the Mm24h background shows the genes observed in the main cluster extracted by Sigma from the unspiked Mm24h sample (Mm24h_Sigma_cl1). The last section of the table shows genes observed in the non-downsampled sequencing data of isolate TIAC1152 and the additional spiked pathogenic E. coli isolate (pathogenic isolate). Cell color represents the percentage of the allele length covered by reads (%). Only alleles covered for more than 50% at least once are included in the table. Thereby, alleles that are covered below 50% are encased with dashed lines, and are not considered during interpretation of the results.

References

    1. Van Goethem N., Descamps T., Devleesschauwer B., Roosens N.H.C., Boon N.A.M., Van Oyen H., Robert A. Status and potential of bacterial genomics for public health practice: A scoping review. Implement. Sci. 2019;14:79. doi: 10.1186/s13012-019-0930-2. - DOI - PMC - PubMed
    1. Leopold S.R., Goering R.V., Witten A., Harmsen D., Mellmann A. Bacterial whole-genome sequencing revisited: Portable, scalable, and standardized analysis for typing and detection of virulence and antibiotic resistance genes. J. Clin. Microbiol. 2014;52:2365–2370. doi: 10.1128/JCM.00262-14. - DOI - PMC - PubMed
    1. EFSA BIOHAZ Panel. Koutsoumanis K., Allende A., Alvarez-Ordóñez A., Bolton D., Bover-Cid S., Chemaly M., Davies R., De Cesare A., Hilbert F. Whole genome sequencing and metagenomics for outbreak investigation, source attribution and risk assessment of food-borne microorganisms. EFSA. J. 2019;17:e05898. - PMC - PubMed
    1. Rantsiou K., Kathariou S., Winkler A., Skandamis P., Saint-Cyr M.J., Rouzeau-Szynalski K., Amézquita A. Next generation microbiological risk assessment: Opportunities of whole genome sequencing (WGS) for foodborne pathogen surveillance, source tracking and risk assessment. Int. J. Food Microbiol. 2018;287:3–9. doi: 10.1016/j.ijfoodmicro.2017.11.007. - DOI - PubMed
    1. World Health Organization Whole Genome Sequencing for Foodborne Disease Surveillance: Landscape Paper. [(accessed on 1 July 2020)]; Available online: http://origin.who.int/foodsafety/publications/foodborne_disease/wgs_land...

LinkOut - more resources