. 2020 Aug 8;9(8):2575.
doi: 10.3390/jcm9082575.

Abnormal Microvascular Architecture, Fibrosis, and Pericyte Characteristics in the Calf Muscle of Peripheral Artery Disease Patients with Claudication and Critical Limb Ischemia

Affiliations

Abnormal Microvascular Architecture, Fibrosis, and Pericyte Characteristics in the Calf Muscle of Peripheral Artery Disease Patients with Claudication and Critical Limb Ischemia

Constance J Mietus et al. J Clin Med. .

Abstract

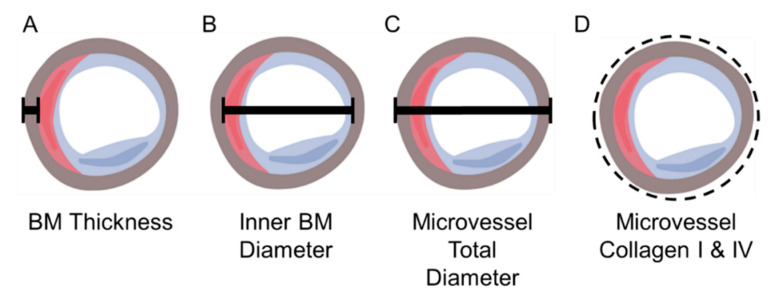
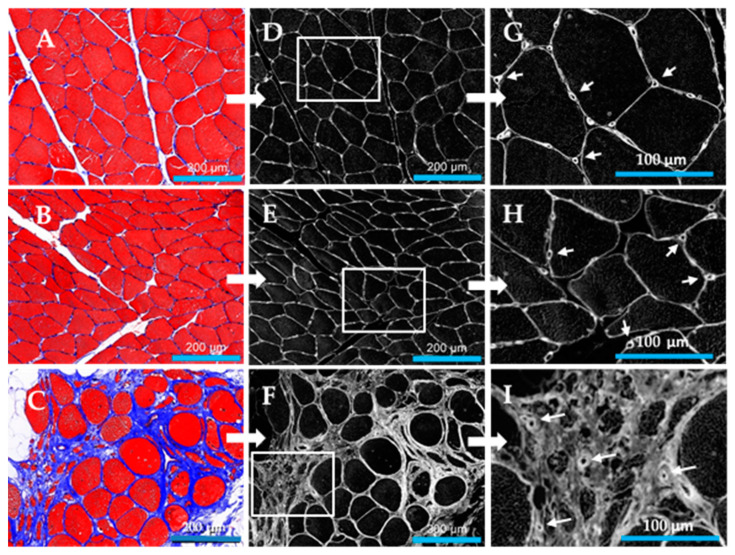
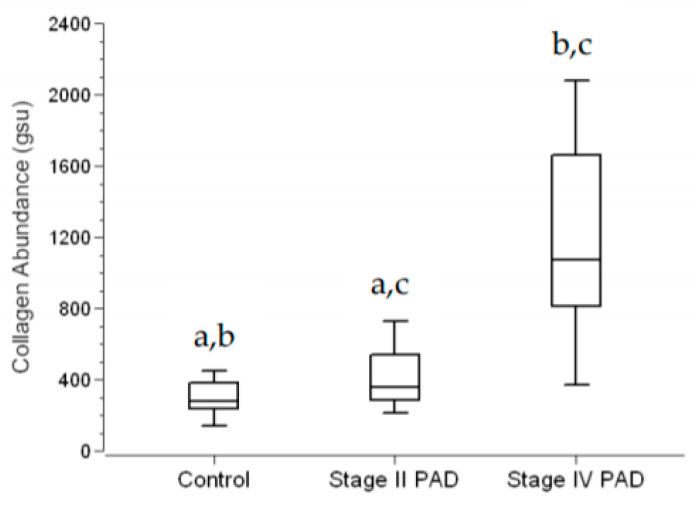
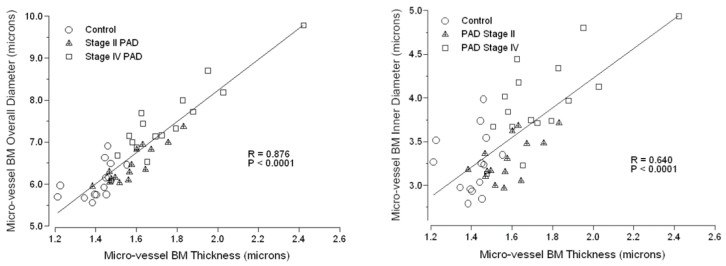
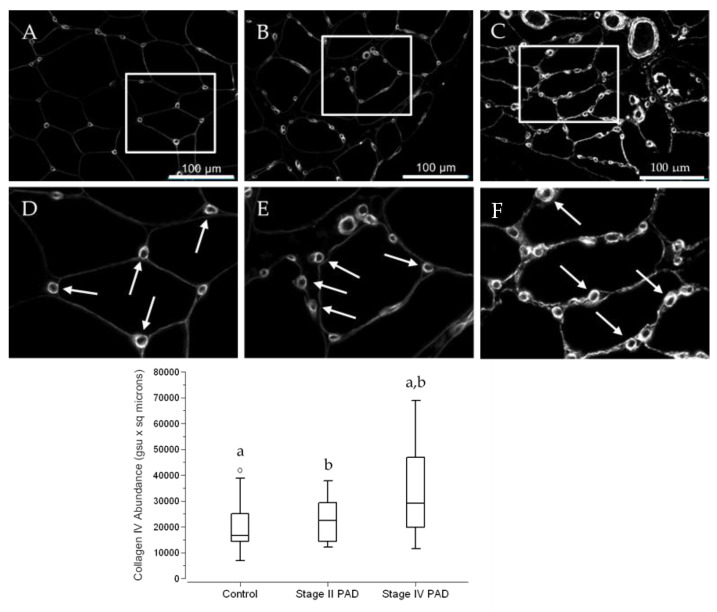
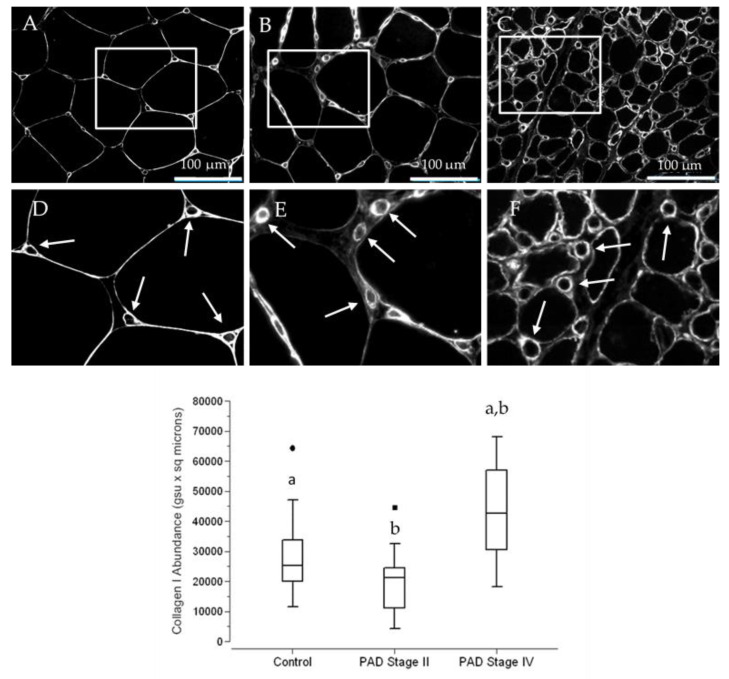
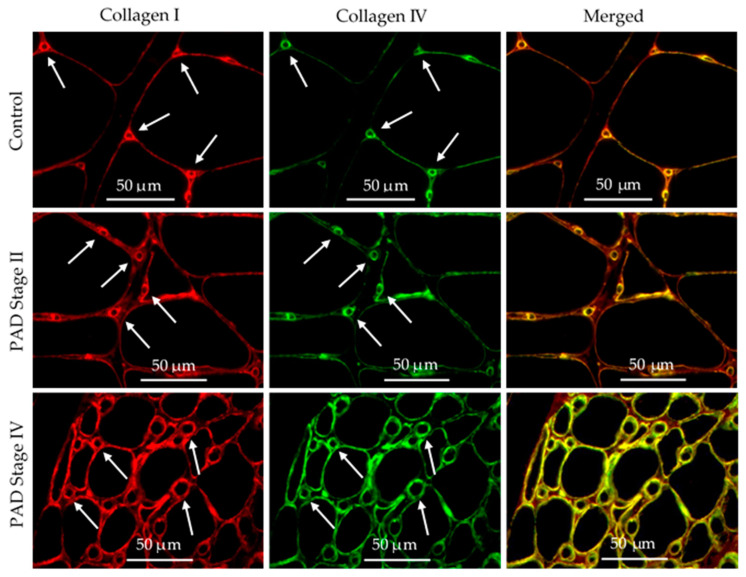
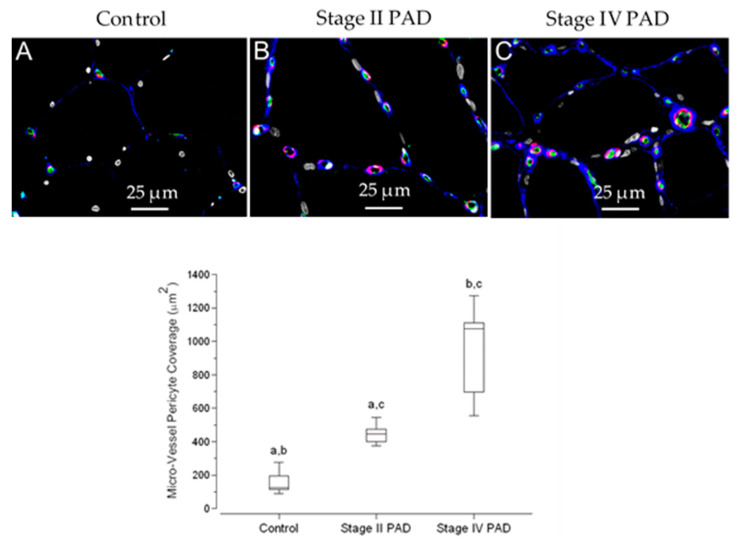
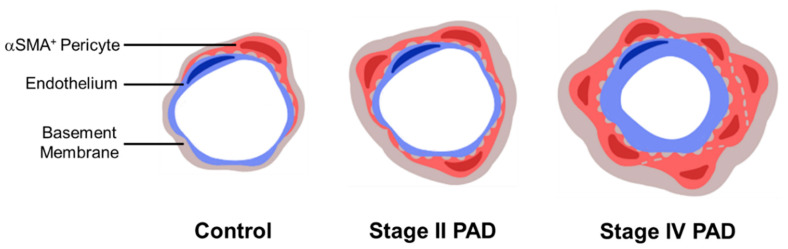
Work from our laboratory documents pathological events, including myofiber oxidative damage and degeneration, myofibrosis, micro-vessel (diameter = 50-150 μm) remodeling, and collagenous investment of terminal micro-vessels (diameter ≤ 15 µm) in the calf muscle of patients with Peripheral Artery Disease (PAD). In this study, we evaluate the hypothesis that the vascular pathology associated with the legs of PAD patients encompasses pathologic changes to the smallest micro-vessels in calf muscle. Biopsies were collected from the calf muscle of control subjects and patients with Fontaine Stage II and Stage IV PAD. Slide specimens were evaluated by Quantitative Multi-Spectral and Fluorescence Microscopy. Inter-myofiber collagen, stained with Masson Trichrome (MT), was increased in Stage II patients, and more substantially in Stage IV patients in association with collagenous thickening of terminal micro-vessel walls. Evaluation of the Basement Membrane (BM) of these vessels reveals increased thickness in Stage II patients, and increased thickness, diameter, and Collagen I deposition in Stage IV patients. Coverage of these micro-vessels with pericytes, key contributors to fibrosis and BM remodeling, was increased in Stage II patients, and was greatest in Stage IV patients. Vascular pathology of the legs of PAD patients extends beyond atherosclerotic main inflow arteries and affects the entire vascular tree-including the smallest micro-vessels.

Keywords: basement membrane thickening; fibrosis; microvascular pathology; αSMA+ pericytes.


Conflict of interest statement

The authors declare no conflict of interest.

Figures

Figure 1
Figure 1
Schematic Representation of Micro-vessel Architecture. The drawing depicts a micro-vessel with endothelial cell (blue), pericyte (red) and basement membrane (BM) (brown). The black bars identify micro-vessel measurements: (A) BM thickness, (B) BM inner diameter and (C) micro-vessel overall diameter. The dashed line (D) identifies Area of Interest (AOI) placed around each micro-vessel.
Figure 2
Figure 2
Measurements of Micro-vessel Architecture. Slide specimens labeled with anti-Collagen IV Ab were imaged with a 40× objective and deconvoluted with AutoQuant® software for reduced light scatter and improved micro-vessel delineation. For each micro-vessel (overall diameter ≤15μm), two perpendicular line profiles of Collagen IV fluorescence intensity were generated with a custom MatLab program. Gaussian distributions (red) were fitted to the raw fluorescence intensity data (blue). The thickness of the Collagen IV ring (basement membrane) for each micro-vessel was determined as the average distance at the 95% confidence interval for each of the Gaussian curves. The inner diameter of the basement membrane was determined as the mean of the distances between the pairs of Gaussian curves at the locations of their 95% confidence intervals.
Figure 3
Figure 3
Inter-myofiber collagen deposition in the calf muscle of control subjects and patients with peripheral artery disease (PAD). Slide specimens of calf muscle biopsies fixed and then embedded in paraffin were sectioned at four microns and stained with Masson Trichrome (MT). Inter-myofiber collagen staining (Blue) in control calf muscle (Panel (A)) (N = 14) is uniform among closely associated myofibers (RED) of relatively homogeneous polygonal shape and cross-sectional area. Collagen staining is increased in PAD Stage II (Panel (B)) (N = 15) and Stage IV (Panel (C)) (N = 15) with the latter presenting remarkable departures in myofiber geometry and collagen deposition compared to both control and Stage II muscle. Stage IV calf muscle exhibited many small degenerating and fragmented myofibers embedded in a large fibrotic matrix, as well as enlarged rounded myofibers, likely necrotic, surrounded by more abundant collagen. Greyscale images of deposited collagen (Panels DF) were extracted from Multi-Spectral images of slide specimens stained with MT and captured with the Nuance System (20× objective). A magnified region (Panels GI) of each greyscale image revealed well-defined collagenous rings around the micro-vessels (Arrows). Scale bars (Panels AF) represent 200 microns.
Figure 4
Figure 4
Inter-myofiber Collagen Abundance in Calf Muscle of Control Subjects and Patients with Peripheral Artery Disease (PAD). Calf muscle biopsies were taken from control subjects (N = 14) and patients with Stage II (N = 15) and Stage IV PAD (N = 15), embedded in paraffin, sectioned at four microns, and stained with Masson Trichrome (MT). Microscopic images were captured with a Multi-Spectral imaging system. Quantitative greyscale images of inter-myofiber collagen were extracted from the Multi-Spectral images and quantified in the Image Pro® Premier environment. Collagen abundance (gsu) was computed as the sum of the products (gsu∙micron2) of mean pixel intensity and event area divided by the total area (micron2) of myofibers plus total area of inter-myofiber collagen, per microscopic field. The average of five fields per slide specimen was taken as the collagen abundance per patient. Data are presented as Fence Box Plots. Statistical significance was determined with the non-parametric randomization test. a—Significantly different at p = 0.041. b—Significantly different at p < 0.001 c—Significantly different at p < 0.001
Figure 5
Figure 5
Dimensions of the architectural features of the micro-vessel basement membrane (BM) are highly coordinated across control subjects and PAD patients. BMs of calf muscle biopsy specimens were labeled with anti-Collagen IV antibody, and then micro-vessel BM architectural features, including thickness, inner diameter and overall diameter were measured. Measurements were obtained for approximately 50 to 200 micro-vessels per biopsy specimen of control subjects (N = 14) and patients with Stage II (N = 15) and Stage IV (N = 16) PAD. Means per patient are plotted. Correlations were determined by Spearman Rho.
Figure 6
Figure 6
Collagen IV deposition presents as intensely labeled BM rings that delineate micro-vessels in the calf muscle of control subjects and PAD patients. Slide specimens of biopsies from calf muscle of control subjects (A) (N = 14) and patients with Stage II (B) (N = 15) and Stage IV (C) (N = 16) PAD were labeled with anti-Collagen IV antibody, and fluorescence images were captured with a widefield microscope (40× objective). Selected regions of the same dimensions in Panels (AC) were enlarged (Panels (DF)), providing a more detailed view of the micro-vessel labeling (Arrows). Both inner and overall diameters of the BM rings appear to be larger and more intense in the specimen from the patient with Stage IV disease, compared to specimens from the control subject and the patient with Stage II disease. Scale bars represent 100 μm. Median Collagen IV abundances per micro-vessel were determined by Quantitative Fluorescence Microscopy, computed as the product of ring area and mean labeling intensity, and are presented as Fence Box Plots. Collagen IV abundance was significantly increased in patients with Stage IV PAD compared to control subjects and Stage II patients. Data were analyzed by the randomization test where: a—significantly different at p = 0.029. b—significantly different at p = 0.044.
Figure 7
Figure 7
Collagen I deposition presents as intensely labeled rings that delineate micro-vessels in the calf muscle of control subjects and PAD patients. Slide specimens of biopsies from calf muscle of control subjects (A) (N = 14) and patients with Stage II (B) (N = 15) and Stage IV (C) (N = 16) PAD were labeled with anti-Collagen I antibody, and fluorescence images were captured with a widefield microscope (40× objective). Selected regions in Panels (AC) were enlarged (Panels (DF)), providing a more detailed view of micro-vessel labeling (Arrows). The inner and overall diameter of the micro-vessel rings appears to be larger and more intense in the specimen from the patient with Stage IV disease, compared to specimens from the control subject and the patient with Stage II disease. Scale bars = 100 µm. Median Collagen I abundances per micro-vessel were determined by Quantitative Fluorescence Microscopy, computed as the product of ring area and mean labeling intensity, and are presented as Fence Box Plots. Collagen I was significantly increased in patients with Stage IV PAD compared to control subjects and Stage II patients. Data were analyzed by the randomization test where: a—significantly different at p < 0.002. b—significantly different at p < 0.001
Figure 8
Figure 8
Co-localization of Collagen I and IV deposited as distinctive rings associated with micro-vessels in the calf muscle of control subjects and patients with PAD. Biopsy specimens embedded in paraffin were sectioned at four microns and mounted to glass slides. Slide specimens were labeled simultaneously with anti-Collagen I and anti-Collagen IV antibodies, and subsequently, with goat anti-rabbit and goat anti-mouse secondary antibodies (respectively) coupled with fluorophores. Images of each slide specimen were taken in separate fluorescence channels corresponding to each collagen label, with a widefield microscope (40× objective). Distinctive rings of Collagen I (Red) and Collagen IV (Green) delineate micro-vessels (Arrows) and are co-localized (Yellow) in the basement membrane. Myofibers are identified as large black areas delineated by both Collagen I and Collagen IV. Labeling of inter-myofiber Collagen I (Red) is readily apparent in the merged images of the Stage II and Stage IV specimens. Scale bars represent 50 microns.
Figure 9
Figure 9
Micro-vessel pericyte coverage is increased in the calf muscle of patients with PAD. Slide specimens of calf muscle biopsies from control subjects (N = 5) and patients with Stage II (N = 5) and Stage IV (N = 5) PAD were labeled with antibodies specific for Collagen IV (Blue), αSmooth Muscle Actin (αSMA) (Red), endothelial cell CD-31 (Green) and nuclei (Grey/White). Fluorescence images were captured with a widefield microscope (40× objective). Pericyte segments were identified as αSMA positive labeling intimately associated with the micro-vessel endothelium. Micro-vessels of control muscle (A) had few pericyte segments, and these occupied very small areas. The number and size of pericyte labeling events increased in patients with Stage II PAD (B) and were greater in patients with Stage IV PAD (C). Scale bar = 25 μm. Pericyte coverage per microscopic field was determined by Quantitative Fluorescence Microscopy as the sum of the areas occupied by pericyte segments. We analyzed five 40× fields in duplicate slide specimens per patient and control. Coverage for controls and patients with Stage II and Stage IV disease is presented as Fence Box Plots, and differences were analyzed by the randomization test where: a—significantly different at p = 0.009; b—significantly different at p < 0.009; c—significantly different at p < 0.007.
Figure 10
Figure 10
Schematic representation of micro-vessel remodeling in PAD.

References

    1. Rontoyanni V.G., Nunez Lopez O., Fankhauser G.T., Cheema Z.F., Rasmussen B.B., Porter C. Mitochondrial Bioenergetics in the Metabolic Myopathy Accompanying Peripheral Artery Disease. Front. Physiol. 2017;8:141. doi: 10.3389/fphys.2017.00141. - DOI - PMC - PubMed
    1. Brevetti G., Giugliano G., Brevetti L., Hiatt W.R. Inflammation in peripheral artery disease. Circulation. 2010;122:1862–1875. doi: 10.1161/CIRCULATIONAHA.109.918417. - DOI - PubMed
    1. McDermott M.M. Lower extremity manifestations of peripheral artery disease: The pathophysiologic and functional implications of leg ischemia. Circ. Res. 2015;116:1540–1550. doi: 10.1161/CIRCRESAHA.114.303517. - DOI - PMC - PubMed
    1. Gardner A.W., Afaq A. Management of lower extremity peripheral arterial disease. J. Cardiopulm. Rehabil. Prev. 2008;28:349–357. doi: 10.1097/HCR.0b013e31818c3b96. - DOI - PMC - PubMed
    1. Hiatt W.R., Armstrong E.J., Larson C.J., Brass E.P. Pathogenesis of the limb manifestations and exercise limitations in peripheral artery disease. Circ. Res. 2015;116:1527–1539. doi: 10.1161/CIRCRESAHA.116.303566. - DOI - PubMed