. 2020 Aug 10;25(16):3630.
doi: 10.3390/molecules25163630.

Generation and Characterization of a DNA-GCN4 Oligonucleotide-Peptide Conjugate: The Impact DNA/Protein Interactions on the Sensitization of DNA

Affiliations

Generation and Characterization of a DNA-GCN4 Oligonucleotide-Peptide Conjugate: The Impact DNA/Protein Interactions on the Sensitization of DNA

Paweł Wityk et al. Molecules. .

Abstract

Radiotherapy, the most common therapy for the treatment of solid tumors, exerts its effects by inducing DNA damage. To fully understand the extent and nature of this damage, DNA models that mimic the in vivo situation should be utilized. In a cellular context, genomic DNA constantly interacts with proteins and these interactions could influence both the primary radical processes (triggered by ionizing radiation) and secondary reactions, ultimately leading to DNA damage. However, this is seldom addressed in the literature. In this work, we propose a general approach to tackle these shortcomings. We synthesized a protein-DNA complex that more closely represents DNA in the physiological environment than oligonucleotides solution itself, while being sufficiently simple to permit further chemical analyses. Using click chemistry, we obtained an oligonucleotide-peptide conjugate, which, if annealed with the complementary oligonucleotide strand, forms a complex that mimics the specific interactions between the GCN4 protein and DNA. The covalent bond connecting the oligonucleotide and peptide constitutes a part of substituted triazole, which forms due to the click reaction between the short peptide corresponding to the specific amino acid sequence of GCN4 protein (yeast transcription factor) and a DNA fragment that is recognized by the protein. DNAse footprinting demonstrated that the part of the DNA fragment that specifically interacts with the peptide in the complex is protected from DNAse activity. Moreover, the thermodynamic characteristics obtained using differential scanning calorimetry (DSC) are consistent with the interaction energies calculated at the level of metadynamics. Thus, we present an efficient approach to generate a well-defined DNA-peptide conjugate that mimics a real DNA-peptide complex. These complexes can be used to investigate DNA damage under conditions very similar to those present in the cell.

Keywords: DNA-protein interactions; radiotherapy; sensitizers.


Conflict of interest statement

The authors declare no conflict of interest.

Figures

Figure 1
Figure 1
Front, side and top views of the DNA-peptide conjugate in double-stranded DNA form after click chemistry reaction; purple—peptide in α-helix conformation, gray—dsDNA in B-DNA form and orange—azide-alkyne Huisgen cycloaddition linker.
Figure 2
Figure 2
Progression if the click chemistry reaction monitored by high-performance liquid chromatography (HPLC), after 20 (black) and 60 (pink) mins. ssDNA (A*) standard before the reaction is shown in orange. After 60 min all of the substrate (ssDNA A*) was transformed into product (ssDNA A*-PEP). Injection volumes was as follows: 10 µL, 10 µL and 5 µL respectively for 0, 20 and 60 min. HPLC conditions: XBridge OST reverse-phase C18 column; mobile phases A: 50 mM triethylamine acetate (TEAA) and 1% acetonitrile in water, B: 80% ACN in water; a gradient of 0–20%/20 min B was used, maintaining 1 mL/min flow rate; recorded at 260 nm.
Figure 3
Figure 3
HPLC (left) and denaturative HPLC (dHPLC)—(right) analysis of the dsDNA product obtained after annealing ssDNA peptide conjugates. Purple—non-labeled dsDNA, black—dsDNA**-PEP, blue—dsDNA*-PEP. HPLC conditions: XBridge OST reverse-phase C18 column; mobile phases A: 50 mM triethylamine acetate (TEAA) and 1% acetonitrile in water, B: 80% ACN in water; a gradient of 0–20%/20 min B was used, maintaining 1 mL/min flow rate; recorded at 260 nm. The picture clearly presents the high purity of obtained double stranded DNA systems—almost no other peaks visible.
Figure 4
Figure 4
HPLC analysis of the dsDNA*-PEP product obtained after annealing ssDNA A*-PEP peptide conjugates, showing a decrease in the ssDNA form at a lower temperature suggesting the interaction between ssDNA B complementary strand do ssDNA A*-PEP. HPLC conditions: XBridge OST reverse-phase C18 column; mobile phases A: 50 mM triethylamine acetate (TEAA) and 1% acetonitrile in water, B: 80% ACN in water; a gradient of 0–20%/20 min B was used, maintaining 1 mL/min flow rate; recorded at 260 nm.
Figure 5
Figure 5
(A)—Native polyacrylamide gel electrophoresis (PAGE) of biomolecules. Lane: (1)—ssDNA* A, (2)—ssDNA B, (3)—dsDNA, (4)—dsDNA*-PEP. (B)—Denaturing PAGE of biomolecules. Lane: (1)—dsDNA**-PEP, (2)—dsDNA*-PEP, (3)—dsDNA, (4)—ssDNA*-PEP, (5)—ssDNA B, (6)—ssDNA* A. PAGE conditions: 15% PAGE with or without 7M urea; 150 V for 1 or 1.5 h for native and denaturating PAGE, respectively, stained with SYBR.
Figure 6
Figure 6
Liquid chromatography-mass spectrometry (LC-MS) analysis of the following biomolecules represented by Total Ion chromatogram: (A) dsDNA; (B) DNase I digestion patterns of dsDNA (pink) and dsDNA*-PEP (blue); (C) dsDNA*-PEP; (D) dsDNA**-PEP. The mobile phase A consisted of 400 mM HFIP and 15mM TEA in deionized ultrapure water and mobile phase B consisted of 200 mM HFIP, 7.5 mM TEA 50% (v) MeOH and 50% (v) H2O. The flow gradient condition was as follows: for purity check, 0–40% B at 15 min at 85 °C, 0–1 min 0% B; for footprinting analysis, 1–30 min 60% B at 50 °C.
Figure 7
Figure 7
Digestion pattern of dsDNA (blue) and dsDNA*-PEP (orange) by DNase I [Charge axis correspond to the following sequence starting from 5′ end—ssDNA* A (5′-GCA CGT CAT CCG TATAG-3′)]. The resulting chromatogram (based on data similar to the PAGE method) is taken from LC-MS analysis. Each peak on TIC (total ion current) was identified and their areas were plotted against the charge of the recognized fragment. The AP-1 sequence corresponds to the 5 to 8 charge fragment. 200 pmol of dsDNA*-PEP or dsDNA was incubated with 0.04 U of DNase I in 10 mM CaCl2, 100 mM MgCl2, 100 mM Tris-HCl (pH 8.9) buffer solution. The digestion was performed at 4 °C for 10 min.
Figure 8
Figure 8
(A)—Circular dichroism spectra obtained for dsDNA (in orange) and dsDNA*-PEP (gray) at 25 °C. (B)—The “difference” circular dichroism spectrum obtained for dsDNA*-PEP at 25 °C. The resulting spectrum represents the difference between dsDNA*-PEP and dsDNA CD spectra, rescaled by the concentration of the sample. Far-UV CD was measured on a Jasco J-810 spectropolarimeter (Jasco, Tokyo, Japan). Experiments were performed in 100 mM TBA buffer, pH 8 in 1 mm pathlength cuvette. The sample concentrations were 0.25 and 0.4 mg/mL for dsDNA-PEP and dsDNA, respectively. Spectra were recorded from 190 to 350 nm with a 1 nm step size.
Figure 9
Figure 9
Thermograms for dsDNA and dsDNA*-PEP (orange line) and baseline (gray line) of dsDNA and dsDNA-PEP in 100 mM PBS solution. Dashed lines indicate the heat capacity difference between folded and unfolded states. The DSC spectra after the sigmoidal baseline subtraction are shown in supplementary material (Figures S3 and S4). DSC experiments were performed on the CSC 6300 Nano-DSC III microcalorimeter (Calorimetry Sciences Corporation, Lindon, UT, USA) with the capillary cell volume of 0.299 mL at a temperature range of 0 to 90 °C. DSCRun software (Calorimetry Sciences Corporation, Lindon, UT, USA) was used to record the data. The concentration of dsDNA (molecular mass 10.38 kDa) and dsDNA*-PEP (molecular mass 13.15 kDa) were 0.466 and 0.326 mg/mL, respectively, in each experiment. The analysis was performed with a scanning rate of 1 °C·min−1.
Figure 10
Figure 10
Comparison of deconvoluted thermograms of dsDNA (blue) and dsDNA*-PEP (red).
Figure 11
Figure 11
Circular dichroism spectra of dsDNA*-PEP over 0–90 °C temperature range in 5 °C increments from 0 °C (blue) to 90 °C (red). As we can see the melting of the peptide and dsDNA can be seen by the 220 nm ellipticity increasing with the increasing temperature allowing for the determination of melting temperature ~64 °C of the α-helix. Studies of the melting of dsDNA alone can be predicted by monitoring the 280 nm ellipticity—thus we can see the cooperativity of the DNA and peptide melting process.
Figure 12
Figure 12
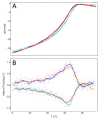
(A) Circular dichroism melting profiles (recorded at 220 nm) of dsDNA*-PEP over a 0–90 °C temperature range. (B) Circular dichroism melting profiles (recorded at 220 nm) of dsDNA*-PEP over a 0–90 °C temperature range. Heating (orange and blue curves) and cooling (red and cyan curves) experiments are shown. Curves represent the moving average of respective color dots (real measurement). Far-UV CD was measured on a Jasco J-810 spectropolarimeter (Jasco, Tokyo, Japan). Different measurements (for both heating and cooling) were conducted at a 1 °C/min heating/cooling rate from 0 to 90 °C or 90 to 0 °C and normalized against TBA buffer.
Figure 13
Figure 13
Free energy profile of peptide binding to DNA obtained by a well-tempered metadynamics scheme over 5 µs simulation. The reaction coordinate (RC) represents the distance between the centers of masses of the peptide and the AP-1 interacting site. The bound state is located around 0.9 nm. The calculated binding energy of α-helix to DNA is calculated to be ~10 kcal/mol.

References

    1. Rak J., Chomicz L., Wiczk J., Westphal K., Zdrowowicz M., Wityk P., Makurat S., Golon Ł. Mechanisms of damage to DNA labeled with electrophilic nucleobases induced by ionizing or UV radiation. J. Phys. Chem. B. 2015;119:8227–8238. doi: 10.1021/acs.jpcb.5b03948. - DOI - PubMed
    1. Hudson W.H., Ortlund E.A. The structure, function and evolution of proteins that bind DNA and RNA. Nat. Rev. Mol. Cell Biol. 2014;15:749–760. doi: 10.1038/nrm3884. - DOI - PMC - PubMed
    1. Bell S.P., Gann A., Levine M.R., Losick J.D., Watson T.A. Molecular Biology of the Gene. 7th ed. Cold Spring Harbor Laboratory Press; Cold Spring Harbor, NY, USA: 2008. Baker. Chapter II. Structure and study of macromolecules.
    1. Mukherjee S., Majumdar S., Bhattacharyya D. Role of hydrogen bonds in protein−DNA recognition: Effect of nonplanar amino groups. J. Phys. Chem. B. 2005;109:10484–10492. doi: 10.1021/jp0446231. - DOI - PubMed
    1. Mandel-Gutfreund Y., Schueler O., Margalit H. Comprehensive analysis of hydrogen bonds in regulatory protein DNA-complexes: In search of common principles. J. Mol. Biol. 1995;253:370–382. doi: 10.1006/jmbi.1995.0559. - DOI - PubMed

MeSH terms

LinkOut - more resources