. 2020 Nov 2;217(11):e20191847.
doi: 10.1084/jem.20191847.

Macrophage morphology correlates with single-cell diversity and prognosis in colorectal liver metastasis

Affiliations

Macrophage morphology correlates with single-cell diversity and prognosis in colorectal liver metastasis

Matteo Donadon et al. J Exp Med. .

Abstract

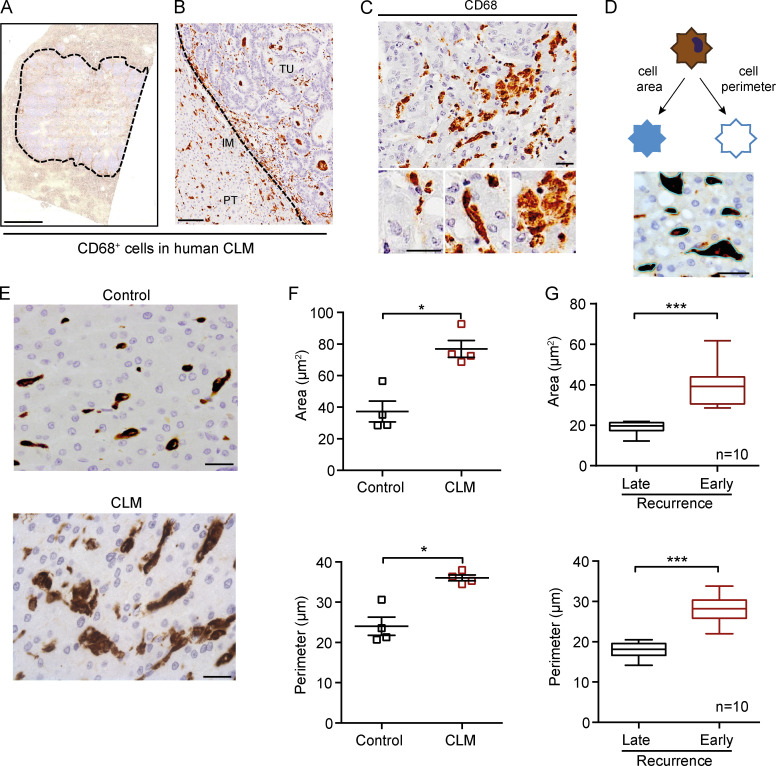
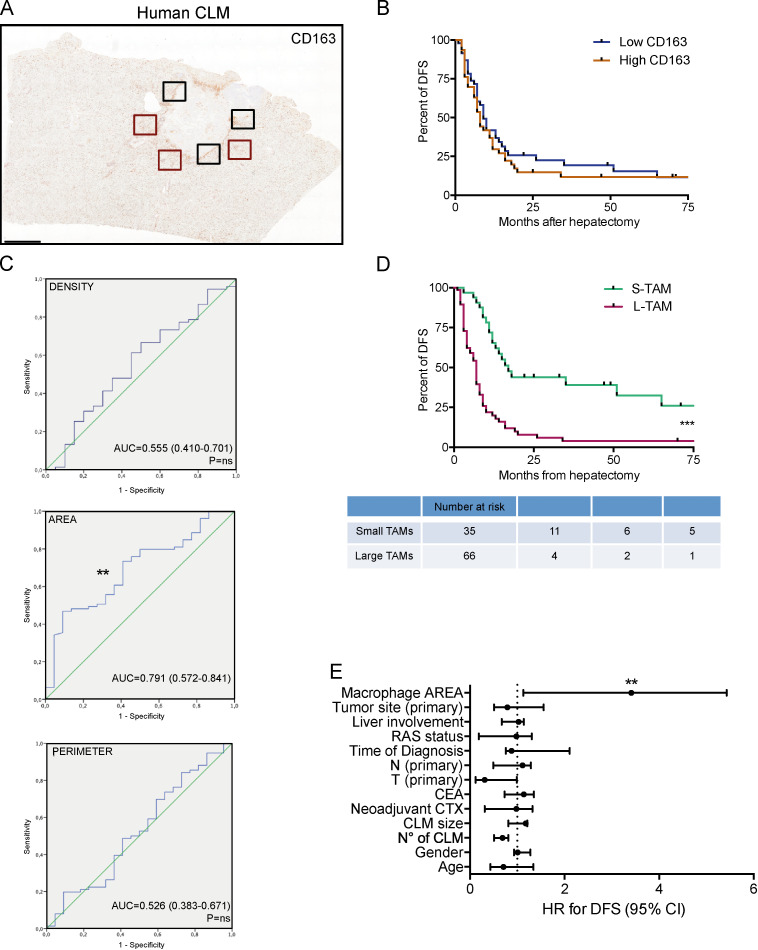
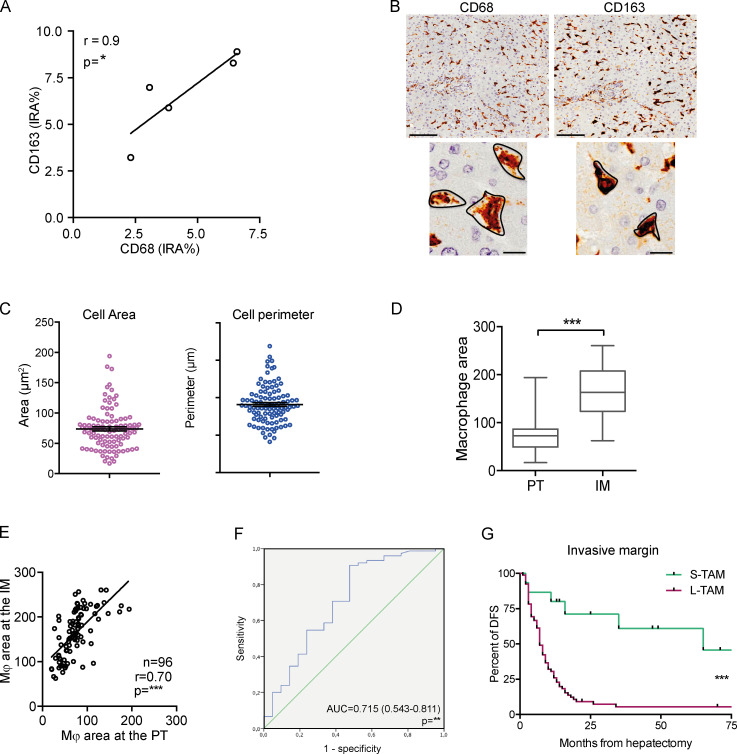
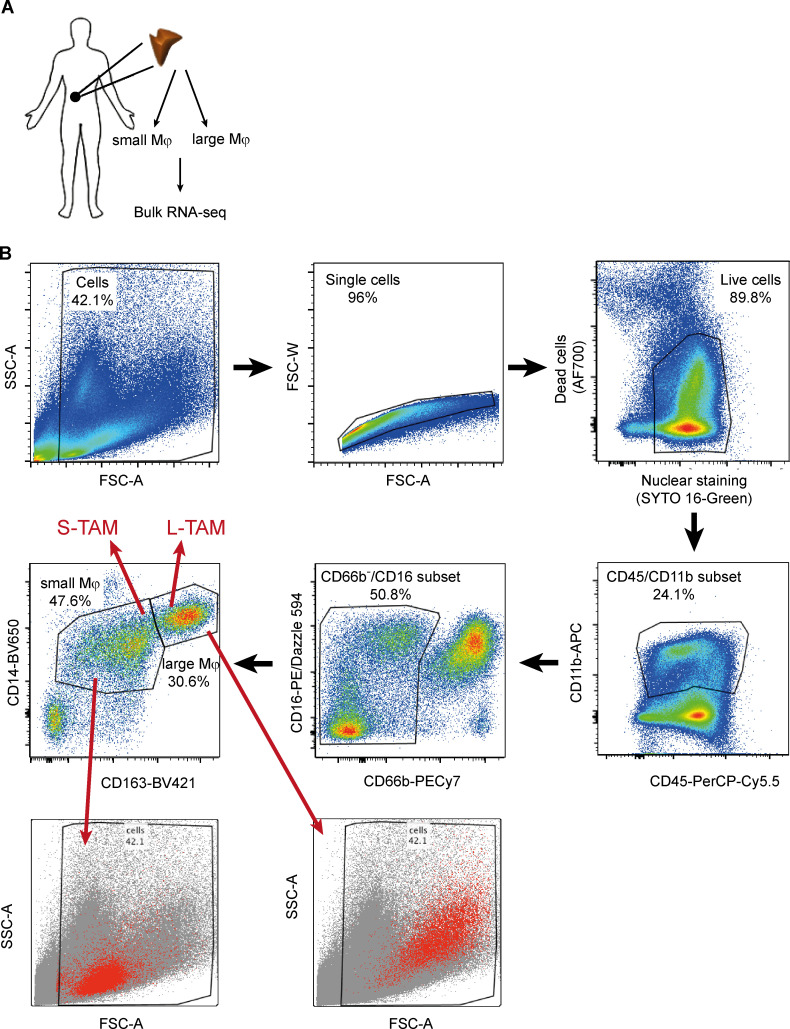
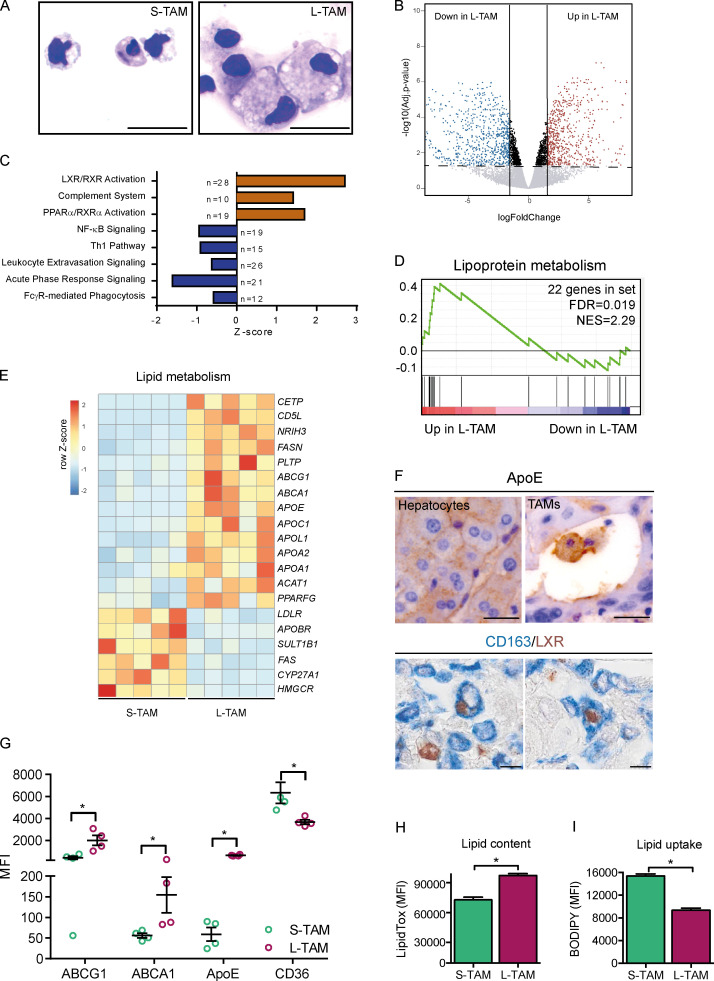
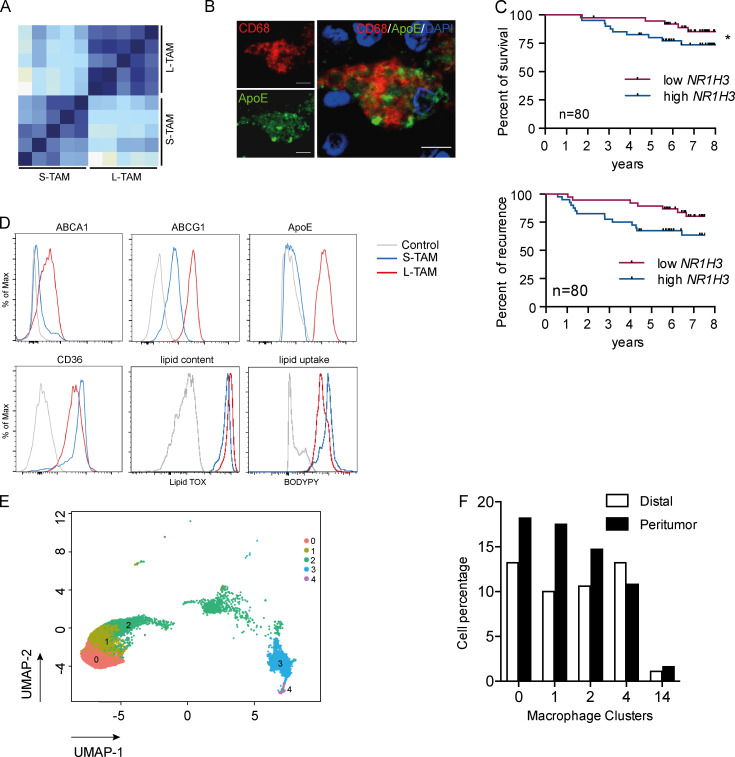
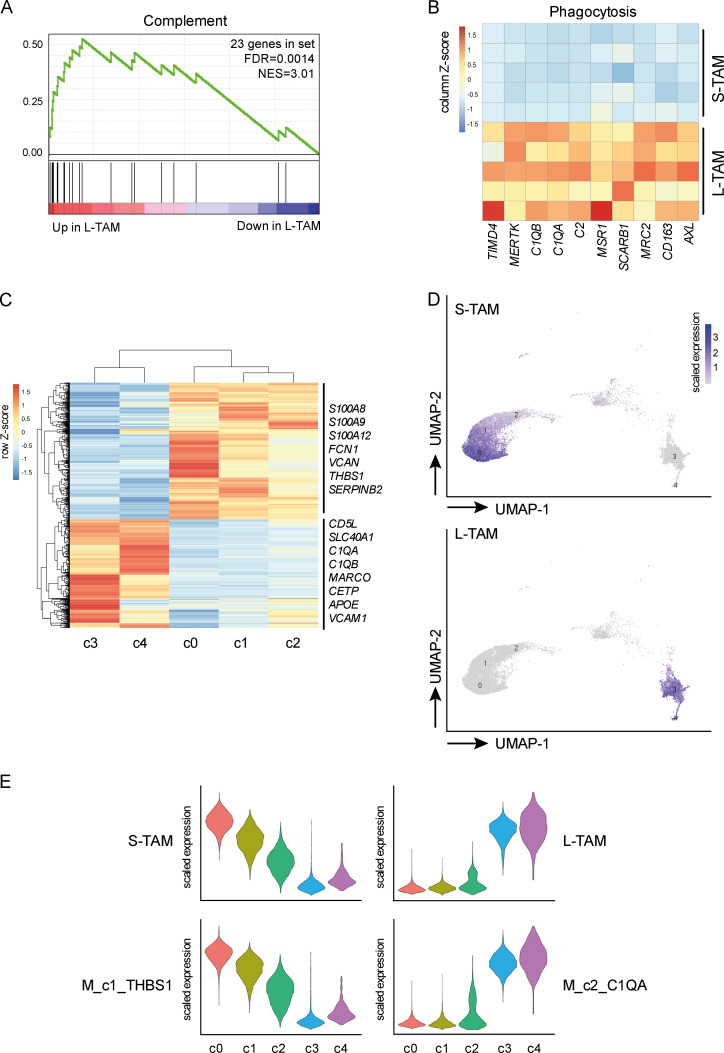
It has long been known that in vitro polarized macrophages differ in morphology. Stemming from a conventional immunohistology observation, we set out to test the hypothesis that morphology of tumor-associated macrophages (TAMs) in colorectal liver metastasis (CLM) represents a correlate of functional diversity with prognostic significance. Density and morphological metrics of TAMs were measured and correlated with clinicopathological variables. While density of TAMs did not correlate with survival of CLM patients, the cell area identified small (S-TAM) and large (L-TAM) macrophages that were associated with 5-yr disease-free survival rates of 27.8% and 0.2%, respectively (P < 0.0001). RNA sequencing of morphologically distinct macrophages identified LXR/RXR as the most enriched pathway in large macrophages, with up-regulation of genes involved in cholesterol metabolism, scavenger receptors, MERTK, and complement. In single-cell analysis of mononuclear phagocytes from CLM tissues, S-TAM and L-TAM signatures were differentially enriched in individual clusters. These results suggest that morphometric characterization can serve as a simple readout of TAM diversity with strong prognostic significance.


Conflict of interest statement

Disclosures: A. Mantovani reported personal fees from Ventana, Pierre Fabre, Verily, AbbVie, Astra Zeneca, Verseau Therapeutics, Compugen, Myeloid Therapeutics, Third Rock Venture, Imcheck Therapeutics, Ellipses, Novartis, Roche, Macrophage Pharma, Biovelocita, Merck, and Principia; grants from Novartis; and "other" from Cedarlane Laboratories Ltd, Hycult Biotechnology, eBioscience, BioLegend, ABCAM Plc, Novus Biologicals, Enzo Life (ex-Alexis Corp.), and Affymetrix outside the submitted work. He is the inventor of patents related to PTX3 and other innate immunity molecules and receives royalties for reagents related to innate immunity. No other disclosures were reported.

Figures

Figure 1.
Figure 1.
Morphological assessment of macrophages in human CLMs. (A) Representative whole slide immunohistochemistry of CD68+ cells in a CLM specimen. Dotted line indicates the tumor lesion. (B) CD68+ macrophages infiltrate both the PT area, IM, and tumor (TU) of CLM tissues. (C) Morphological features of macrophages in CLM. Three exemplificative types of macrophages in the same region are shown: small and round shaped, spiky and elongated, and big pancake-like. (D) Representative scheme of morphological features of macrophages analyzed (area and perimeter). Picture depicts the image analysis procedure. (E) Representative pictures of CD68+ macrophages in a control liver (symptomatic giant liver hemangioma, top) and a CLM specimen (bottom). (F) Both macrophage area and perimeter are significantly higher in CLM specimens compared with controls (i.e., patients who had undergone surgery for symptomatic giant liver hemangiomas). Represented are mean ± SEM of three pictures from each specimen (n = 4 specimens each group; *, P = 0.029 [area] and P = 0.028 [perimeter] by Mann-Whitney test). (G) Quantitation of macrophage area and perimeter in CLM specimens from patients with late recurrence (DFS >24 mo) or early recurrence (DFS <24 mo). Box plots give median, lower, and upper quartile values by the box and minimum and maximum values by the whiskers from three pictures for each specimen (n = 10 specimens each group; ***, P < 0.001 by unpaired t test). Scale bars: 2 mm (A), 100 µm (B), and 50 µm (C–E).
Figure 2.
Figure 2.
Macrophage morphology is a prognostic factor in human CLMs. (A) Representative whole-slide immunohistochemistry of CD163+ cells in a CLM specimen. Area and perimeter of macrophages were quantitated in three non-contiguous areas of the PT region (red line) and IM (black line) of curatively resected metastases from 101 metastatic CRC patients. Scale bar: 2 mm. (B) Kaplan-Meier curve of CD163+ macrophages in 95 CLM specimens. Represented are mean ± SEM of three pictures from each specimen (P = not significant [ns] by log-rank Mantel–Cox test). (C) ROC curves for density, area, and perimeter of CD163+ macrophages to predict disease recurrence in CLM patients. P = ns (density); **, P = 0.006 (area); P = ns (perimeter). AUC, area under the curve. (D) Kaplan-Meier curve of macrophage area in 101 CLM specimens (S-TAM = average area below ROC cutoff value; L-TAM = average area above ROC cutoff value; represented are mean ± SEM of three pictures from each specimen; ***, P < 0.0001 by log-rank Mantel–Cox test). (E) Forest plot showing the results of multivariate regression analysis for DFS in 101 CLM patients. The x axis represents the HR for recurrence with the reference line (dashed), HRs (circles), and 95% CI (whiskers). ***, P < 0.001 by multiple regression analysis. Liver involvement: bilateral versus unilateral. Time of diagnosis: synchronous versus metachronous. N (node) and T (tumor) refer to the primary tumor. CEA, carcinoembryonic antigen. CTX, chemotherapy.
Figure S1.
Figure S1.
Measurement of macrophage morphological metrics. (A) Density (percentage of immunoreactive area [IRA%]) of CD68+ macrophages correlates with density of CD163+ macrophages (n = 5, r = 0.9, P = 0.083 by Spearman analysis). (B) Expression of CD68 and CD163 on liver macrophages from one representative CLM specimen. CD163 (right) is more uniformly distributed on the cell surface and not intracellularly as CD68 (left). Scale bars: 100 µm (top panels); 50 µm (bottom panels). (C) Distribution of macrophage morphometric indexes (area and perimeter) in 101 patients. (D–G) Prognostic value of macrophage area at the IM in 96 CLM patients. Distribution of macrophage area (D) and correlation between area of macrophages in PT and IM regions (E) are depicted. ***, P < 0.001 by Mann-Whitney (D) and ***, P < 0.001 by Spearman correlation analysis (E). (F) ROC curve for area to predict disease recurrence for 96 CLM patients. (G) Kaplan-Meier curve of macrophage area in the IM region in 96 CLM specimens (S-TAM = average area below median value; L-TAM = average area above median value; ***, P = 0.0008 by log-rank Mantel–Cox test).
Figure S2.
Figure S2.
Experimental workflow to sort small and large macrophages from CLM tissues. (A) Schematic overview of the experimental approach to sequence large and small macrophages from CLM specimens. (B) Gating strategy to sort macrophages from five CLM specimens. Small macrophages (S-TAMs) were sorted as alive CD45+/CD11b+/CD66b/CD14dim/CD163dim/FSClo and large macrophages (L-TAMs) as CD45+/CD11b+/CD66b/CD14dim/CD163hi/FSChi cells. Bottom panels confirm physical parameters of the small and large populations sorted. FSC-A, forward scatter area; FSC-W, forward scatter width; SSC-A, side scatter area.
Figure 3.
Figure 3.
Morphology as a correlate of lipid metabolism in human CLMs. (A) Representative S-TAMs and L-TAMs sorted from one CLM specimen, cytospun, and stained with Diff-Quick. Scale bar: 20 µm. (B) Volcano plot of the expression profile of L-TAMs and S-TAMs sorted from five CLM specimens. Horizontal dashed line shows FDR (−log10 adjusted P value) 0.05; vertical continuous lines show log2 fold change (logFC) between −1.5 and 1.5. (C) Pathways enriched in L-TAMs versus S-TAMs from five CLM specimens. Z-score is shown on the x axis. For each pathway, the number of genes modulated is reported. (D) GSEA results showing lipoprotein metabolism as a significantly enriched biological process in L-TAMs compared to S-TAMs from five CLM specimens. The green curve represents the enrichment score, showing the measure to which the genes are overrepresented at the top or bottom of a ranked list of genes. Vertical black bars indicate the position in the ranked list of each gene, belonging to the gene set. Genes positioned in the red and blue sides are up-regulated and down-regulated, respectively, in large macrophages compared with small ones. Number of genes in set (genes = 22; FDR = 0.019) and normalized enrichment score (NES = 2.29) are shown. (E) Heatmap representing selected differentially expressed genes (−1.5 < LogFC > 1.5; FDR < 0.05) between L-TAMs and S-TAMs from five CLM specimens. Genes related to cholesterol and lipid metabolism are shown. (F) Representative pictures of immunohistochemical staining of macrophages expressing ApoE (top) and LXR (bottom) in CLM specimens. ApoE is expressed both in hepatocytes (left) and macrophages (right). Scale bars: 50 µm (top panels); 20 µm (bottom panels). (G) Flow cytometry analysis of cholesterol transporters ABCA1, ABCG1, ApoE, and CD36 in L-TAMs and S-TAMs isolated from four CLM specimens. Graphs represent mean ± SEM of four CLM samples analyzed in different experiments. *, P < 0.05 by Mann-Whitney test. (H and I) Lipid content, assessed as MFI of LipidTOX and lipid uptake, obtained as MFI of BODIPY. Bars represent mean + SEM of four different samples. *, P < 0.05 by Mann-Whitney test.
Figure S3.
Figure S3.
Profile of small and large macrophages. (A) Correlation matrix of the whole dataset of genes in small and large macrophages from five CLM patients. Heatmap displays Pearson correlation coefficients according to the color code (light blue for low correlation, dark blue for high correlation). (B) Immunofluorescence on a CLM specimen showing a macrophage (CD68 in red) rich in ApoE protein (in green). Scale bars: 20 µm. (C) Kaplan-Meier survival curves of breast cancer patients from public datasets (GSE1456), stratified by first and last quartiles of NR1H3 expression score (LXR gene). Curves show disease-specific survival (top) and DFS (bottom). P = 0.09 (top panel) and *, P = 0.043 by Gehan-Breslow-Wilcoxon test. (D) Representative FACS plots of lipid transporters, ApoE, CD36, LipidTOX (lipid content), and BODIPY (lipid uptake) in S-TAMs and L-TAMs. (E) UMAP projection of myeloid cells from PT (n = 3) and distal (n = 3) human livers. Only macrophage clusters (c0, c1, c2, c3, and c4) are shown (n = 13,768 cells). Each dot represents an individual cell. (F) Bar graph showing the relative abundance of each macrophage cluster respect to the total dataset in distal and PT regions.
Figure 4.
Figure 4.
Morphology identifies individual populations of macrophages in CLM. (A and B) GSEA (Reactome) results showing complement as a significantly enriched biological process in L-TAMs compared with S-TAMs from five CLM specimens. Number of genes in complement gene set (genes = 23; FDR = 0.0014) and normalized enrichment score (NES = 3.01) are shown (A). Heatmaps showing up-regulation of phagocytosis (MERTK, MSR1, C1QA, and C1QB) in L-TAM samples. Columns represent signature genes. Rows represent individual samples. Gene expression values are reported as normalized trimmed mean of M values (B). (C–E) scRNAseq of three CLM specimens. Heatmap showing differential transcriptional profiles of five macrophage clusters; c0-c1-c2 were compared with c3-c4. Differentially expressed genes are shown (n = 1,282; adjusted P value < 0.05). Selected relevant genes are reported. Columns represent macrophage clusters, and rows represent differentially expressed genes (C). UMAP projections showing unsupervised Seurat-guided clustering of macrophage clusters colored by the expression score of L-TAM and S-TAM signatures (D). Violin plots showing expression values of selected genes in S-TAM and L-TAM from CLM specimens compared with clusters from HCC (E).

Comment in

References

    1. A-Gonzalez N., Quintana J.A., García-Silva S., Mazariegos M., González de la Aleja A., Nicolás-Ávila J.A., Walter W., Adrover J.M., Crainiciuc G., Kuchroo V.K., et al. . 2017. Phagocytosis imprints heterogeneity in tissue-resident macrophages. J. Exp. Med. 214:1281–1296. 10.1084/jem.20161375 - DOI - PMC - PubMed
    1. Ballotta V., Driessen-Mol A., Bouten C.V., and Baaijens F.P.. 2014. Strain-dependent modulation of macrophage polarization within scaffolds. Biomaterials. 35:4919–4928. 10.1016/j.biomaterials.2014.03.002 - DOI - PubMed
    1. Bekkering S., Arts R.J.W., Novakovic B., Kourtzelis I., van der Heijden C.D.C.C., Li Y., Popa C.D., Ter Horst R., van Tuijl J., Netea-Maier R.T., et al. . 2018. Metabolic Induction of Trained Immunity through the Mevalonate Pathway. Cell. 172:135–146.e9. 10.1016/j.cell.2017.11.025 - DOI - PubMed
    1. Bonavita E., Gentile S., Rubino M., Maina V., Papait R., Kunderfranco P., Greco C., Feruglio F., Molgora M., Laface I., et al. . 2015. PTX3 is an extrinsic oncosuppressor regulating complement-dependent inflammation in cancer. Cell. 160:700–714. 10.1016/j.cell.2015.01.004 - DOI - PubMed
    1. Cassetta L., and Pollard J.W.. 2018. Targeting macrophages: therapeutic approaches in cancer. Nat. Rev. Drug Discov. 17:887–904. 10.1038/nrd.2018.169 - DOI - PubMed

Publication types

MeSH terms

Substances