. 2021 Feb 11;137(6):788-800.
doi: 10.1182/blood.2019004713.

Identification of MALT1 feedback mechanisms enables rational design of potent antilymphoma regimens for ABC-DLBCL

Affiliations

Identification of MALT1 feedback mechanisms enables rational design of potent antilymphoma regimens for ABC-DLBCL

Lorena Fontan et al. Blood. .

Abstract

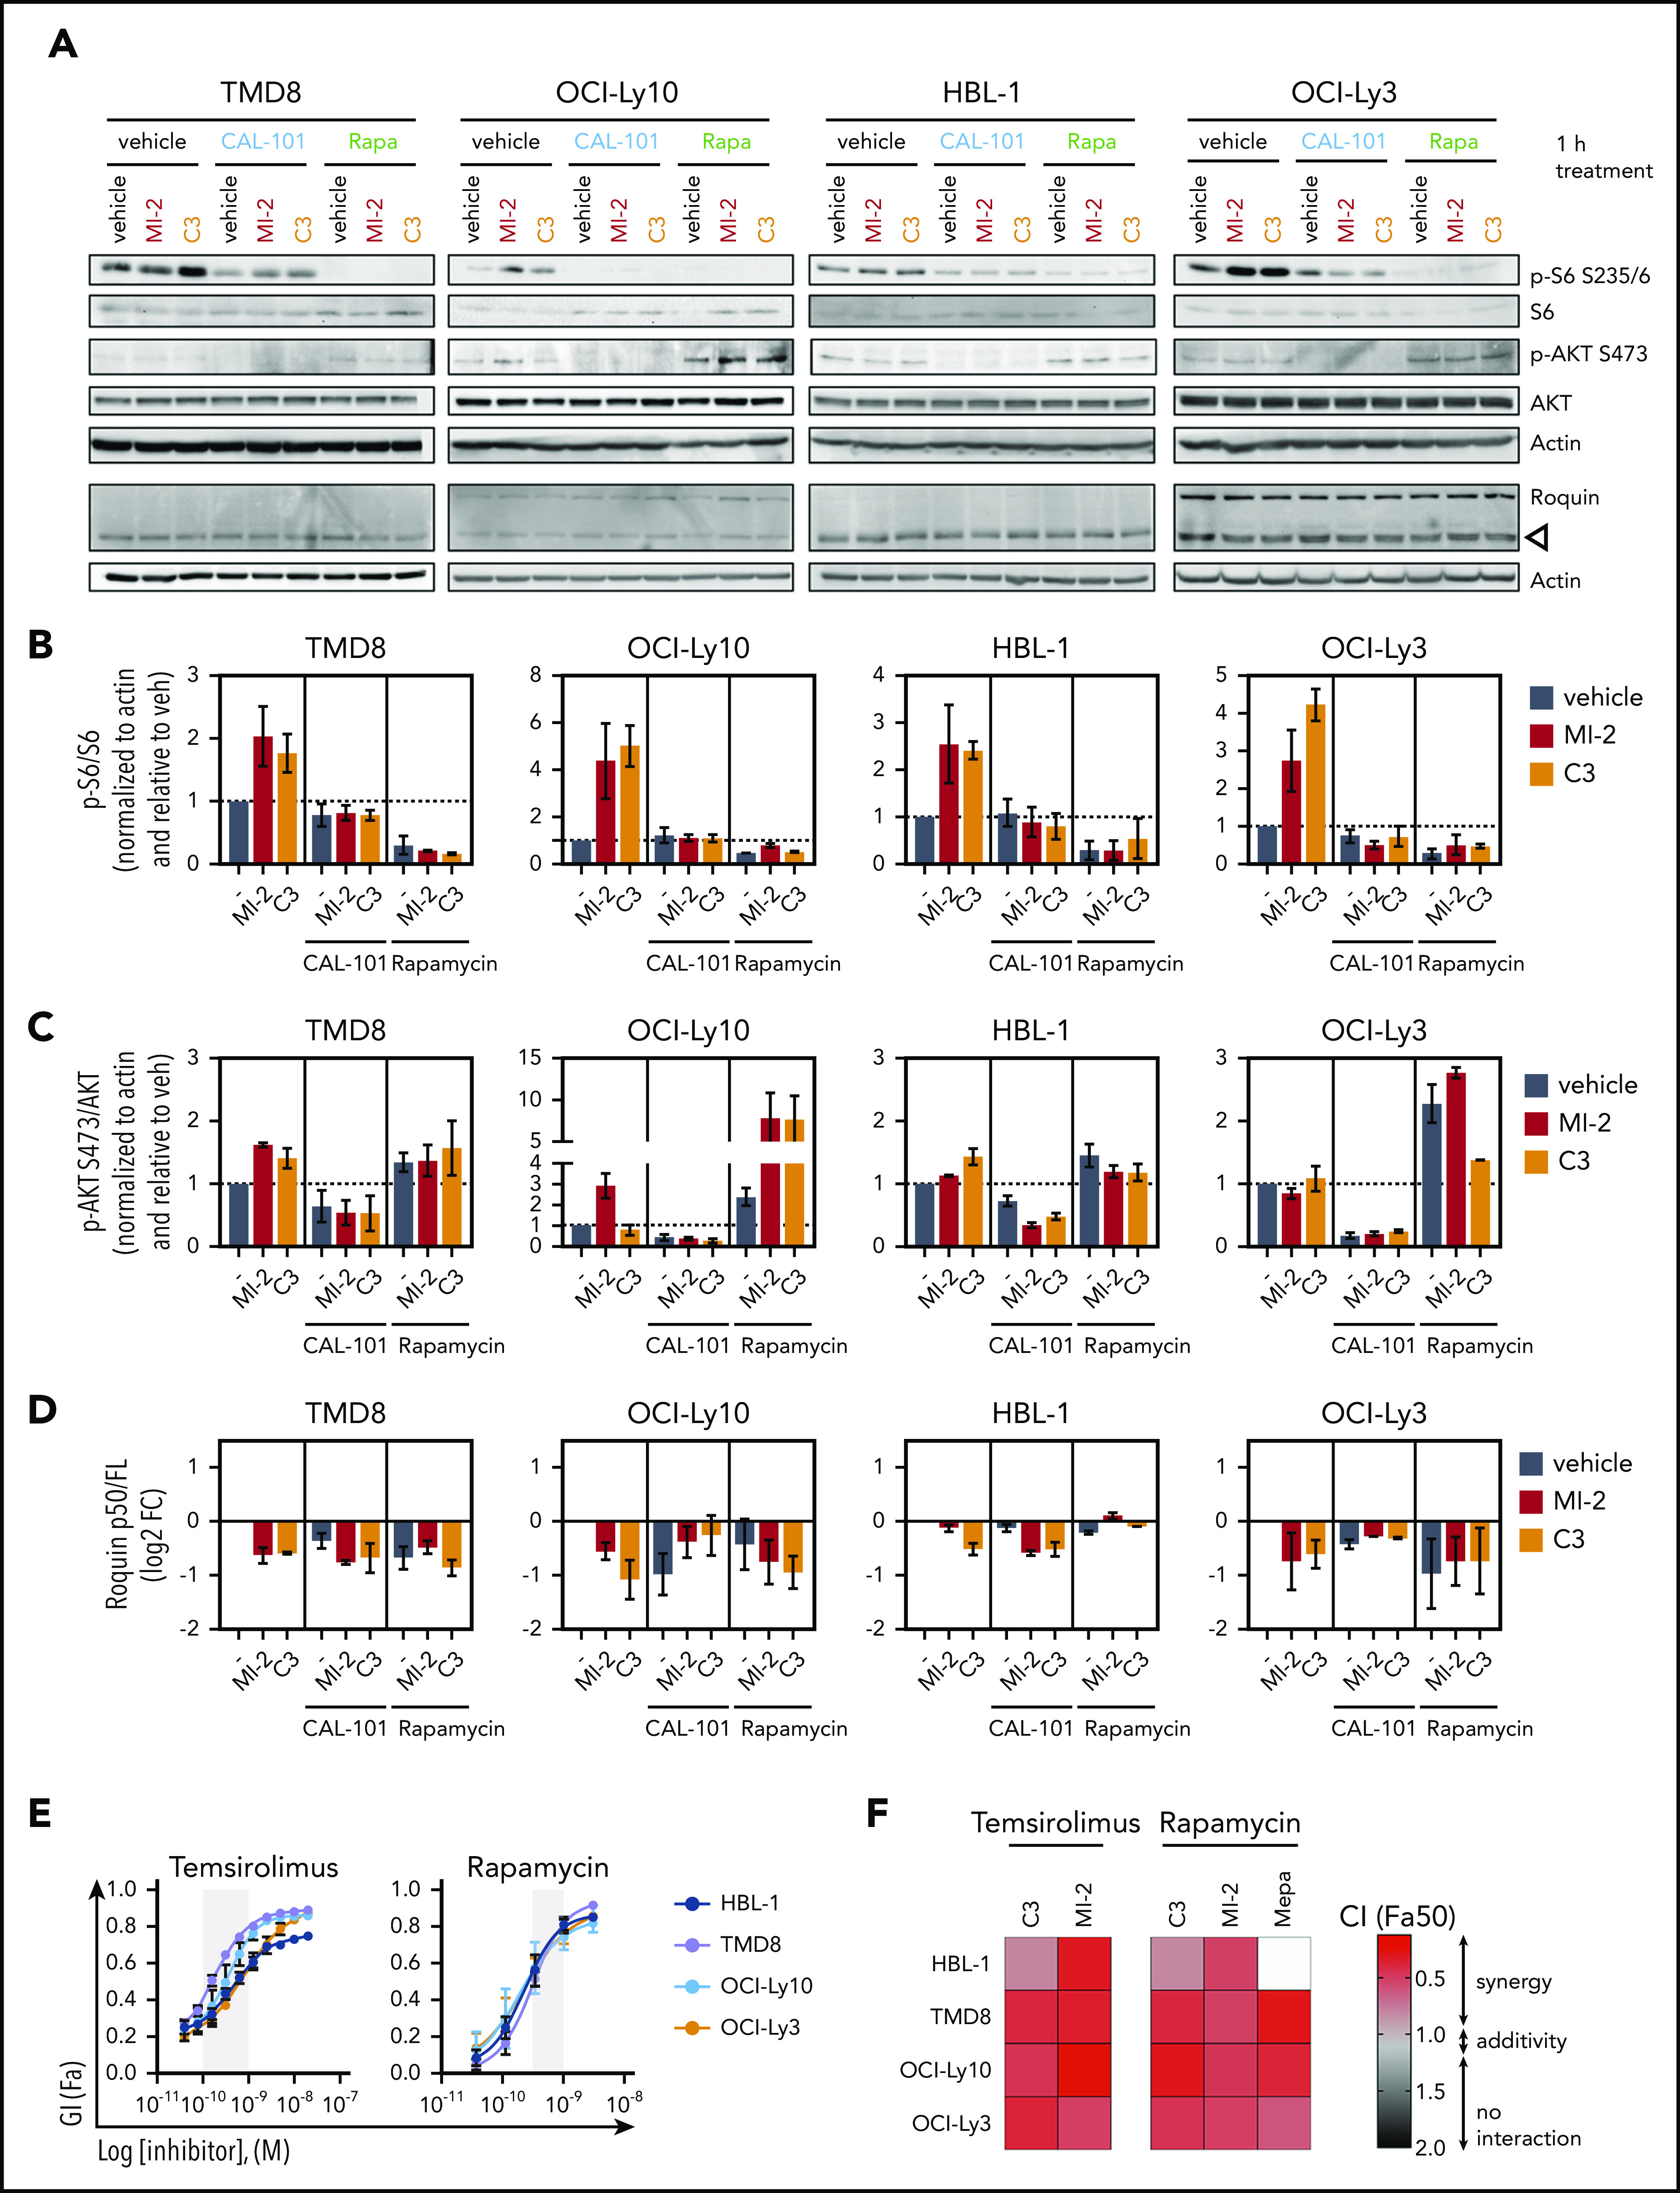
MALT1 inhibitors are promising therapeutic agents for B-cell lymphomas that are dependent on constitutive or aberrant signaling pathways. However, a potential limitation for signal transduction-targeted therapies is the occurrence of feedback mechanisms that enable escape from the full impact of such drugs. Here, we used a functional genomics screen in activated B-cell-like (ABC) diffuse large B-cell lymphoma (DLBCL) cells treated with a small molecule irreversible inhibitor of MALT1 to identify genes that might confer resistance or enhance the activity of MALT1 inhibition (MALT1i). We find that loss of B-cell receptor (BCR)- and phosphatidylinositol 3-kinase (PI3K)-activating proteins enhanced sensitivity, whereas loss of negative regulators of these pathways (eg, TRAF2, TNFAIP3) promoted resistance. These findings were validated by knockdown of individual genes and a combinatorial drug screen focused on BCR and PI3K pathway-targeting drugs. Among these, the most potent combinatorial effect was observed with PI3Kδ inhibitors against ABC-DLBCLs in vitro and in vivo, but that led to an adaptive increase in phosphorylated S6 and eventual disease progression. Along these lines, MALT1i promoted increased MTORC1 activity and phosphorylation of S6K1-T389 and S6-S235/6, an effect that was only partially blocked by PI3Kδ inhibition in vitro and in vivo. In contrast, simultaneous inhibition of MALT1 and MTORC1 prevented S6 phosphorylation, yielded potent activity against DLBCL cell lines and primary patient specimens, and resulted in more profound tumor regression and significantly improved survival of ABC-DLBCLs in vivo compared with PI3K inhibitors. These findings provide a basis for maximal therapeutic impact of MALT1 inhibitors in the clinic, by disrupting feedback mechanisms that might otherwise limit their efficacy.


Conflict of interest statement

Conflict-of-interest disclosures: A.M. receives research support from Janssen Pharmaceuticals and is a consultant for Epizyme and Constellation. The remaining authors declare no competing financial interests.

Figures

None
Graphical abstract
Figure 1.
Figure 1.
Loss-of-function MALT1i screen identifies modulators of MALT1i response in ABC-DLBCL. (A) Scheme of screen experimental design. (B) Correlation matrix of normalized shRNA read counts for 2 independent replicate experiments. Gene-set enrichment analysis of a list of “pan-essential genes” in Control vs Input (C) and MI-2–treated vs DMSO-treated cells (D). (E) Plot of gene enrichment MI-2–treated vs DMSO-treated cells ranked by RIGER score. Genes for relevant enriched functional networks are shown. (F) Correlation plot of gene RIGER scores in MI-2–treated cells vs DMSO-treated cells in 2 independent screen replicates. Plotted 500 top and bottom ranked genes (average of 2 replicates). Validation of screen targets using shRNAs against CARD11 (G) or single guide (sg) RNA against TNFAIP3 (H). The effect of gene knockdown on IC50 of MI-2 was assessed by cell count by flow cytometry of live GFP+ cells. Gene knockdown was evaluated by western blot. EV, empty vector; shNT, nontargeting shRNA.
Figure 2.
Figure 2.
BCR-PI3K-TLR is a major determinant of sensitivity/resistance to MALT1 inhibitors. (A) Graph representing significantly enriched Kyoto Encyclopedia of Genes and Genomes pathways among genes whose knockdown decreased (A) and increased (B) sensitivity to MI-2 using STRING. (C) Graph picturing modulators of response to MALT1i significantly enriched in MI-2 shRNA combinatorial screen. Depleted (blue) or enriched (red) shRNAs in MI-2 vs. DMSO-treated cells and their relative position in the BCR/PI3K/TLR pathway network.
Figure 3.
Figure 3.
MALT1i is highly synergistic with PI3K inhibition in ABC-DLBCL. (A) Dose response for individual drugs against signaling hubs in the BCR, PI3K, and TLR pathways in 4 ABC-DLBCL lines. Gray shaded area represents on-target dose. (B) Heat map of CIs at fraction affected 50% (Fa50) for the indicated drugs in combination with C3 or MI-2 in 4 ABC-DLBCL cell lines. For white boxes, CI50 (combination index) was not calculated because GI50 (growth inhibition) was not reached.
Figure 4.
Figure 4.
MALT1/PI3Kδ simultaneous inhibition synergistically kills ABC-DLBCL in vitro and in vivo. Apoptosis for CAL-101 combinations with structurally unrelated MALT1 inhibitors MI-2 (A) and C3 (B) was studied using annexin V/DAPI staining in the indicated cell lines. Cells were treated for 4 days, and the following drug concentrations were used: 1 μM CAL-101, 250 nM MI-2 (100 nM for HBL-1), and 1 μM C3. Results are the percentage of cells ± standard error of the mean (SEM) of ≥2 independent experiments in triplicate. CFSE dilution assay results for CAL-101 combinations with MI-2 (C) or C3 (D) in the indicated cell lines, treated as above. The y-axis shows CFSE mean fluorescence intensity (MFI) fold to vehicle ± SEM of ≥2 independent experiments in triplicate. (E) Dosing schedule of MI-2/CAL-101 combinations in vivo. TTD, time to death. (F) Tumor growth curve for TMD8 xenografts (n = 6 per group). Mice were treated with 25 mg/kg per day of MI-2, 30 mg/kg per day of CAL-101, their combination, or the same volume of vehicle for 21 days, following the schedule in (E). (G) Representative western blot results for the indicated targets in TMD8 xenografted tumors treated long-term (21 days) with vehicle, MI-2, CAL-101, or their combination (n = 3 per group). (H) Quantification of western blots in (G) for all mice (n = 6 per group). Protein levels were normalized to actin and are relative to the average of vehicle-treated mice. (I) Short-term treatment schedule of TMD8 xenografted mice. Dosing as in (F). (J) Western blot results for the indicated targets in TMD8 xenografted tumors treated short-term (28 hours) with vehicle, MI-2, CAL-101, or their combination (n = 3 per group). (K) Quantification of results in (J). Protein levels were normalized to actin and are relative to the average of vehicle-treated mice. *P < .05, **P < .01, ***P < .001, 1-way analysis of variance corrected for multiple comparisons 5% FDR. FC, fold change; ns, not significant (P > .05).
Figure 5.
Figure 5.
MALT1/MTORC1 combinations are highly synergistic against ABC-DLBCL. (A) ABC-DLBCL cell lines were treated for 1 hour with MI-2 (250 nM), C3 (1 μM), CAL-101 (1 μM), rapamycin (Rapa; 1 nM), or their combinations, as indicated, and proteins were extracted. Levels of phosphorylated and total proteins were evaluated by western blot. (B-D) Quantification of p-6/S6 levels (B), p-AKT/AKT levels (C) and Roquin p50/full length (D) for experiments in (A), respectively. Protein levels were normalized to actin and are relative to the average of vehicle-treated cells. Data are average ± standard error of the mean (SEM) of ≥2 independent experiments. (E) Dose response for temsirolimus (left panel) and rapamycin (right panel) in 4 ABC-DLBCL lines. Gray shaded area represents on-target dose. (F) Heat map of CIs at fraction affected 50% (Fa50) for C3 or MI-2 with temsirolimus or rapamycin in the indicated cell lines. (G-H) ZIP δ-score synergy plots for rapamycin in combination with MI-2 (G) or C3 (H) in the indicated cell lines and primary ABC-DLBCL specimens treated ex vivo in 3D organoids. *P < .05, **P < .01, ***P < .001, 1-way analysis of variance corrected for multiple comparisons 5% FDR. ns, not significant (P > .05).
Figure 5.
Figure 5.
MALT1/MTORC1 combinations are highly synergistic against ABC-DLBCL. (A) ABC-DLBCL cell lines were treated for 1 hour with MI-2 (250 nM), C3 (1 μM), CAL-101 (1 μM), rapamycin (Rapa; 1 nM), or their combinations, as indicated, and proteins were extracted. Levels of phosphorylated and total proteins were evaluated by western blot. (B-D) Quantification of p-6/S6 levels (B), p-AKT/AKT levels (C) and Roquin p50/full length (D) for experiments in (A), respectively. Protein levels were normalized to actin and are relative to the average of vehicle-treated cells. Data are average ± standard error of the mean (SEM) of ≥2 independent experiments. (E) Dose response for temsirolimus (left panel) and rapamycin (right panel) in 4 ABC-DLBCL lines. Gray shaded area represents on-target dose. (F) Heat map of CIs at fraction affected 50% (Fa50) for C3 or MI-2 with temsirolimus or rapamycin in the indicated cell lines. (G-H) ZIP δ-score synergy plots for rapamycin in combination with MI-2 (G) or C3 (H) in the indicated cell lines and primary ABC-DLBCL specimens treated ex vivo in 3D organoids. *P < .05, **P < .01, ***P < .001, 1-way analysis of variance corrected for multiple comparisons 5% FDR. ns, not significant (P > .05).
Figure 6.
Figure 6.
MALT1/MTORC1 inhibition suppresses growth of ABC-DLBCL through decreased proliferation and increased cell death. Apoptosis for rapamycin (Rapa) combinations with structurally unrelated MALT1 inhibitors MI-2 (A) and C3 (B) was studied using annexin V/DAPI staining in the indicated cell lines. Cells were treated for 4 days, and the following drug concentrations were used: 1 nM Rapa, 250 nM MI-2 (100 nM for HBL-1), and 1 μM C3. Results are percentage of cells ± standard error of the mean (SEM) of ≥2 independent experiments in triplicate. CFSE dilution assay results for rapamycin combinations with MI-2 (C) or C3 (D) in the indicated cell lines, treated as above. The y-axis shows CFSE mean fluorescence intensity fold to vehicle ± SEM of ≥2 independent experiments in triplicate. (E) OCI-Ly3 cells were seeded in 2-dimensional (2D) or 3D conditions, and their response to C3, rapamycin, or their combination was evaluated using Calcein-AM (for live cells) and propidium iodide staining (for dead cells). (F) Plot for live/dead quantification of OCI-Ly3 cells grown in 2D vs 3D conditions for 6 days. Results are percentage of cells ± SEM of 4 replicates. *P < .05, **P < .01, ***P < .001, 1-way analysis of variance corrected for multiple comparisons 5% FDR. ns, not significant (P > .05).
Figure 7.
Figure 7.
MTORC1-MALT1i combination promoted ABC-DLBCL regression in vivo. (A) Experimental scheme of the in vivo MI-2/rapamycin combination experiment. (B) Tumor growth curve for TMD8 xenografts (n = 5 per group). Mice were treated with vehicle, 25 mg/kg per day of MI-2, 1 mg/kg per day of rapamycin, or their combination for 15 days. (C) Change in tumor volume at day 15 compared with day 0 for each mouse. The p values were determined using analysis of variance and Tukey's multiple-comparisons test. (D) Survival curves for mice in (B). The P values were calculated using log-rank Bonferroni-Hochberg-adjusted survival analysis. (E) Median survival for the different treatment groups in (D). (F) Dosing schedule for a short-term experiment to evaluate the effect of the combinations in signaling. Arrows, dosing event. (G) Immunohistochemistry was used to study p-S6-S235/6 levels in TMD8 xenografted mice that were treated twice (28 hours) with the indicated inhibitors and their combinations, as indicated in (F). Samples were stained with anti-phospho-S6 antibody. (H) p-S6-S235/6 levels in TMD8 xenografted tumors treated with the indicated drugs and combinations. Data correspond to 5 high-powered fields per tumor in 3 or 4 mice per treatment group. *P < .05, **P < .01, ****P < .0001. ns, not significant (P > .05).

Comment in

References

    1. Mlynarczyk C, Fontán L, Melnick A. Germinal center-derived lymphomas: the darkest side of humoral immunity. Immunol Rev. 2019;288(1):214-239. - PMC - PubMed
    1. Compagno M, Lim WK, Grunn A, et al. . Mutations of multiple genes cause deregulation of NF-kappaB in diffuse large B-cell lymphoma. Nature. 2009;459(7247):717-721. - PMC - PubMed
    1. Davis RE, Ngo VN, Lenz G, et al. . Chronic active B-cell-receptor signalling in diffuse large B-cell lymphoma. Nature. 2010;463(7277):88-92. - PMC - PubMed
    1. Lenz G, Wright GW, Emre NC, et al. . Molecular subtypes of diffuse large B-cell lymphoma arise by distinct genetic pathways. Proc Natl Acad Sci USA. 2008;105(36):13520-13525. - PMC - PubMed
    1. Ngo VN, Young RM, Schmitz R, et al. . Oncogenically active MYD88 mutations in human lymphoma. Nature. 2011;470(7332):115-119. - PMC - PubMed

Publication types

MeSH terms

Substances

LinkOut - more resources