. 2020 Aug 21;15(8):2137-2153.
doi: 10.1021/acschembio.0c00339. Epub 2020 Aug 12.

Robust Sequence Determinants of α-Synuclein Toxicity in Yeast Implicate Membrane Binding

Affiliations

Robust Sequence Determinants of α-Synuclein Toxicity in Yeast Implicate Membrane Binding

Robert W Newberry et al. ACS Chem Biol. .

Abstract

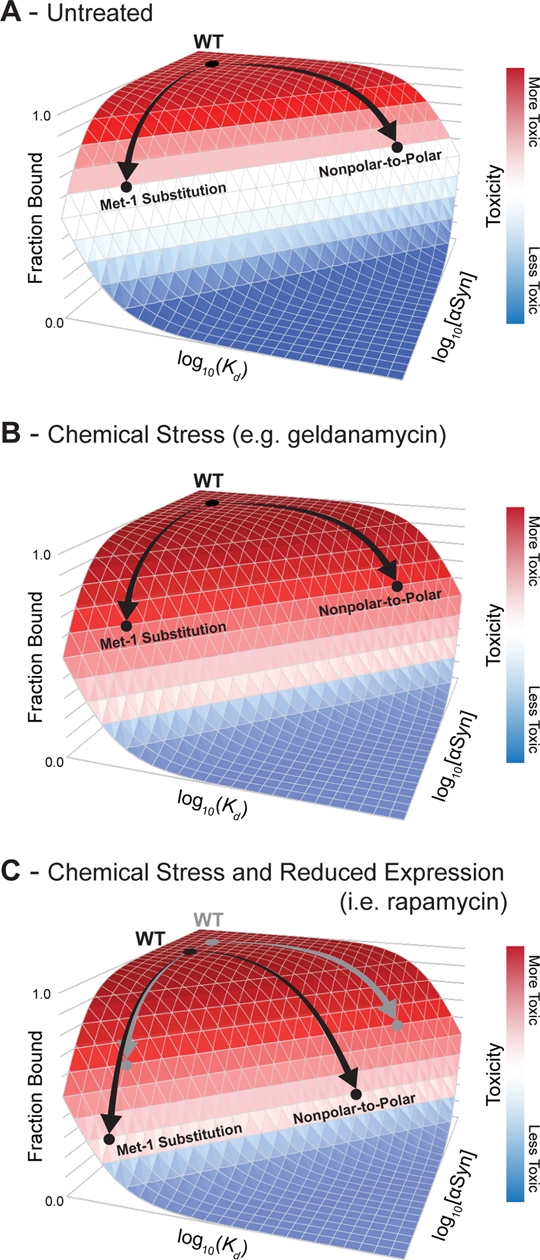
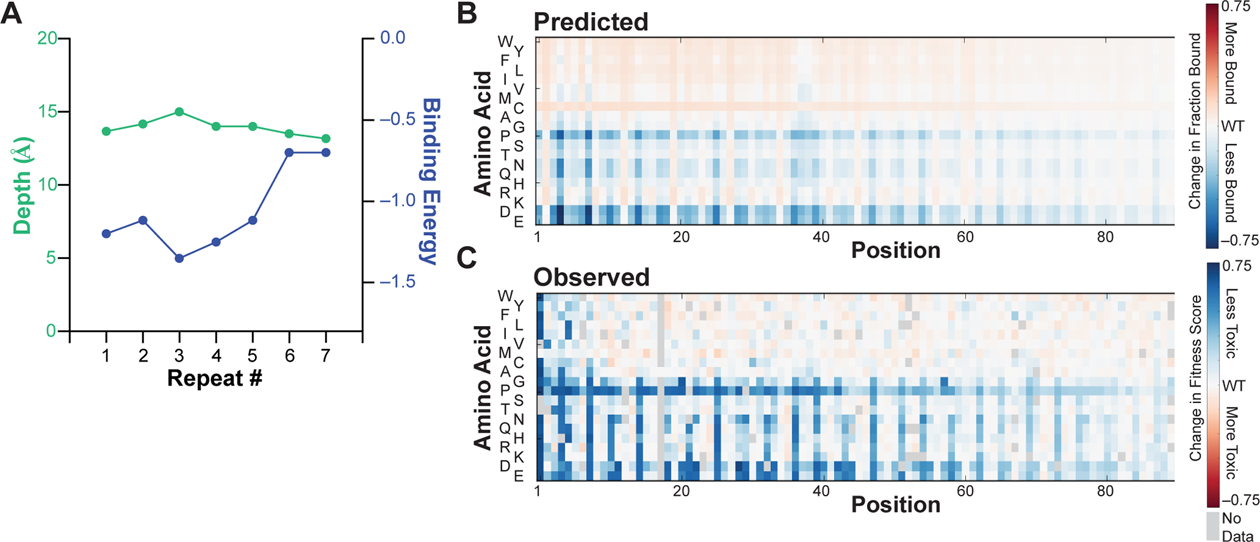
Protein conformations are shaped by cellular environments, but how environmental changes alter the conformational landscapes of specific proteins in vivo remains largely uncharacterized, in part due to the challenge of probing protein structures in living cells. Here, we use deep mutational scanning to investigate how a toxic conformation of α-synuclein, a dynamic protein linked to Parkinson's disease, responds to perturbations of cellular proteostasis. In the context of a course for graduate students in the UCSF Integrative Program in Quantitative Biology, we screened a comprehensive library of α-synuclein missense mutants in yeast cells treated with a variety of small molecules that perturb cellular processes linked to α-synuclein biology and pathobiology. We found that the conformation of α-synuclein previously shown to drive yeast toxicity-an extended, membrane-bound helix-is largely unaffected by these chemical perturbations, underscoring the importance of this conformational state as a driver of cellular toxicity. On the other hand, the chemical perturbations have a significant effect on the ability of mutations to suppress α-synuclein toxicity. Moreover, we find that sequence determinants of α-synuclein toxicity are well described by a simple structural model of the membrane-bound helix. This model predicts that α-synuclein penetrates the membrane to constant depth across its length but that membrane affinity decreases toward the C terminus, which is consistent with orthogonal biophysical measurements. Finally, we discuss how parallelized chemical genetics experiments can provide a robust framework for inquiry-based graduate coursework.


Figures

Figure 1.
Figure 1.
Previously mapped sequence–toxicity landscape of α-Synuclein identifies a toxic molecular conformation. (A) Fitness scores (defined as the slope of the line describing change in log-transformed variant frequencies over time, represented by a red-white-blue color scale) for expression of α-Synuclein missense mutants in yeast. (B) Average fitness scores of mutants with hydrophobic (W, Y, F, L, I, V, M, C, A; red), polar (S, T, N, Q, H, R, K, D, E; blue), or proline (green) residues. (C) The structural model derived from the sequence–toxicity landscape in panel A: an extended, membrane-bound 11/3-helix with increasing dynamics toward the C terminus.These results were obtained previously and are revisited here to provide context for the effects of cellular perturbations on the fitness landscape.
Figure 2.
Figure 2.
Chemical genetics approach to probe sequence and structural determinants of α-Synuclein toxicity. A pooled library of yeast cells, each expressing a different missense variant of α-Synuclein (represented by yeast cells with differently colored outlines), is treated with a variety of small molecules to perturb cellular proteostasis (represented by different intracellular shading [i.e., white vs. grey]). Induction of α-Synuclein expression creates a selective pressure that causes changes in the relative frequency of each missense variant in the population. This change in frequency can be quantified by counting the number of occurrences of each variant in the population over time using deep sequencing. The resulting sequence–toxicity landscape, where the relative toxicity of each variant is represented by a red-white-blue color scale, reveals structural features that can implicate specific conformational states as drivers of toxicity.
Figure 3.
Figure 3.
Conformational signatures of toxic α-Synuclein species in yeast are robust to diverse chemical perturbations. (A) Average fitness scores of mutants with polar (S, T, N, Q, H, R, K, D, E) or proline residues in untreated cells. These data were collected previously and are shown here for comparison. (B) Average fitness scores of mutants with polar residues when assayed in yeast cells perturbed by small molecules. Each column reflects the average fitness scores of mutants with polar substitutions at a given position. Each row reflects the fitness scores for a different treatment. Fitness scores are normalized for comparison and shown as a red-white-blue color scale. Across all conditions, α-helical periodicity in the mutational signature is retained.
Figure 4.
Figure 4.
Fitness scores of yeast expressing α-Synuclein missense variants obtained in the presence of the compounds in Table 1, relative to those obtained in untreated controls.
Figure 5.
Figure 5.
(A) Fitness scores of cells expressing α-Synuclein mutants [labeled as (position, amino-acid substitution)] obtained in the presence of rapamycin relative to untreated controls. (B) Helical wheel of α-Synuclein depicting the relative orientation of each residue in the 11-residue repeat. Schematic coloring reflects the physicochemical properties of the moiety/environment (blue: positively charged; red: negatively charged; purple: polar; grey: nonpolar). (C) Volcano plot describing changes in fitness score induced by rapamycin treatment, averaged over equivalent mutations in each of the seven repeating 11-residue segments, labeled as (position, amino-acid substitution). The significance of these changes was then determined from their z-scores, assuming a normal distribution, yielding the p-values shown. A 5% false discovery rate threshold is shown, which identifies the significance value above which 5% of the values would be falsely predicted as significantly different in the presence of compound; this threshold was determined by Benjamini-Hochberg method.
Figure 6.
Figure 6.
Cellular toxicity (represented by a red-white-blue color scale) depends on the membrane-bound population of α-Synuclein. (A) In untreated cells, WT α-Synuclein binds to cellular membranes above a critical threshold for toxicity. Mutations can reduce toxicity by decreasing the membrane-bound population of α-Synuclein, either by decreasing membrane affinity (e.g., by introducing polar amino acids on the membrane-binding face) or reducing α-Synuclein expression (e.g., by substituting Met-1). (B) Chemical stresses increase sensitivity to α-Synuclein toxicity, so mutations that reduce toxicity in untreated cells are less effective at reducing toxicity under general chemical stress. (C) Because rapamycin reduces protein expression (black arrows relative to gray arrows), the combination of rapamycin and specific α-Synuclein mutations reduces membrane binding sufficiently to overcome the increased sensitivity caused by compound toxicity.
Figure 7.
Figure 7.
A thermodynamic model for α-Synuclein–membrane interactions reveals determinants of decreasing mutational sensitivity. (A) The depth of insertion (green) and transfer free energy (blue) of each repeated 11-residue membrane-binding segment of α-Synuclein were estimated by optimizing correlation between experimental toxicity scores and changes in the membrane-bound population of α-Synuclein predicted based on the energy required to transfer an amphiphilic helix with the appropriate sequence to a particular depth within the lipid bilayer. See text for additional details. (B) Predicted changes in membrane-bound α-Synuclein caused by missense mutations, based on the optimal penetration depth and transfer free energy of the WT protein determined in panel A and the depth-dependent transfer free energy of each amino acid. See text for additional details. Relative change in fraction bound is denoted as a red-white-blue color scale. (C) Observed changes in yeast toxicity (represented by a red-white-blue color scale) caused by α-Synuclein missense mutations. The Pearson R2 correlation coefficient between all predicted and observed scores is 0.57.

References

    1. Schmiedel JM, and Lehner B (2019) Determining protein structures using deep mutagenesis. Nat. Genet 51, 1177–1186. - PMC - PubMed
    1. Rollins NJ, Brock KP, Poelwijk FJ, Stiffler MA, Gauthier NP, Sander C, and Marks DS (2019) Inferring protein 3D structure from deep mutation scans. Nat. Genet 51, 1170–1176. - PMC - PubMed
    1. Adkar BV, Tripathi A, Sahoo A, Bajaj K, Goswami D, Chakrabarti P, Swarnkar MK, Gokhale RS, and Varadarajan R (2012) Protein model discrimination using mutational sensitivity derived from deep sequencing. Structure 20, 371–381. - PubMed
    1. Sahoo A, Khare S, Devanarayanan S, Jain PC, and Varadarajan R (2015) Residue proximity information and protein model discrimination using saturation-suppressor mutagenesis. Elife 4, e09532. - PMC - PubMed
    1. Fowler DM, and Fields S (2014) Deep mutational scanning: a new style of protein science. Nat. Methods 11, 801–807. - PMC - PubMed

Publication types

Substances