. 2020 Sep 15;92(18):12538-12547.
doi: 10.1021/acs.analchem.0c02389. Epub 2020 Aug 14.

Characterization of an Aggregated Three-Dimensional Cell Culture Model by Multimodal Mass Spectrometry Imaging

Affiliations

Characterization of an Aggregated Three-Dimensional Cell Culture Model by Multimodal Mass Spectrometry Imaging

Lucy E Flint et al. Anal Chem. .

Abstract

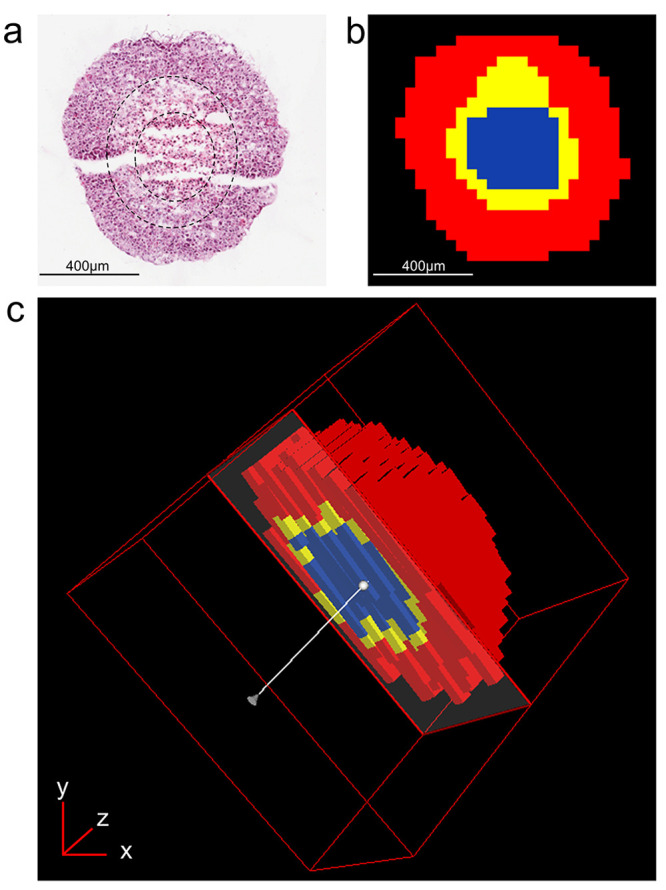
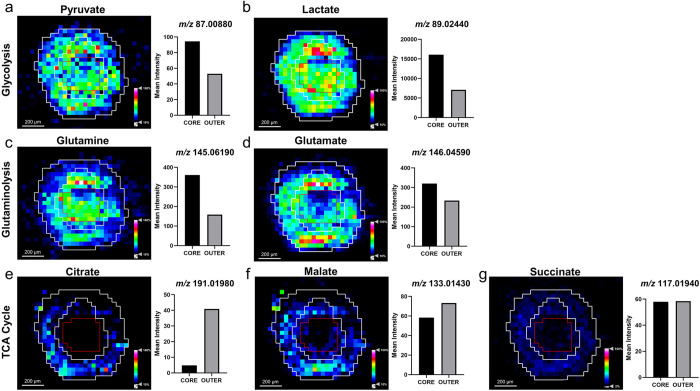
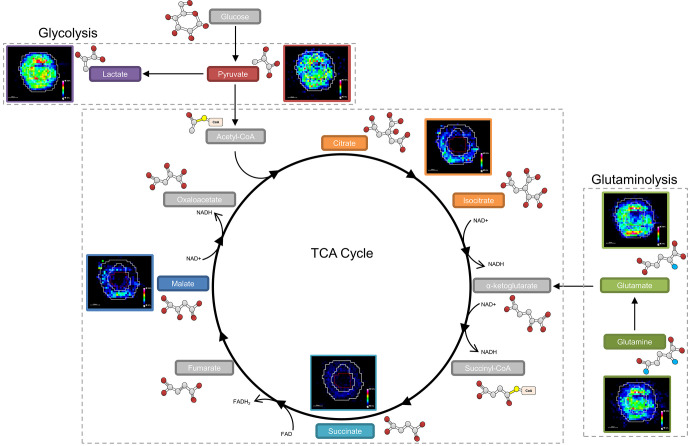
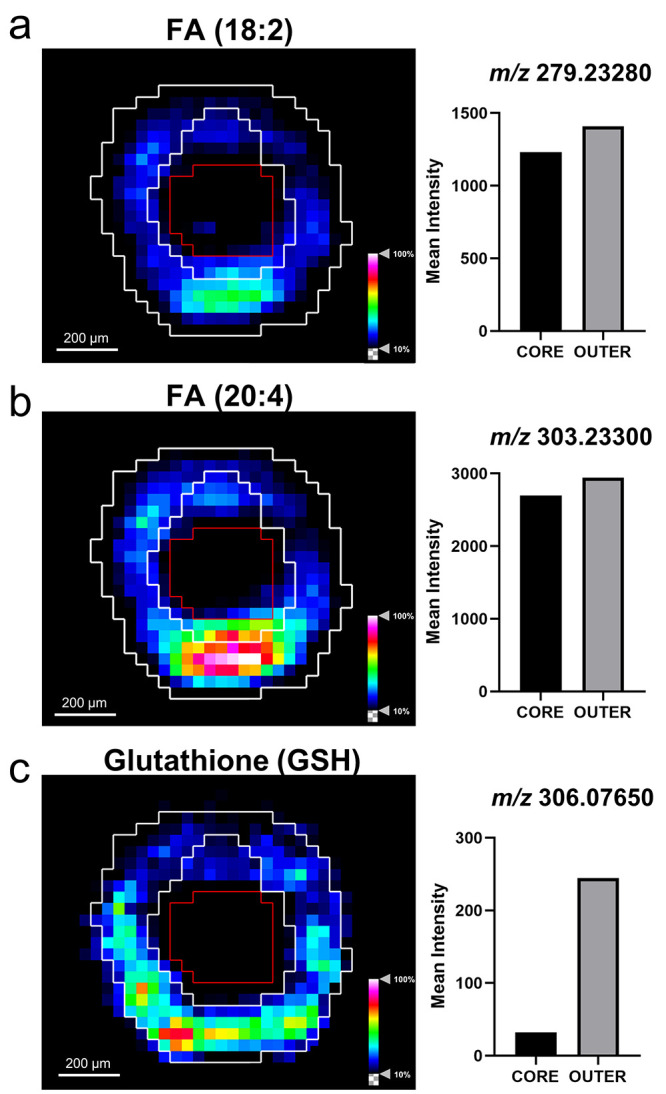
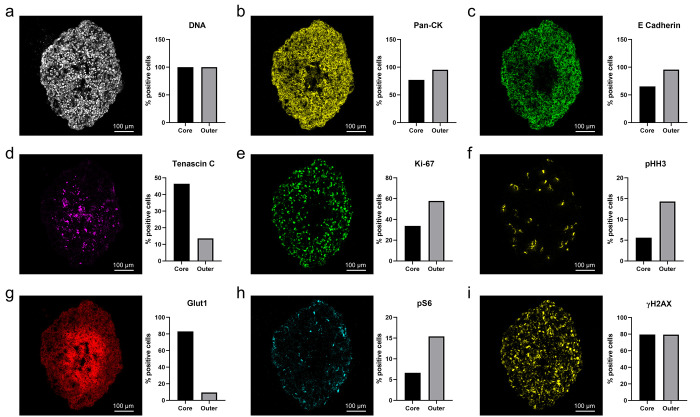
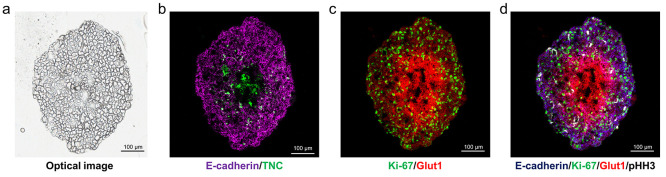
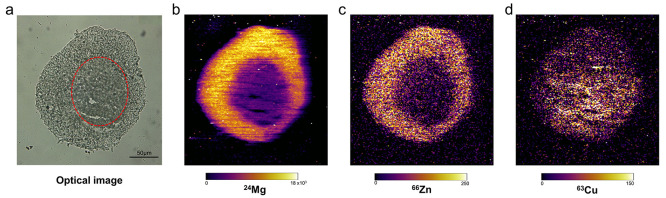
Mass spectrometry imaging (MSI) is an established analytical tool capable of defining and understanding complex tissues by determining the spatial distribution of biological molecules. Three-dimensional (3D) cell culture models mimic the pathophysiological environment of in vivo tumors and are rapidly emerging as a valuable research tool. Here, multimodal MSI techniques were employed to characterize a novel aggregated 3D lung adenocarcinoma model, developed by the group to mimic the in vivo tissue. Regions of tumor heterogeneity and the hypoxic microenvironment were observed based on the spatial distribution of a variety of endogenous molecules. Desorption electrospray ionization (DESI)-MSI defined regions of a hypoxic core and a proliferative outer layer from metabolite distribution. Targeted metabolites (e.g., lactate, glutamine, and citrate) were mapped to pathways of glycolysis and the TCA cycle demonstrating tumor metabolic behavior. The first application of imaging mass cytometry (IMC) with 3D cell culture enabled single-cell phenotyping at 1 μm spatial resolution. Protein markers of proliferation (Ki-67) and hypoxia (glucose transporter 1) defined metabolic signaling in the aggregoid model, which complemented the metabolite data. Laser ablation inductively coupled plasma (LA-ICP)-MSI analysis localized endogenous elements including magnesium and copper, further differentiating the hypoxia gradient and validating the protein expression. Obtaining a large amount of molecular information on a complementary nature enabled an in-depth understanding of the biological processes within the novel tumor model. Combining powerful imaging techniques to characterize the aggregated 3D culture highlighted a future methodology with potential applications in cancer research and drug development.


Conflict of interest statement

The authors declare no competing financial interest.

Figures

Figure 1
Figure 1
Spatial segmentation of HCC827 aggregoid model from metabolite data by DESI-MSI. (a) H&E stain of central aggregoid section showing three separate regions within the tissue. Slight fissures can be observed in the tissue which formed during sectioning. Scale bar 400 μm. (b) Spatial segmentation of central aggregoid section identified three clustering regions that correspond to the hypoxia gradient: necrotic core (blue), annular quiescent region (yellow), and proliferative outer region (red). Scale bar 400 μm. (c) Realigned 3D construct of aggregoid displaying segmentation pattern throughout the model.
Figure 2
Figure 2
Distribution of metabolites regulating cancer growth and survival within the HCC827 aggregoid central section by DESI-MSI. Ion density maps of metabolites outlining the core and the outer area on the image. Mean intensity plotted on bar graph against the core and outer regions. Scale bar 200 μm. Intermediates of the glycolysis reaction: (a) pyruvate, m/z 87.00880 and (b) lactate, m/z 89.02440. Glutaminolysis reaction: (c) glutamine, m/z 145.06190 and (d) glutamate, m/z 146.04590. TCA cycle: (e) citrate, m/z 191.01980; (f) malate, m/z 133.01430; and (g) succinate, m/z 117.01940.
Figure 3
Figure 3
Mapping metabolites to biological pathways defined areas of tumor metabolism. The glycolysis reaction is highly expressed across the whole aggregoid section demonstrating the Warburg effect. Conversion of glutamine to glutamate is showing reduced expression in the core. The TCA intermediates present within the proliferative outer region. Metabolite images obtained by DESI-MSI analysis. Intermediates acetyl-CoA, α-ketoglutarate, succinyl-CoA, fumarate, and oxaloacetate were not observed.
Figure 4
Figure 4
Fatty acid species observed in proliferative outer region by DESI-MSI. Ion density maps of metabolites outlining the core and the outer area on the image. Mean intensity plotted on bar graph against the core and outer regions. Scale bar 200 μm. (a) FA (18:2), m/z 279.23280; (b) FA (20:4), m/z 303.23300; (c) GSH, m/z 306.07650.
Figure 5
Figure 5
Representative IMC images of biological processes at subcellular detail in the HCC827 aggregoid model. Scale bar, 100 μm. Percentage positive cells plotted on bar graph against the core and outer regions. (a) DNA intercalator identified individual cells within the aggregoid section. Epithelial tumor markers: (b) Pan-CK, (c) E-Cadherin, and (d) Tenascin C (TNC). Proliferation markers: (e) Ki-67 and (f) pHH3. Hypoxia influenced markers: (g) pHH3 and (h) pS6. DNA damage marker: (i) γH2AX.
Figure 6
Figure 6
Structural organization of biological processes for in-depth phenotyping of HCC827 aggregoid model by IMC. (a) Optical image of aggregoid prior to staining with antibodies and image analysis. Scale bar, 200 μm. Overlay of IMC markers displays representative images of (b) epithelial tumor markers: Ecadherin, TNC; (c) proliferation and hypoxia, Ki-67 and Glut1; (d) overlay image combining markers of epithelial tumor, proliferation, hypoxia, and mitosis: E-cadherin, Ki-67, Glut1, and pHH3, respectively. Scale bar, 100 μm.
Figure 7
Figure 7
Elemental distributions within HCC827 aggregoid sections obtained using LA-ICP-MS. (a) Optical image taken before acquisition; necrotic region outlined by red dotted line. Scale bar 50 μm. Elemental maps of (b) 24Mg, (c) 66Zn, and (d) 63Cu within the section of aggregoid.

References

    1. Swales J. G.; Hamm G.; Clench M. R.; Goodwin R. J. A. Mass spectrometry imaging and its application in pharmaceutical research and development: A concise review. Int. J. Mass Spectrom. 2019, 437, 99–112. 10.1016/j.ijms.2018.02.007. - DOI
    1. Buchberger A. R.; DeLaney K.; Johnson J.; Li L. Mass Spectrometry Imaging: A Review of Emerging Advancements and Future Insights. Anal. Chem. 2018, 90, 240–265. 10.1021/acs.analchem.7b04733. - DOI - PMC - PubMed
    1. Stoeckli M.; Chaurand P.; Hallahan D. E.; Caprioli R. M. Imaging mass spectrometry: A new technology for the analysis of protein expression in mammalian tissues. Nat. Med. 2001, 7, 493–496. 10.1038/86573. - DOI - PubMed
    1. Weaver E. M.; Hummon A. B. Imaging mass spectrometry: From tissue sections to cell cultures. Advanced Drug Delivery Reviews. Adv. Drug Delivery Rev. 2013, 65, 1039–1055. 10.1016/j.addr.2013.03.006. - DOI - PubMed
    1. Takats Z.; Wiseman J. M.; Gologan B.; Cooks R. G. Mass Spectrometry Sampling Under Ambient Conditions with Desorption Electrospray Ionization. Science 2004, 306, 471–473. 10.1126/science.1104404. - DOI - PubMed

Publication types

MeSH terms