. 2020 Sep 4;19(9):3620-3630.
doi: 10.1021/acs.jproteome.0c00443. Epub 2020 Aug 26.

Considerations for MALDI-Based Quantitative Mass Spectrometry Imaging Studies

Considerations for MALDI-Based Quantitative Mass Spectrometry Imaging Studies

Fernando Tobias et al. J Proteome Res. .

Abstract

Significant advances in mass spectrometry imaging (MSI) have pushed the boundaries in obtaining spatial information and quantification in biological samples. Quantitative MSI (qMSI) has typically been challenging to achieve because of matrix and tissue heterogeneity, inefficient analyte extraction, and ion suppression effects, but recent studies have demonstrated approaches to obtain highly robust methods and reproducible results. In this perspective, we share our insights into sample preparation, how the choice of matrix influences sensitivity, construction of calibration curves, signal normalization, and visualization of MSI data. We hope that by articulating these guidelines that qMSI can be routinely conducted while retaining the analytical merits of other mass spectrometry modalities.

Keywords: MALDI; calibration curve; color schemes; mass spectrometry imaging; matrix; quantitative.


Conflict of interest statement

The authors declare no competing financial interest.

Figures

Figure 1.
Figure 1.
A graphical representation of the limit of detection (LOD) and the limit of quantitation (LOQ), relative to the linear range of a calibration curve.
Figure 2.
Figure 2.
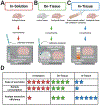
Three common approaches to generate calibration curves. (A) The in-solution method is conducted by spotting calibration standards directly on the target plate or ITO slide. (B) The on-tissue method utilizes a control sample which is sectioned and mounted next to the sample section. The control section is spotted with calibration standards prior to the imaging analysis. (C) The in-tissue method utilizes a tissue mimetic model which has been serially molded and frozen to contain different concentrations of the calibration standard. This tissue mimetic model is then sectioned and mounted next to the sample section. (D) A summary table of the characteristics of each method, in which the star indicates the performance (low = 1-star, high = 5-star). Adapted with permission from Porta et al. Copyright 2015, Springer.
Scheme 1.
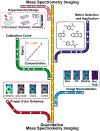
Scheme 1.. Considerations toward Conducting Quantitative Mass Spectrometry Imaginga
aThe central yellow line is connected to other “metro lines” that represent a topic discussed in this perspective. The pink line represents experimental design and sources of variability, the purple line signifies the matrix selection process and application methods, the green line represents creating calibration curves for qMSI, the blue line symbolizes the image normalization aspect, while the red line represents the selection process for the proper color scheme of imaging data. The MS images depicted in this scheme are from the same murine heart section in a different color scheme and when the signal was normalized by different methods.

References

    1. Schulz S; Becker M; Groseclose MR; Schadt S; Hopf C Advanced MALDI mass spectrometry imaging in pharmaceutical research and drug development. Curr. Opin. Biotechnol 2019, 55, 51–59. - PubMed
    1. Bowman AP; Heeren RMA; Ellis SR Advances in mass spectrometry imaging enabling observation of localised lipid biochemistry within tissues. TrAC, Trends Anal. Chem 2019, 120, 115197.
    1. Buchberger AR; Vu NQ; Johnson J; DeLaney K; Li L A Simple and Effective Sample Preparation Strategy for MALDI-MS Imaging of Neuropeptide Changes in the Crustacean Brain Due to Hypoxia and Hypercapnia Stress. J. Am. Soc. Mass Spectrom 2020, 31 (5), 1058–1065. - PMC - PubMed
    1. Ryan DJ; Spraggins JM; Caprioli RM Protein identification strategies in MALDI imaging mass spectrometry: a brief review. Curr. Opin. Chem. Biol 2019, 48, 64–72. - PMC - PubMed
    1. Palmer A; Trede D; Alexandrov T Where imaging mass spectrometry stands: here are the numbers. Metabolomics 2016, 12 (6), 107.

Publication types

MeSH terms