. 2020 Aug 26;142(34):14481-14494.
doi: 10.1021/jacs.0c03842. Epub 2020 Aug 13.

Nanoscale Spatial Distribution of Supported Nanoparticles Controls Activity and Stability in Powder Catalysts for CO Oxidation and Photocatalytic H2 Evolution

Affiliations

Nanoscale Spatial Distribution of Supported Nanoparticles Controls Activity and Stability in Powder Catalysts for CO Oxidation and Photocatalytic H2 Evolution

Alexander Holm et al. J Am Chem Soc. .

Abstract

Supported metal nanoparticles are essential components of high-performing catalysts, and their structures are intensely researched. In comparison, nanoparticle spatial distribution in powder catalysts is conventionally not quantified, and the influence of this collective property on catalyst performance remains poorly investigated. Here, we demonstrate a general colloidal self-assembly method to control uniformity of nanoparticle spatial distribution on common industrial powder supports. We quantify distributions on the nanoscale using image statistics and show that the type of nanospatial distribution determines not only the stability, but also the activity of heterogeneous catalysts. Widely investigated systems (Au-TiO2 for CO oxidation thermocatalysis and Pd-TiO2 for H2 evolution photocatalysis) were used to showcase the universal importance of nanoparticle spatial organization. Spatially and temporally resolved microkinetic modeling revealed that nonuniformly distributed Au nanoparticles suffer from local depletion of surface oxygen, and therefore lower CO oxidation activity, as compared to uniformly distributed nanoparticles. Nanoparticle spatial distribution also determines the stability of Pd-TiO2 photocatalysts, because nonuniformly distributed nanoparticles sinter while uniformly distributed nanoparticles do not. This work introduces new tools to evaluate and understand catalyst collective (ensemble) properties in powder catalysts, which thereby pave the way to more active and stable heterogeneous catalysts.


Conflict of interest statement

The authors declare no competing financial interest.

Figures
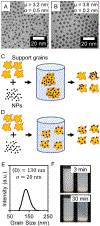
Figure 1.
Figure 1.. Conventional and surfactant-assisted deposition of NPs onto TiO2.
(A) TEM micrograph of Au NPs and (B) of Pd NPs. NP size distributions are included in Figure S1. (C) Schematic illustration of conventional impregnation and (D) surfactant-assisted impregnation of NPs on metal oxide support grains. (E) DLS size distribution of TiO2 grains in hexanes with surfactant. DLS measurement of TiO2 in pure hexanes was not possible due to fast agglomeration and sedimentation of grains. (F) Photographs of TiO2 dispersion in hexanes with surfactant (left) and in pure hexanes (right) at different times, 3 min and 30 min, after sonication.
Figure 2.
Figure 2.. Statistics of NP spatial distributions.
(A, C) Typical TEM micrographs of Au-TiO2-SA and (B, D) Au-TiO2-C exemplifying regions with low and high NP number-density. (E) NP number-density distributions of Au NPs on TiO2 grains. Au-TiO2-C has non-uniform, log-normal distribution (red curve), and Au-TiO2-SA has uniform, normal distribution (blue, dashed curve). (F) Cumulative fractions of Au NPs vs NP number-density on Au-TiO2-C, red curve and Au-TiO2-SA, blue dashed curve. (G, I) Typical TEM micrographs of Pd-TiO2-SA and (H,J) Pd-TiO2-C exemplifying regions with low and high NP number-density. (K) NP number-density distributions of Pd NPs on TiO2 grains. Pd-TiO2-C has non-uniform, log-normal distribution (red curve), while Pd-TiO2-SA has uniform, normal distribution (blue, dashed curve). (L) Cumulative fractions of Pd NPs vs NP number-density on Pd-TiO2-C, red curve and Pd-TiO2-SA, blue dashed curve. The statistical parameters describing the normal, ρ# ~ N(μ, δ2) and log-normal, ln(ρ#) ~ N(μ, δ2), distributions in (E,K) are given in Table S1.
Figure 3.
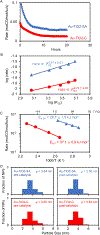
Figure 3.. Distribution-Dependent CO Oxidation Catalysis on Au-TiO2.
(A) Transient CO oxidation rates on Au-TiO2-SA, upper curve and Au-TiO2-C, lower curve. Additional repeat measurements (Figure S3) show high reproducibility. (B) O2 reaction orders measured after reaction rate stabilization on Au-TiO2-SA, upper curve and Au-TiO2-C, lower curve. (C) Arrhenius plots collected after reaction rate stabilization on Au-TiO2-SA, upper curve and Au-TiO2-C, lower curve. The apparent activation energy of CO oxidation on Au-TiO2-C (37.1 ± 0.9 kJ mol−1) is higher than on Au-TiO2-SA (29.7 ± 1.5 kJ mol−1) with a 99.993 % confidence level (see Supporting Section S2). (D) Particle size distributions before and after catalytic activity for Au-TiO2-SA and Au-TiO2-C. Typical TEM images before and after catalytic activity are given in Figure S4.
Figure 4.
Figure 4.. Spatially and temporally resolved microkinetic model of CO oxidation on Au-TiO2.
(A) Schematic illustration of reaction zones, illustrated in semi-transparent red, around NPs in a low NP number-density region (top) and high NP number-density region (bottom). Surface coverage of Oact is lower in the high NP number-density region because the reaction zones around individual NPs overlap to a larger degree than in low NP number-density regions. (B) Illustration of model used for computational treatment. Our model consists of two Au regions, separated by a variable distance of TiO2 surface. High NP number-density regions are thus represented by short distances between the gold regions, while lower NP number-density regions are represented by larger distances. (C) Surface coverage of Oact as a function of position between Au regions during steady-state CO oxidation. Plots were generated for different separations between Au regions ranging from 0.5 nm to 20 nm. (D) Steady-state CO oxidation rates (per meter of Au/TiO2 perimeter) as a function of separation between Au regions.
Figure 5.
Figure 5.. Distribution-Dependent H2 Evolution Photocatalysis on Pd-TiO2.
(A) Transient H2 production QEs with Pd-TiO2-SA, upper curve and Pd-TiO2-C, lower curve. Additional repeat measurements (Figure S7) show high reproducibility. (B) Transient absorption measured at 770 nm in 1:1 water:ethanol of pure TiO2, Pd-TiO2-SA and Pd-TiO2-C before and after photocatalysis. Full spectra at 50 ps delay time are given in Figure S8. (C) Size distributions of Pd NPs on Pd-TiO2-SA before (blue) and after (brown) catalysis. (D) TEM micrograph of high NP number-density region on Pd-TiO2-SA before and (E) after catalysis. (F) Size distributions of Pd NPs on Pd-TiO2-C before (blue) and after (brown) catalysis. (G) TEM micrograph of high NP number-density region on Pd-TiO2-C before and (H) after catalysis. Boxed sections in the size distributions (C, F) are used to highlight the difference in particle growth between Pd-TiO2-SA and Pd-TiO2-C.

References

    1. Hvolbaek B; Janssens TVW; Clausen BS; Falsig H; Christensen CH; Norskov JK Catalytic Activity of Au Nanoparticles. Nano Today 2007, 2 (4), 14–18.
    1. Corma A; Garcia H Supported Gold Nanoparticles as Catalysts for Organic Reactions. Chem. Soc. Rev. 2008, 37 (9), 2096–2126. - PubMed
    1. Munnik P; de Jongh PE; de Jong KP Recent Developments in the Synthesis of Supported Catalysts. Chem. Rev. 2015, 115 (14), 6687–6718. - PubMed
    1. Losch P; Huang W; Goodman ED; Wrasman CJ; Holm A; Riscoe AR; Schwalbe JA; Cargnello M Colloidal Nanocrystals for Heterogeneous Catalysis. Nano Today 2019, 24, 15–47.
    1. Nie Z; Petukhova A; Kumacheva E Properties and Emerging Applications of Self-Assembled Structures Made from Inorganic Nanoparticles. Nat. Nanotechnol. 2010, 5 (1), 15–25. - PubMed

Publication types