

Enhanced Production and Anticancer Properties of Photoactivated Perylenequinones
- PMID: 32786877
- PMCID: PMC7493285
- DOI: 10.1021/acs.jnatprod.0c00492
Enhanced Production and Anticancer Properties of Photoactivated Perylenequinones
Erratum in
-
Correction to Enhanced Production and Anticancer Properties of Photoactivated Perylenequinones.J Nat Prod. 2020 Dec 24;83(12):3765-3766. doi: 10.1021/acs.jnatprod.0c01289. Epub 2020 Dec 14. J Nat Prod. 2020. PMID: 33314937 No abstract available.
Abstract
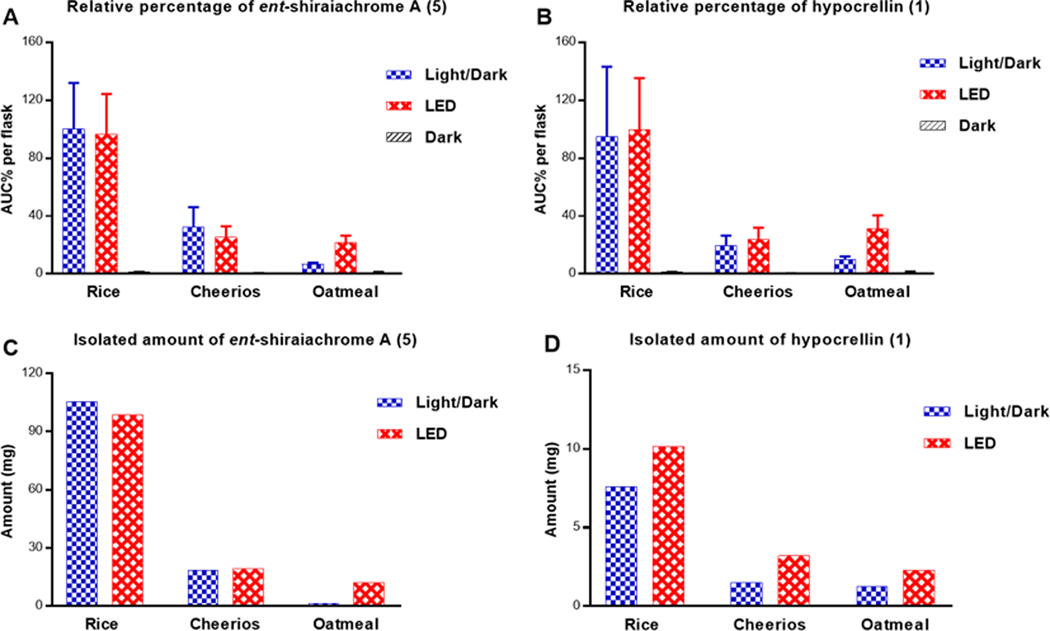
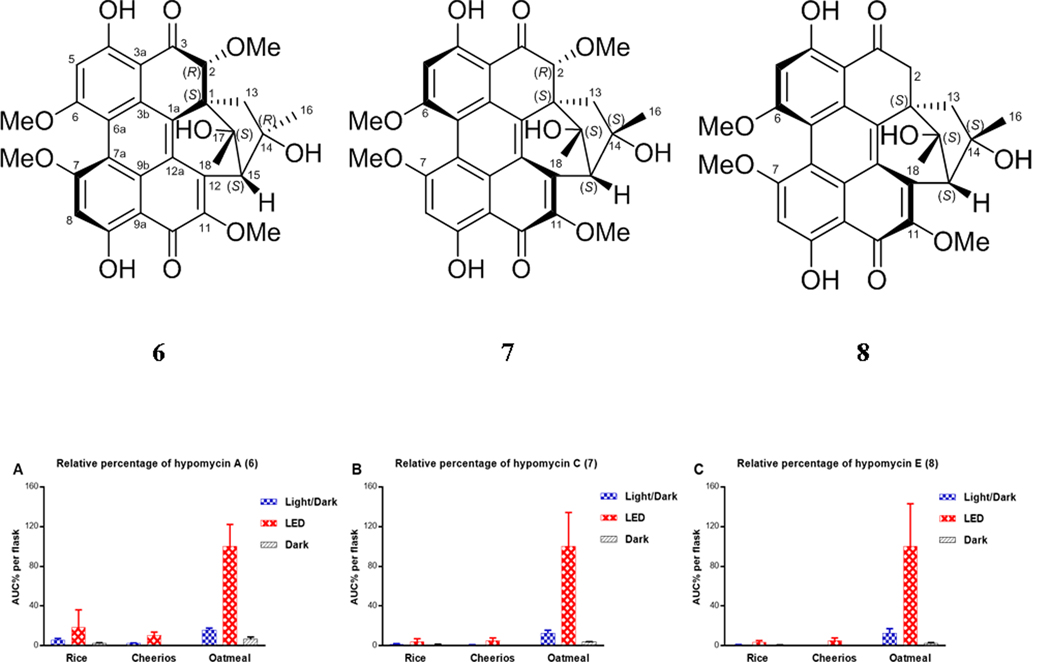
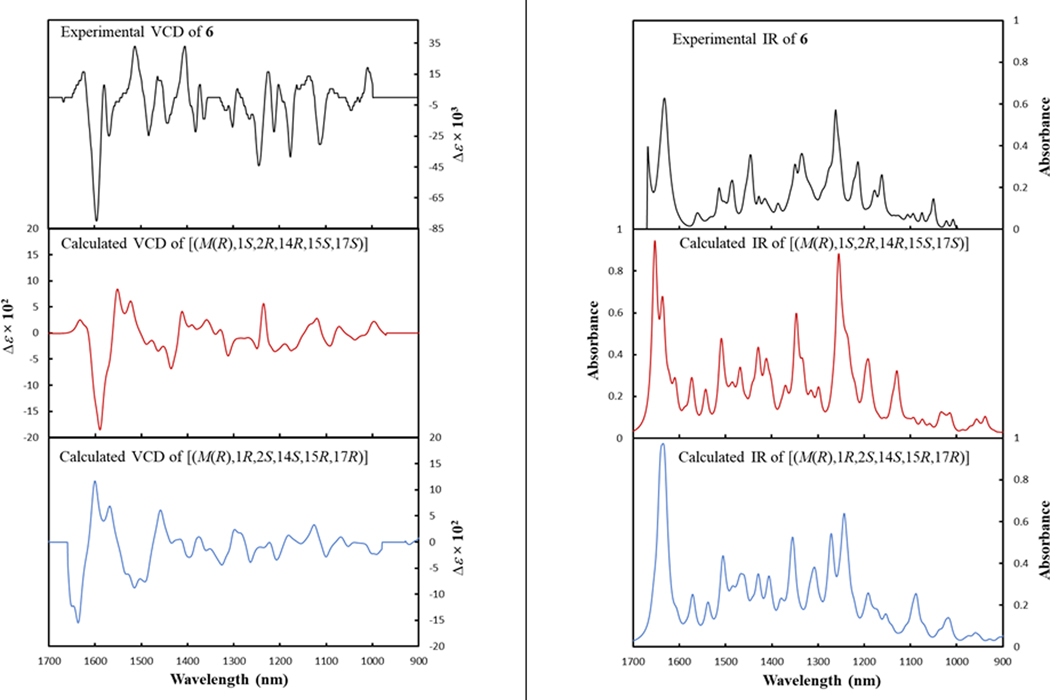
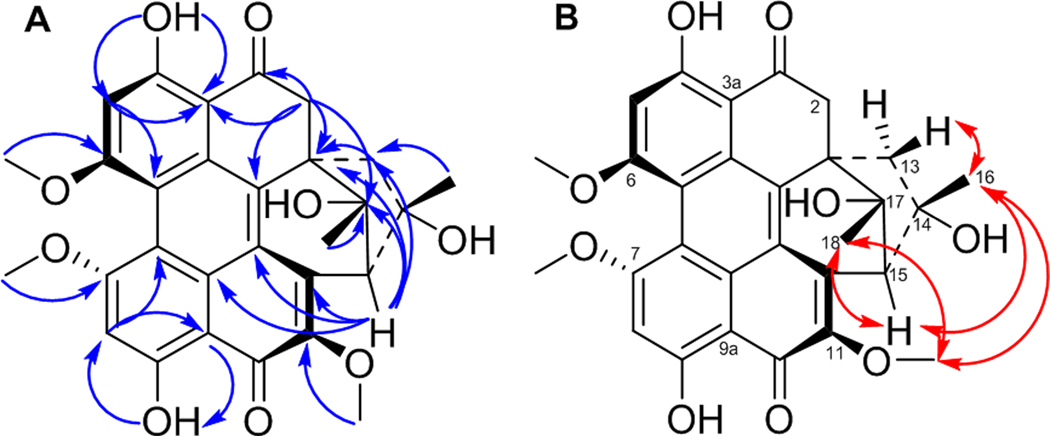
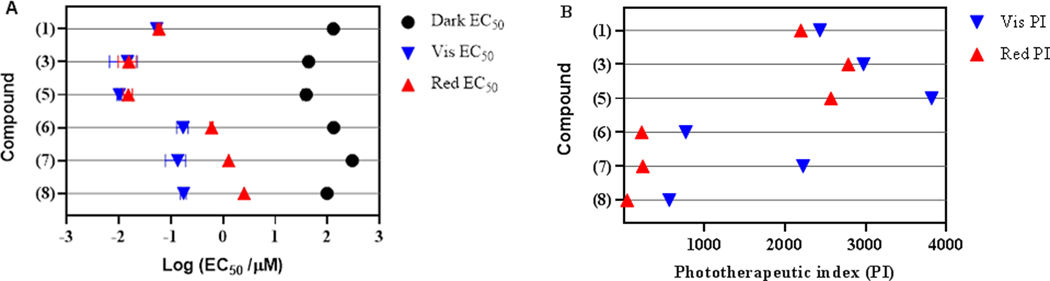
Hypocrellins and hypomycins are naturally occurring fungal perylenequinones with potential photodynamic activity against cancer and microbial diseases. This project pursued three lines of research. First, the production of perylenequinones was enhanced by investigating the effect of culture medium and light exposure on their biosynthesis. Solid-fermentation cultures on rice medium allowed for enhanced production of hypocrellins as compared to Cheerios or oatmeal medium. Alternatively, increased production of hypomycins, which are structurally related to the hypocrellins, was observed on oatmeal medium. In both cases, light exposure was an essential factor for the enhanced biosynthesis. In addition, this led to the discovery of two new perylenequinones, ent-shiraiachrome A (5) and hypomycin E (8), which were elucidated based on spectroscopic data. Finally, the photocytotoxic effects of both classes of compounds were evaluated against human skin melanoma, with EC50 values at nanomolar levels for hypocrellins and micromolar levels for hypomycins. In contrast, both classes of compounds showed reduced dark toxicity (EC50 values >100 μM), demonstrating promising phototherapeutic indices.
Figures
References
-
- Wei-Shin C; Yuan-Teng C; Xiang-Yi W; Friedrichs E; Puff H; Breitmaier E. Liebigs Ann. Chem. 1981, 1981, 1880–1885.
-
- Wu H; Lao X-F; Wang Q-W; Lu R-R; Shen C; Zhang F; Liu M; Jia L. J. Nat. Prod. 1989, 52, 948–951.
-
- Morakotkarn D; Kawasaki H; Seki T; Okane I; Tanaka K. Mycoscience 2008, 49, 258–265.
-
- Diwu Z. Photochem. Photobiol. 1995, 61, 529–539. - PubMed
Publication types
MeSH terms
Substances
Grants and funding
LinkOut - more resources
Full Text Sources
Research Materials
Miscellaneous
